American Journal of Engineering Research (AJER)
e-ISSN: 2320-0847 p-ISSN : 2320-0936
Volume-4, Issue-8, pp-244-249
www.ajer.org
Research Paper Open Access
Estimation of Modulus of Elasticity of Sand Using Plate Load Test
M. G. Kalyanshetti
1, Dr. S. A. Halkude
2, D. A. Magdum
3, K. S. Patil
4 1,2,3,4(Civil Engineering Department, Walchand Institute of Technology, Solapur, India)Abstract: Soil being a natural material, is very complex to understand mainly because of its heterogeneous
nature. The other factors making the soil further complex are three phase system, non-linear stress-strain curve, loading and drainage conditions on field etc. Under all these circumstances evaluation of elastic constants of soil is a challenging task. The real challenge is to simulate the field condition precisely in the laboratory. Using tri-axial drained test, it is possible to simulate field condition for the evaluation of elastic constants such as modulus of elasticity (Es) and Poisson’s ratio (µ). However, for sandy soil it is difficult to perform the tri-axial test because of its non-cohesive nature and limitation in the preparation of the test sample (cylindrical specimen). To overcome this limitation in the present study, an attempt is made to evaluate the modulus of elasticity using plate load test analogy. Loading frame is utilized for employing loads on the plates. Load settlement curves obtained from plate load tests are used for determination of the modulus of elasticity. The test is carried out using three plates of different sizes. The modulus of elasticity is calculated by assuming different values of Poisson’s ratio. The study reveals that, modulus of elasticity is in the range of 22 to 25 MPa, which reasonably falls in the range given in different literature. The studied range of Poisson’s ratio is not significantly influencing the Modulus of Elasticity of sand.Keywords:
Elastic theory, Loading frame, Load -settlement curve, Modulus of elasticity, Plate load test, Poisson’s ratio.I.
Introduction
II.
Experimental Study
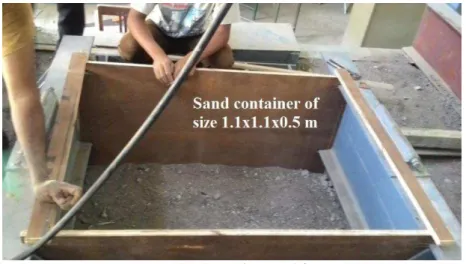
Test SetupThe plate load set up is developed using a loading frame. For retaining the sand, a container of size 1.1 x 1.1 x 0.5 m is prepared. Two opposite sides of container are made up of steel plates and remaining two sides are made up of plywood of thickness 18 mm as shown in Fig. 1. The bottom of container is open so that influence zone of pressure under the plates is kept unconstrained.
Fig. 1 Sand container used for study
Fig.2 shows loading frame used for study.
Fig. 2 Loading frame
Fig. 2 Loading frame
Table 1 Properties of sand
Sr. No. Properties Result
1 Specific Gravity 2.82
2 Water Absorption (%) 1.27
3 Strength Parameters
(a) Soil internal frictional angle (Ø) in degrees 51 (b) Cohesion ‘C’ (kN/m2) 0
4 Fineness Modulus 4.9
5 Unit Weight (kN/m3) 18.01
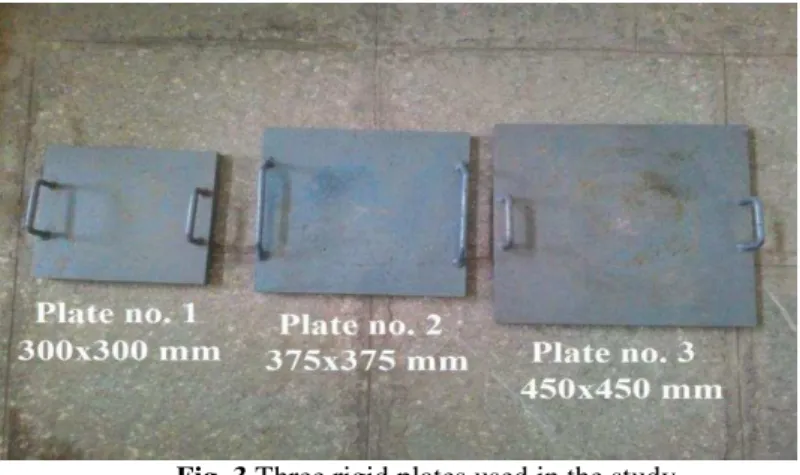
Three rigid plates of different sizes are used for test which are shown in Fig. 3.
Fig. 3 Three rigid plates used in the study
Experiments are carried out to determine settlement beneath square plates resting on surface of sand. The settlement is measured with the help of sensitive dial gauges fixed on the surface of plate. The dial gauges are mounted on independently supported datum bars. As the plate settles, the ram of the dial gauge moves down and settlement is recorded. The load is indicated on the load–gauge of hydraulic jack. Fig. 4 shows plate load test setup.
Fig. 4 Plate load test setup
Test Procedure
III.
Results And Discussion
Load Settlement CurveSettlements are recorded for three plates of different sizes. The values of loads and corresponding settlements of each plate are given in Table 2, Table 3 and Table 4.
Table 2 Load and corresponding settlement for plate no. 1
Load (N) Pressure ‘q’ (N/mm2) Settlement ‘(mm) Si’
0 0 0
10000 0.111 2.280
15000 0.167 2.430
20000 0.222 3.480
25000 0.278 3.800
35000 0.389 4.620
45000 0.5 5.710
Table 3 Load and corresponding settlement for plate no. 2
Load (N) Pressure ‘q’
(N/mm2) Settlement ‘
Si’ (mm)
0 0 0
10000 0.0711 1.665
15000 0.107 2.175
20000 0.142 2.600
25000 0.178 3.050
35000 0.249 3.540
45000 0.32 4.940
Table 4 Load and corresponding settlement for plate no. 3
Load (N) Pressure ‘q’
(N/mm2) Settlement ‘(mm) Si’
0 0 0
10000 0.0494 1.370
15000 0.0741 1.500
20000 0.0988 1.585
25000 0.123 1.935
35000 0.173 2.710
45000 0.222 3.450
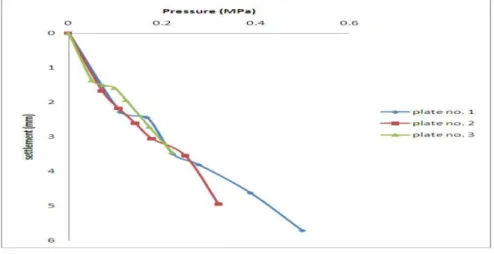
From these values, pressure v/s settlement curves are plotted as shown Fig. 5.
Fig. 5 Pressure v/s settlement curve for all plates
Fig. 6 Load settlement curve
Fig. 6 shows a typical load settlement curve for loose to medium cohesionless soil. Looking to the nature of load settlement curves of present study, it is observed that these curves are almost matching with the typical curve given for loose to medium cohesionless soil (Sandy soil), which almost matches with sand used for study. Hence, it may be inferred that the obtained load settlement curve of sand reasonably matches with the curves given in the literature.
Evaluation of Modulus of Elasticity (Es)
The theory of elasticity can be used to determine elastic settlement in soil caused by loads acting over footings of different geometrical shapes. The modulus of elasticity of sand can be computed from the following expression based on the theory of elasticity (Terzaghi).
Si = qB (1)
Where, Si is immediate elastic settlement of soil, q is intensity of contact pressure, B is least lateral
dimension of footing, Es is modulus of elasticity of soil, µ is Poisson’s ratio, If is influence factor.
It is difficult to determine Poisson’s ratio for sand. However, the entire term from eq. (1) is determined from plate load test by using three different size plates of the same shape. A plot between Si and q.B
gives a straight line, the slope of which is equal to . In the present study, loads applied on the plates are
10 kN, 15 kN, 20 kN, 25 kN, 35 kN and 45 kN. The values of Si and q.B for all loads and plates are plotted and
shown in Fig. 7.
Fig. 7 Plot of Si v/s q.B for all loads
It is observed from Fig. 7 that, variation of Si with respect to q.B is almost straight line (linear). It is
Effect of Poisson’s Ratio
From the literature it is revealed that, the Poisson’s ratio of sand varies from 0.3 to 0.45 [5]. To
understand the variation of modulus of elasticity with respect to Poisson’s ratio, the Es value is calculated for
Poisson’s ration in the range of 0.3 to 0.46. Influence factor (If) is taken as 0.9 for the rigid square plate [6].
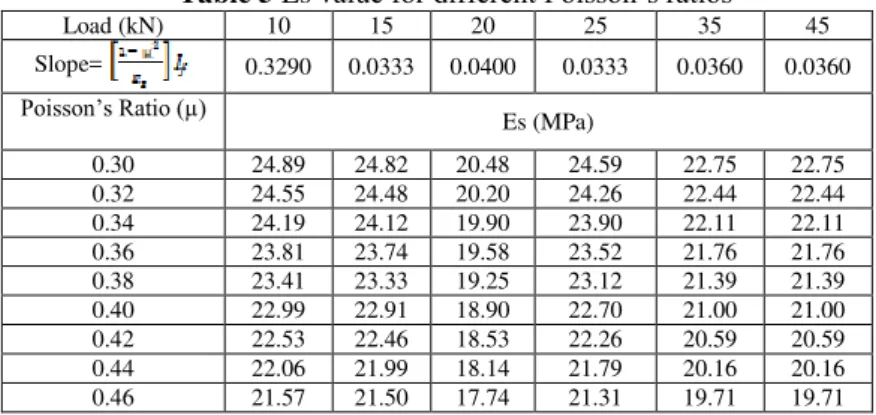
Table 5 gives the values of modulus of elasticity for different values of µ.
Table 5 Es value for different Poisson’s ratios
Load (kN) 10 15 20 25 35 45
Slope= 0.3290 0.0333 0.0400 0.0333 0.0360 0.0360
Poisson’s Ratio (µ) Es (MPa)
0.30 24.89 24.82 20.48 24.59 22.75 22.75
0.32 24.55 24.48 20.20 24.26 22.44 22.44
0.34 24.19 24.12 19.90 23.90 22.11 22.11
0.36 23.81 23.74 19.58 23.52 21.76 21.76
0.38 23.41 23.33 19.25 23.12 21.39 21.39
0.40 22.99 22.91 18.90 22.70 21.00 21.00
0.42 22.53 22.46 18.53 22.26 20.59 20.59
0.44 22.06 21.99 18.14 21.79 20.16 20.16
0.46 21.57 21.50 17.74 21.31 19.71 19.71
From Table 5, it is observed that for different values of µ, modulus of elasticity does not change very much. The modulus of elasticity of sand is in the range of 20 to 24 MPa. This variation is almost 16 %. The range of modulus of elasticity of sand as per literature is 10 to 25 MPa [2]. Therefore, it can be said that Es value which is experimentally determined confirms the range given in the literature for the soil under consideration.
IV.
Conclusions
Plate load test on field requires reaction loading system on site which is time consuming and difficult task and also it is more cumbersome. Present study advocates the laboratory test is reasonably accurate and less cumbersome. From this study it is proved that, the loading frame can be used to develop the reaction loading system in the laboratory to perform the plate load test under much controlled conditions.
The elastic modulus obtained in the laboratory using plate load test is in the range 20 to 24 MPa. This value is reasonably confirming with the range of modulus of elasticity mentioned in the literature (Bowles).
Study reveals that, for different values of Poisson’s ratio of sand (0.3 to 0.45), modulus of elasticity varies between 14 to 16 %. This variation is marginal. Hence, it can be inferred that Poisson’s ratio is not significantly affecting the modulus of elasticity.
This method of evaluation of modulus of elasticity of sand in the laboratory using plate load test analogy is reasonably accurate than the cumbersome method of tri-axial where the major difficulty is the preparation of sample of sand.
References
[1]. T. Warmate, H.O. Nwankwoala, Determination of elastic modulus using plate load test in Calabar, South-Eastern Nigeria, International Journal of Natural Sciences Research, 2014, 2(11): 237-248.
[2]. Joseph E. Bowles, Foundation Analysis and Design (McGraw-Hill, 1997).
[3]. National Building Code of India, SP 7: 2005.
[4]. IS 1888: Method of load test on soil (second revision), Indian Standards Institution, New Delhi, 1982.
[5]. Narayan V. Nayak, Foundation Design Manual,(Dhanpat Rai Publications, 2006).
[6]. IS 8009 (Part I): Code of practice for calculation of settlements of foundations, Bureau of Indian