Arup Kumar Nandi and Shubhabrata Datta
Arup Kumar Nandi
nandiarup@yahoo.com Central Mechanical Engineering Research Institute (CSIR-CMERI) Advance Design and Optimization 713209 Durgapur, West Bengal, IndiaShubhabrata Datta
sdatt@bitmesra.ac.in Birla Institute of Technology, Deoghar 814142 Deoghar, Jharkhand, IndiaImprovement of Soft Tooling Process
Through Particle Reinforcement with
Polyurethane Mould
Use of conventional flexible polymeric mould materials yields to longer solidification time of (wax/plastic) patterns in soft tooling process, thereby reducing the rapidity of the process to a great extent, which is not desirable in present competitive market. In this work, approach of particle-reinforcement with mould materials is introduced to reduce the cycle time of Soft tooling process and the resulting cooling time is experimentally investigated in considering a case of manufacturing of a typical wax pattern with aluminium particle filled polyurethane. It is observed that cooling time is significantly reduced particularly with higher loading condition of aluminium filler. This happens due to the increase of effective thermal conductivity of mould material. However, it is also found that the stiffness of mould becomes simultaneously high due to increase of effective modulus of elasticity of mould material. Realizing these facts, an extensive study is carried out to find the effect on equivalent thermal properties and modulus of elasticity of polyurethane composite mould materials with the reinforcement of aluminium and graphite particles independently through rigorous experimentation and correlation of experimental findings with the models cited in literatures.
Keywords: soft tooling process, flexible polymeric mould material, particle reinforcement, cooling time, equivalent thermal conductivity, equivalent modulus of elasticity
Introduction1
Among different rapid tooling processes, soft tooling (ST) is the one where polymeric flexible materials are used for making mould (Rosochowski and Matuszak, 2000). ST process is particularly suitable to produce wax patterns in small batch by vacuum assisted or gravity casting method based on RP (rapid prototype)/others pattern. This wax component is used in investment casting process as a pattern to make ceramic slurry and finally metallic components are produced by fusing the wax pattern. Development of metal component through rapid prototyping (RP)-soft tooling-investment casting process is illustrated in Fig. 1.
Nomenclature
φm, Vm = maximum packing fraction of disperse phase
α = thermal diffusivity, mm2/sec k = thermal conductivity, W/m-k
kx = thermal conductivity in x-direction, W/m-k
kz = thermal conductivities in z direction, W/m-k
ρ = density of material c = specific heat of material
T(x, y, z, t) = temperature at point (x, y, z) and time, t Q(x, y, z, t) = amount of heat released at (x, y, z, t) per unit
volume and unit time, J/m3-s
P0 = power output of hot disk sensor per unit time
Q0 = heat released per unit length of hot disk sensor ring
source, J/m3-s
δ( ) = Dirac delta function
a = radius of the largest ring of concentric spiral hot disk sensor, mm
v = half thickness of concentric spiral hot disk sensor, µm m = number of concentric rings of spiral hot disk sensor L = total length of rings of spiral hot disk sensor, mm
σ = an integration variable
τ = characteristic time ratio (dimensionless parameter) D(τ) = dimensionless time function
Paper received 11 May 2010. Paper accepted 22 October 2010. Technical Editor: Anselmo Diniz
∆T(τ) =average temperature increase of hot disk sensor Kc = thermal conductivity of composite, W/m-k
Kp = thermal conductivities of polymer/matrix, W/m-k
Kf = thermal conductivities of filler material, W/m-k
kE = Einstein coefficient
Vf, φ = volumetric fraction of filler in the composite
E = modulus of elasticity, N/mm2 G = shear modulus, N/mm2 K = bulk modulus, N/mm2
Em = modulus of elasticity of matrix/polymer, N/mm2
Ef = modulus of elasticity of filler material, N/mm2
Ec = modulus of elasticity of composite, N/mm2
Gm = shear modulus of matrix/polymer, N/mm 2
Gf = shear modulus of filler material, N/mm2
Gc = shear modulus of composite, N/mm2
Km = bulk modulus of matrix/polymer, N/mm2
Kf = bulk modulus of filler material, N/mm2
Kc = bulk modulus of composite, N/mm2
EL = lower bound of modulus of elasticity, N/mm2 EU = upper bound of modulus of elasticity, N/mm2
K
L SH− = Hashin-Shtrikman lower bound of bulk modulus, N/mm2
K
UH−S = Hashin-Shtrikman upper bound of bulk modulus, N/mm2
G
L SH− = Hashin-Shtrikman lower bound of shear modulus, N/mm2
G
UH−S = Hashin-Shtrikman upper bound of shear modulus, N/mm2PU = polyurethane Al = aluminium RP = rapid prototyping ST = soft tooling
SLA = stereo-Lithography Apparatus TC = thermal conductivity
Figure 1. Development of metal components through RP-ST-wax pattern -investment casting.
The common polymeric flexible mould materials used in soft tooling process are polyurethane (PU), silicone rubber, etc. However, the conventional mould materials possess poor thermal conductivity (TC). Therefore, the solidification time of wax/plastic pattern produced in ST process is long because of poor heat flow rate through the mould wall. As a result, the rapidity of soft tooling process is reduced to a great extent. In order to increase the heat flow rate through mould wall, enhancement of thermal conductivity of mould material is an essential issue which can be achieved either by molecular orientation of polymeric mould material itself in order to synthesize new (highly conductive) polymeric material or by the reinforcement of high conductive fillers into existing mould materials. In the present work, approach of particle-reinforcement with existing mould materials is adopted, because reinforcement of conductive fillers (particularly in the form of particles) into the mould material is the simplest method that may be easily implemented in practical application. Furthermore, the degree of increasing effective thermal conductivity and other mould properties can be easily controlled by deciding proper amount of filler content in the polymer. The resulting cooling time in ST process is experimentally investigated in considering a case of manufacturing of a typical wax pattern with aluminium filled polyurethane.
Through experimentation, it is observed that cooling time is significantly reduced particularly with higher loading condition of aluminium filler, due to the increase of effective thermal conductivity of mould material. But simultaneously it is also found that the stiffness of mould becomes high due to increase of modulus of elasticity of mould material. High stiffness of mould is not desirable in soft tooling process, because releasing pattern and wax component from the mould box becomes difficult. Therefore, it is important to carry out an extensive experimental study to find the effect on equivalent thermal properties and modulus of elasticity of polyurethane composites by reinforcing aluminium and graphite particles independently with different loading conditions.
A significant amount of research works was found where particulate filler materials were introduced in polymer to increase its effective thermal conductivity (Agrawal et al., 2000; Boudenne et al., 2004; Miller et al., 2006; Mu, Feng and Diao, 2007; Subodh et al., 2008; Vinod, Varghese and Kuriakose, 2004; Sundstrom and Chen, 1970; Kim et al., 2008; Pal, 2007). The equivalent thermal conductivity (ETC) of particulate filled polymer composites was also investigated with the variation of various morphological properties of conductive filler particles (Ye, Shentu and Weng, 2006), multi-modal particle size mixing (Yung and Liem, 2007) as well as using hybrid filler materials (Lee et al., 2006). Moreover, addition of filler particles in mould material increases the effective modulus of elasticity of mould materials (Tavman, 1997; Rusu, Sofian and Rusu, 2001; Papanicolaou and Bakos, 1992).
In the present work, equivalent thermal and mechanical properties of particle reinforced polyurethane composites are analysed through rigorous experimentation. In addition, various predictive models of equivalent thermal conductivity and modulus
of elasticity reported in the literature are tried to validate based on the experimental results which will be highly helpful in industry for estimation of time requirement for manufacturing a component in ST process.
The rest of the article is organized as follows: the second section describes the materials and morphology of filler particle. Details of experimentation with results of cooling time in ST process are presented in the third section. Measurement procedures, discussions on experimental results and validation of model(s) of equivalent thermal conductivity and modulus of elasticity of Al and graphite particle reinforced polyurethane are illustrated in the fourth and fifth sections, respectively. Finally, concluding remarks are drawn in the sixth section.
Flexible Mould Material and Particulate Fillers
Flexible mould materials
In the present study on the effect of cooling time in ST process using particle reinforcement with flexible mould materials, we have considered polyurethane (of type PMC 121/50) produced by Smooth-ON, Inc. USA. The polyurethane (PU) mould material has two parts, Part A (liquid polymer) and hardener/Part B. Both Part A and Part B are mixed in the ratio of 1:1 either in weight or volume and normally cured in room temperature. The value of thermal conductivity (kp) of cured PU mould material as experimentally found is 0.1615 W/m-k.
Filler particle
Arup Kumar Nandi and Shubhabrata Datta
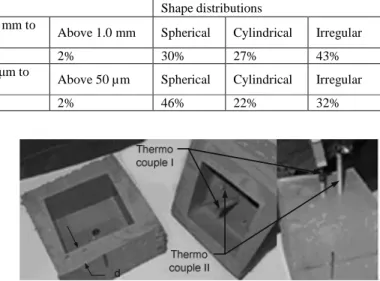
Table 1. Filler particle size and shape distributions.
Filler type Size distributions Shape distributions
Graphite
From 0.1 mm to 0.3 mm
Above 0.3 mm to 0.5 mm
Above 0.5 mm to
1.0 mm Above 1.0 mm Spherical Cylindrical Irregular
72% 18% 8% 2% 30% 27% 43%
Al
From 1 µm to 10 µm
Above 10 µm to 30 µm
Above 30 µm to
50 µm Above 50 µm Spherical Cylindrical Irregular
66% 24% 8% 2% 46% 22% 32%
Experimentation of Cooling Time in ST Process
The effect of cooling time in soft tooling process using particle reinforced mould material is experimentally investigated. In this experimental study, we have considered PU as mould material and Al particle is taken as filler material. We have compared the cooling time required using Al filled PU composite mould material with that of using only PU for producing a cubical shaped (size: 50 mm x 50 mm x 50 mm) wax component. The experimentation is carried out with the amounts of Al filler content in PU mould material as 23.8% of volume fraction.
Wax material
In the present study, Investment casting wax (A7-11) supplied by Blayson Olefines Ltd, UK, is used. The wax consists of natural wax, synthetic wax and natural resins. The melting point of wax is 55ºC-70ºC and the boiling point/flash point is greater than 200ºC. The melt wax possesses viscosity of 0.6 Pas at around 100ºC.
Preparation of mould and manufacturing of wax component
A cubical shaped RP component made using Stereo Lithography Apparatus (SLA) is used as a pattern for making the mould. The pattern is finished to a desired quality as required for the final wax component. The RP pattern is suspended by Teflon rod in an enclosed box (using thin sheet preferably made of Perspex material) and necessary arrangement is made to provide passage in the mould box for pouring the molten wax into the mould box. The weights of part-A and part-B of liquid PU and Al filler are calculated based on the respective densities of these components for a certain volume fraction of filler in the composite. Part A (liquid polymer) is first mixed with filler particles in a container. To assure a uniform mixing, stirring of liquid polymer and gradual pouring of filler particles is done simultaneously. Once the uniform mixing of liquid polymer and filler particles is achieved, the hardener (Part B) will be poured into the mixture of liquid polymer and filler, and stirred properly for some time to attain the particle reinforced mould material. Before pouring the mould material into mould box, release agent is sprayed thoroughly inside the mould box. In the box, the (liquid) mixture of Al particle reinforced PU is poured all around the pattern. After that, the box with composite mould material is placed inside the vacuum casting machine to eliminate any traces of entrapped air in the mould, later it is allowed to cure in room temperature. Gradually, it sets with time and becomes a solid rubbery mass with the pattern inside. Now the mould box is cut along a suitable parting line and the RP pattern is removed from within the mould box. Two thermocouple wires are placed on the upper part of the mould box for measuring the temperatures. Then, both the parts of mould box are assembled in the proper position with the help of adhesive tape (as shown in Fig. 2). Once the mould is prepared, liquid wax is poured into the mould and cooling/solidification of liquid wax is done in room temperature.
Figure 2. Mould box prepared with Al filled PU.
Experimental setup
Once the liquid wax solidifies, both the parts of mould box are disassembled by removing the adhesive tape and the wax component is taken out. After cleaning the mould box, it becomes ready for another casting. It was noticed that the surface of wax component solidifies faster than the core (inside) of the component. Depending on the size/shape of component, a certain depth of solidification from the surface may be sufficient so that the wax component can be taken out from the mould box without any damage. Many times, industrial people follow such technique for shortening the processing time to increase the productivity. Thus, in this experimental study, the measurements of temperature are taken at two distinct positions of the wax component, at the centre and at a depth of 5 mm from the surface of the component. Measurement of temperatures is taken through the thermocouple system (as shown in Fig. 2). The readings of temperatures are collected in an interval of 1 sec through data acquisition system.
Results and discussions
reinforced PU. Thus, it is revealed that the cooling time is reduced significantly in soft tooling process using particle-reinforcement with mould materials. This happens due to the increase of effective thermal conductivity of mould material. However, besides the thermal conductivity of mould material, the cooling time also depends on the temperature difference between the inside and outside of the mould box, and thickness of the mould wall.
Figure 3. Cooling rate of wax pattern using PU mould of (d=) 30 mm wall thickness at room temperature.
Figure 4. Cooling rate of wax pattern using Al particle reinforced PU mould of (d=) 30 mm wall thickness at room temperature.
The minimum thickness of mould box is decided based on the shape and size of the wax component to be manufactured. On the other hand, cooling/solidification of wax carried out in ambient temperature is the most desirable technique in industry due to no additional expenditure. Therefore, the only controllable parameter in ST process is the thermal conductivity of mould material which practitioners can improve in order to solidify the wax component with a minimum time.
However, it has been found that though the cooling time is significantly reduced by conductive filler reinforcement with mould material, the stiffness of mould is becoming high. This is happening due to the increase of modulus of elasticity of mould material as a result of particle reinforcement. High stiffness of mould is not desirable in soft tooling process because releasing pattern and wax component from the mould box becomes difficult. Moreover, the values of effective thermal conductivity and modulus of elasticity of a particle reinforced polymeric mould material depend on the type of filler material. By realizing it, in the following section, an extensive
experimentation is carried out to find the effect on equivalent thermal conductivity and modulus of elasticity of polyurethane composites due to reinforcement of filler particles, namely, aluminium and graphite with different loading conditions. The existing models of equivalent thermal conductivity and modulus of elasticity of composites are also tried to validate based on the experimental findings which will be helpful to decide the optimum amount of filler content to be reinforced with mould material.
Equivalent Thermal Properties of Particle-Reinforced PU Mould Materials
Experimental measurements: Procedures
Thermal properties of different composites are measured based on transient plane heat source (TPS) hot disk method (Gustafsson, 1991) following the standard ISO 22007-2: 2008(E). We have used the instrument TPS 2500 S Thermal Conductivity System associated with the software HotDisk Thermal Constant Analyser V.5.9.5 (solids, liquids, powders and paste). The TPS 2500 S Thermal Conductivity System utilizes a hot disk sensor in the shape of a double spiral of nickel wire. The hot disk sensor (design number: C5501) with 14 concentric rings is used here for measuring thermal properties. The sensor element is made of 10 µm thick nickel wire and the spiral is supported by 30 µm thick Kapton material to protect its particular shape by providing mechanical strength and also keeping it electrically insulated. The relaxation time of the probe is less than 10 ms, and the required time to reach a constant temperature difference is kept as 15 min. The sensor used in the experiments has a diameter of 2a (a is the radius of the largest ring, 6.403 mm) and total thickness (Kapton-nickel-Kapton) of 2v (=70 µm) and was placed between two samples of 50 mm square and thickness 5-6 mm. The probing depth of the sensor used for all the samples is around 6 mm. In hot disk method, measurements of thermal properties are made based on the average temperature increase in hot disk sensor. In the following, derivation of average temperature increase in hot disk sensor and the method of computing thermal properties are made.
The differential equation of heat conduction in an isotropic material whose thermal conductivity is independent of temperature is given by (Carslaw and Jaeger, 2000)
t T c Q T
∂ ∂ = +
∇ ρ
α 2 (1)
where α (=k/ρc) is the thermal diffusivity, k is the thermal conductivity, ρ and c are the density and specific heat of material, respectively. ρc is called volumetric specific heat of the material.
(
x y z t)
T , , , is the temperature at point (x, y, z) and time, t.
(
x y z t)
Q , , , (J/m3-s) is the amount of heat released at (x, y, z, t) per unit volume and unit time.
The fundamental solution of Eq. (1), assuming that heat source switched at time t = 0, is
( )
(
)
[
( )
( )
]
e ( ) dξdt tt t , ξ Q
k ρc T ,t r
T tt
ξ
r t
V
′
∫ ∫
′ −
′ ∏
+
=
′ −
− − ′
3 4
0 32
2 3 0
2
4 1
α r
(2)
In cylindrical coordinates, any position in the sample is
( )
r,θ,θArup Kumar Nandi and Shubhabrata Datta
(
) (
z z)
r r r r
r = + ′ − ′ − ′ + − ′
− 2 2 2
2
cos
2 θ θ
ξ .
For continuous single ring source with radius a in the z´= 0 plane, the heat source strength can be expressed as
(
r a) ( ) ( )
δ z utδ
Q
Q= 0 ′− ′ ′ (3)
in which δ
( )
is the Dirac delta function (where( ) (
) ( )
∫ − = + − α α p f p x δ xf ) and u
( )
t′ (where u( )
t′ = 0 for t′<0 and( )
tu ′ = 1 for t′≥0) is the Heaviside unit step function. Q0 is the
heat released per unit length of ring source.
A hot disk sensor is considered to have m number concentric rings of heat source that are equally spaced (Gustafsson, 1991). Assuming the source is continuous and it is switched on at t′=0, the strength of heat source can be defined as
( ) ( )
z ut m la r Q Q m i l ′ ′ ∑ − ′ ==δ δ
0 (4)
where a is the radius of the largest ring and that of the smallest ring is
m
a, and the total length (heating filament) ring (L) is ∑ ∏
= m n m na 1 2
(i.e.,
(
m+1)
∏a). Thus, the total heat released by the sensor in time tis obtained as
( )
∫ ∫ ′ ′ ′ = ′ V t dt V d t Q H 0 , ξ( )
( )
∫ ∑ ′ ′ ′∫ ′∫ ′∫ ′ ′ − ′ = + − ∏ = α α α θ δ δ 0 0 2 0 1 0 t m l t d t u z d d r d r z m la r Q(
m)
Qt a +1 0∏
= (5)
t P0
= (6)
where P0 is the power output of the hot disk sensor per unit time.
Now, the temperature increase caused by hot disk sensor can be obtained by carrying out the integration in Eq. (2) and with the help of Eq. (4):
( )
[ ( )]( )
r
d
r
e
m
la
r
ρ
c
Q
T
,t
r
T
t tr r r r m l
′
′
∑ ∫
−
′
=
−
−′ ′ − ′ − ′ + − = α ϑ θ αδ
4 cos 2 1 0 0 0 2 2r
( ) ( )( )
( )
(
)
[
]
∫ ∫ ′ − ∏ ′ × ′ × ′ ′ ∫ ×+ ∏ − ′ − ′ − − 20 0 32
4 4 2 2 t t t z z t t t u d z d z e α θ δ α α α ( )
( )
[
]
∫ ( ) ( ) ′ ∫ ′ − ∏ ′ ∑ = ∏ −′ ′ − = −′ + + − 2 0 cos 20 32
1 4 0 4 2 2 2 θ α
ρ α t t e α θθ d
t d e m la c Q t t m rla t m l t t z m la r ( )
( )
[
]
( )
′ − ∫ ′ − ∏ ′ ∑ ∏ = = −′ + + − t t m rla I t t t d e l cmaQ m t
l t t z m la r α α
ρ α 4 2
2
0
0 32
1 4 0 2 2 2 (7)
where I
( )
x ex θdθ ∫ ex θdθ∏ =
∫
∏
= ∏ 2∏
0 sin 2 0 cos 0 2 1 2 1
is the first kind
modified Bessel function of the 0th order.
In a hot disk measurement, as the temperature change near the surface of the sensor is concerned, z→0, and by considering the power output of the hot disk sensor per unit time (P0) instead of Q0,
Eq. (7) may be written as
( )
(
)
(
)
[
]
( )
( )( )
′ − ∑ ∫ ′ − ∏ ′ + = = −′ + − t t mα rla I e l t t α t d m ρcm P r,t∆T m
l αt t m la r t 2 4
1 1 4 0
2 2
0 32
0 (8)
Equation (8) may be rewritten by introducing some new parameters as follows
( )
(
)
( ) ( ) ∑ ∫ + ∏ = ∆ = + − σ σ σ αρ τ σ τ 2 0 1 4 0 2 2 3 0 2 1 2 , 2 2 2 ma rl I e l d c m am P r T m l m l a r (9)where σ is an integration variable defined as
( )
a t t 2 ′ − αand the
(dimensionless) parameter, τ (
a t
α
= ) is called the characteristic
time ratio.
Thus the temperature increase at any point on the sensor surface (i.e., z-plane) is described by the Eq. (9). But to determine the temperature increase of the sensor itself, it is required to determine the average temperature increase over the length of the concentric rings. Therefore, the average temperature increase of the sensor is defined as
( )
∫
∏( )
∑
= − ∆ = ∆ 2 0 1 ,1 τ δ θ
τ rd m na r r T L T m n (10)
By replacing the expressions of ∆T
( )
r,τ (from Eq. (9)) and L (as cited above) in Eq. (10), ∆T( )
τ may be expressed as( ) ( ) ( )
( ) ( )
∏ × + ∏ = ∆∫
∑ ∑
= = + − +∏ 2 2
1 1 2 2 0 1 1 4 0 2 1 2 2 2 2 2 3 0
σ
σ
σ τ σ τm
I
e
nl l m na d m a T m n m l k m am m l a r P( )
( ) ( )
× × =∫
∑ ∑
+
∏
= = + −σ
σ
σ τ σ 2 2 0 1 1 4 0 2 2 2 2 3 0 2 1 2 2 21
e
I
m
m
m
P
nl l n d ak m n m l m l a r( )τ
D ak
P
∏
= 2 30 (11)
where k is thermal conductivity of materials. D
( )
τ is a dimensionless time function.From Eq. (11), it can be seen that average temperature increase in hot disk sensor, ∆T
( )
τ is linearly proportional to the dimensionless time function,D( )
τ and exhibit straight-line curve by plotting their values. The slope of this straight-line curve is equal toak P
∏32 0
from which the value of k may be evaluated. But the
series of computational plots of ∆T
( )
τ versus D( )
τ for a range of αvalues. The correct value of α will be reached once the straight-line plot of ∆T
( )
τ versus D( )
τ is obtained. Once the correct value of αis obtained, the value of k can be determined from the slope of the straight-line plot of ∆T
( )
τ versus D( )
τ .Another way to determine the value of k is to measure the density (ρ) and the specific heat (c) of the material separately. Then, the value of k can be obtained by multiplying the value of k by the density and specific heat of the material. This method is generally applied for anisotropic materials. If the properties along x- and y- axes are the same, but different from those along the z-axis and if the plane of the hot disk sensor is mapped out by x- and y- axes, Eq. (11) will be expressed as
( )
D( )
τxk z k x a P
τx
T
∆
∏ =
2 3
0 (12)
where kx and kz are the thermal conductivities in the x (or y) and z
directions respectively and
a t
k
x x=τ
. The value of kx can bedetermined by the above stated iteration process until a straight-line plot of
( )
τ
x
T
∆ versus
( )
τ
x
D is reached and the value kx is
equivalent to αρc. On the other hand, from the slope of the straight-line plot of
τ
( )
x
T
∆ versus
( )
τ
x
D , the value of
k
k
z x
can
be found out. Therefore, the value of kz is calculated by dividing the
value of
k
k
z x
by obtained value of kx.
Composite sample preparation
The same procedure as described in “Preparation of mould and manufacturing of wax component” subsection is adopted here to prepare the composite samples for thermal property measurements. As per the standard, ISO 22007-2: 2008(E), the composite samples are made in the size of 50 mm square and thickness is kept as 5-6 mm.
Experimental results and discussions
The equivalent thermal conductivity (ETC), thermal diffusivities and volumetric heat capacity of particulate filled PU composites with Al and graphite particles for different amount of filling fractions as obtained through experimentations at room temperature (23°C) are illustrated in Fig. 5. From the experimental results, it is quite evident that thermal conductivities of particulate filled PU and SR are increasing (around 10 times) with increasing amount of filler and the increasing rate starts more drastically at around 20-30% volume fraction of filler for some composites. This is due to the formation of thermal conductive chain in composite whose tendency is high in elevated filler content. In Fig. 5, another point noticed is that increasing rate of thermal conductivity is comparatively higher for any level of filler content when graphite filler is used for both the mould materials. The reason is: large particles which are equivalent as the composed of aggregates of filler particles are more capable of forming conductive chains than fine particles. Moreover, the amount of heat scattered around the contact points in case of coarse particles is smaller than in fine particles, since less number of contact points are required to form the same length of conductive chain (Agari and Uno, 1985).
Arup Kumar Nandi and Shubhabrata Datta
Figure 6. Morphological structure of PU and aluminium composites with volume fraction levels: a) 39.922% and b) 48.664%.
On the other hand, it is worth mentioning that manufacturing process of composite is an important aspect to achieve a maximum value of ETC of flexible mould material composites. Because there is more possibility of the presence of voids in mould due to fault(s) in manufacturing, which will reduce effective thermal conductivity. This phenomenon is observed in the results of PU-Al composites (Fig. 5(a)). It is found that though the composite contains higher filler (48.66%), it exhibits lower ETC than that having lower (39.922%) filler due to presence of more voids (as seen in Fig. 6).
Validation of Existing Models Based on Experimental Results
The experimental results of ETC of the composites have been explained by several empirical/semi-empirical models, namely Maxwell-Eucken (Maxwell, 1954), Bruggeman (Bruggeman, 1935), Lewis-Nielsen (Lewis and Nielsen, 1970), Cheng-Vackon (Cheng and Vachon, 1969), Ziebland (Butta and Migliaresi, 1996), Torquato (Torquato, 1985) and Agari-Uno (Agari and Uno, 1986), as shown in Fig. 7. It is observed that Lewis-Nielsen model (which is defined by empirical expression as shown in Eq. (13)) provides closer estimations (average % error = 29.21) than other empirical models in all four composites.
k V B
V AB
k p
f f
c − ×
+ =
ϕ
1 1
(13)
where
A k k k k
B
p f p f
+ − =
1
and V
φ φ
f m
m
×
−
+ =1 1 2
ϕ ;
kc, kp, and kf represent the equivalent thermal conductivities of
composite, polymer, and filler, respectively, and Vf is the volumetric
fraction of filler in the composite. The constant A depends on the shape and orientation of disperse particles in the composite, and is defined by =
k
−1E
A (where kE is the Einstein coefficient). φm is
the maximum packing fraction of disperse phase (for randomly distributed spherical particles, φm = 0.637). The value of A is equal
to 1.5 for randomly distributed spherical particles, while in case of randomly distributed aggregates of spherical particles, A = 3.
Moreover, a better fit is observed with the semi-empirical model of Agari-Uno (expressed by Eq. (14)) whose controlling parameters are determined based on the experimental data. The average % errors of Agari-Uno model are found as 2.35 and 10.12 by individually fitting the composite systems of Al and PU-Graphite, respectively. However, it was found that the average % error of Agari-Uno model by fitting all the data of two composite systems is considerably high (16.95%), though still lower than Lewis-Nielsen model.
(
V) (
C k)
k C V
kc f 2ln f 1 f ln 1 p
ln = + − (14)
where C1, the factor of the effect on crystallinity and crystal size of
polymer, does not depend on particle size. C2 is the factor of ease in
forming conductive chains of particles, which is affected by filler particle size.
Figure 7. Thermal conductivities of composites (a) Al and (b) PU-Graphite: experimental values and various model predictions.
In looking at the Agari-Uno models, it was found that values of C1 (0.933594 and 1.0) are nearer/equal to 1.0 and the values C2 are
of crystallinity and crystal size of polymer on the changing thermal conductivity of polymer (matrix material) is negligible due to the inclusion of filler. Such kind of effect is observed in flexible mould material composites with both the graphite and Al particles. The value of C2 close to 1.0 indicates more ease in forming conductive
chains of filler particles in composite. In the present composites, it is observed that the value of C2 is greater for large particle size filler
(graphite) than the smaller one (Al) which agrees well with the results of Boudenne et al. (2004).
Equivalent Modulus of Elasticity of Particle-Reinforced PU Mould Materials
Experimental measurements: Procedures
Modulus of elasticity of a material may be tested using different standard test methods, namely tensile testing, four-point loading test (Gere, 1984), ultrasonic measurement (Moore, 2007), etc. The tensile testing method we have adopted here to find the equivalent Young's modulus of flexible mould material composites is based on the standard ASTM D 3039M-08. According to this standard, a constant rectangular cross-section shaped specimen of thickness, 2.5 mm ±4%, 25 mm ±1% of width and 270 mm of length in the form of sheet is prepared using the method as described in “Preparation of mould and manufacturing of wax component”. Tensile tests are performed on an Instron testing machine (made of DARTEC). The testing machine is equipped with a recording system (load sensor) for measuring the applied force within ±2% and is capable of measuring elongation of the test specimen in minimum increments of 10%. The machine has two grips, one of which is connected to the load sensor. The grips (constant pneumatic and wedged type) are tighten automatically and exert a uniform pressure (of maximum 10 bar) across the gripping surfaces which is increasing as the tension increases in order to prevent slippage and to favour failure of the specimen in the straight middle section. At the end of each grip, a positioning device is placed in order to insert specimen to the same depth in the grip and to make the specimen aligned with the direction of pull. An extensometer (Made of MTS, Model No. 634.25F-24, Serial No. 10288577A) is used to measure the strain of test specimen. The extensometer was calibrated by M/s MTS. The extensometer was attached to the specimen at two points of 50 mm apart (extensometer gauge length) symmetrically about the mid-span and mid-width location. During experimentation, a value of constant head-speed of 5 mm/min is applied and the force applied to the specimen until a maximum value of elongation, 15% or failure of the specimen whichever is occurred earlier. The values of displacement, force and strain are recorded through data acquisition system at a constant interval of 0.01 sec. After plotting the data of stress vs. strain, a linear curve is found which indicates the elastic region of the stress-strain diagram of the material. The slope of this linear curve is evaluated, which represents the tensile modulus of elasticity of composite moulds.
Experimental results and discussions
From the experimental results as illustrated in Fig. 8, increase of modulus of elasticity is observed in all kinds of flexible mould materials reinforced with conductive filler particles. In PU composite system, increase of modulus of elasticity is more-or-less similar in nature for both the reinforcements, Al and Graphite, especially when the filler concentration label is below 40%. But a sudden rise of modulus of elasticity is observed with Al filler at above 40% volume fraction, unlikely to that filled with graphite particles. This may be due to the fact that Al particles are securely embedded with polymer matrix since the size of particles is
comparatively smaller than graphite particles. This phenomenon is specifically observed when the filler content is more than 40%. Whereas, adhesion between PU and graphite particles is not as critical as compared to polymer matrix and metallic filler composite systems. The effective modulus of elasticity of particle filled flexible (polymeric) mould material composite also depends on the modulus of elasticity of the polymer, modulus of elasticity of filler material, and the volume/weight fraction of filler particle in the composite.
Figure 8. Equivalent modulus of elasticity of PU composites with aluminium and graphite particles.
Validation of existing models based on experimental results
The experimental results of equivalent modulus of elasticity of the particulate filled polyurethane and silicone rubber composites, as illustrated in Fig. 8, are explained using various existing empirical models available in the literature. The most commonly used models for predicting equivalent modulus of elasticity of a composite material in a straightforward way, from its numerical expressions are the following:
Model proposed by Paul (Paul, 1960):
(
)
(
E Em)
V(
V)
EV E E E E E
f f f
m
f m f m m c
3 1 3 2
3 2 2 2
1−
− +
− +
= (15)
where Em, Ef and Ec are the modulus of elasticity of the matrix,
particle and composite, respectively.
Model proposed by Ravichandran (Ravichandran, 1994):
(
)
( )
(
CE E)
( )
C E E E C E E E C Em f
m f m m
f m L c
+ +
+ − + + =
1 1
2 2 2 2
Arup Kumar Nandi and Shubhabrata Datta
( )
[
]
(
)
(
E E)
C E( )
C C E C E E E E m f m m m m f U c + + − + − + + = 1 1 1 3 2 2 2 (17)where 1 13 1
− = V C f
Model proposed by Wu (Wu, 1965):
E V V E V V E λ E E E E f f m m f m m f m m C + + − − = 1 1 1 1 1 2 (18)
where Vm (= 1-Vf) is volume fraction of matrix material. λ is the
parameter, which remains fixed for any relative concentration of a given composite material. Through experimental study, it has been
found that the value of λ is quite close to unity for <<1 E E
f m
.
Besides the above models, there are many empirical expressions proposed by various researchers, namely Hashin-Shtrikman bounds (Hashin and Shtrikman, 1963), Halpin-Tsai models (Halpin, 1969; Halpin and Kardos, 1976), Walpole bounds (Walpole, 1966a; Walpole, 1966b), methods based on mean-filed (such as Voigt model (Voigt, 1889), Reuss model (Reuss, 1929), Mori-Tanaka´s models (Benveniste, 1987), etc.), self-consistent method based models (Kroner, 1958), models based on differential method (McLaughlin, 1977), Lielens models (Lielens et al., 1998) from which the equivalent modulus of elasticity (or its upper bound (UB) & lower bound (LB)) of a particulate filled composite can be determined based on the conventional expressions (Eq. (19)) of isotropic material properties by assuming the composite to be (quasi) isotropic and (quasi) homogeneous.
G K KG E + = 3 9 (19)
where E, G and K are the modulus of elasticity, shear modulus and bulk modulus, respectively.
If the Lielens model is formulated based on a normalization of the upper and lower bounds suggested by Hashim-Shtrikman, it can be written as
K f K f K U S H L S H c − − + − = 1 1 (20) G f G f G U S H L S H c − − + − = 1 1 (21) where 2 2 V V
f = f+ f , and KL S
H− , K
U S
H− , G
L S H− and G
U S H− are the
Hashin-Shtrikman lower and upper bounds of bulk modulus and shear modulus, respectively, which are expressed by the following empirical expressions: G K V K K V K K m m m m f f m L S H 4 3 3 1 + + − + =
− (22)
G K V K K V K K m f f f m m f U S H 4 3 3 1 + + − + =
− (23)
(
)
(
K G)
G V G K G G V G G m m m m m m m f f m L S H 4 3 5 2 6 1 + + + − + =
− (24)
(
)
(
K G)
G V G K G G V G G f f f f f f f m m f U S H 4 3 5 2 6 1 + + + − + =
− (25)
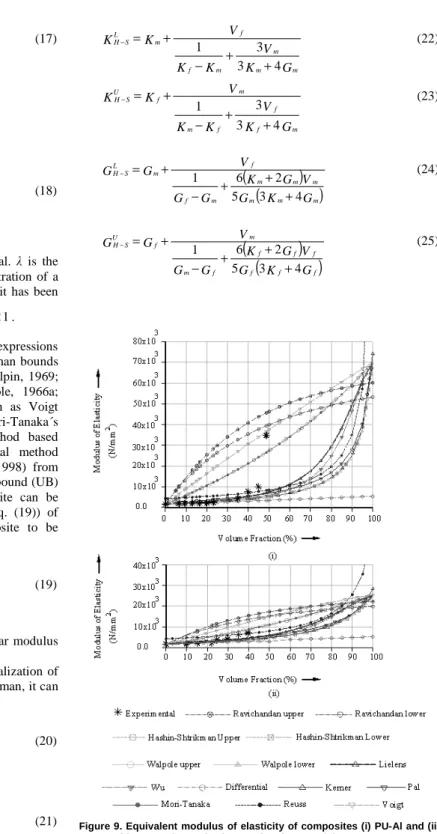
Figure 9. Equivalent modulus of elasticity of composites (i) PU-Al and (ii) PU-Graphite: experimental values and various models.
9(ii), it has been observed that most of the experimental data of all the suspension systems lie in the region enclosed by the Hashim-Shtrikman upper and lower bounds. The model seems to be efficient enough to predict the modulus of elasticity of the PU composites with varying matrix as well as reinforcement particles.
Conclusions
In the present work, an experimental study is carried out to find the equivalent thermal properties and effective modulus of elasticity of particle reinforced PU mould material using hot disk technique and tensile testing method, respectively. The measurements of thermal properties using hot disk technique and modulus of elasticity using tensile testing method are presented. A significant increase of thermal conductivity as well as modulus of elasticity of PU composite mould material (reinforced with Al and graphite particulate fillers) is observed. As a result, it has been found that the cooling time in soft tooling process is much reduced, but simultaneously increase of stiffness of mould box is observed. Therefore, determination of an optimum amount of filler content with mould material is important. Presence of voids in the composite due to manufacturing fault(s) reduces the effective thermal conductivity considerably. By comparing the experimental results of equivalent thermal conductivity of PU composites with the existing models, it is observed that data driven model by Agari-Uno and numerical model by Lewis-Nielsen provide better estimations than other models. On the other hand, model proposed by Lielens shows better trade-off with experimental findings of equivalent modulus of elasticity of particle reinforced PU compared to other models.
Acknowledgements
The authors are thankful to DST (Department of Science and Technology), New Delhi, India, for supporting this research work under the BOYSCAST fellowship programme.
References
Agari, Y. and Uno, T., 1985, “Thermal conductivity of polymer filled with carbon materials: Effect of conductive particle chains on thermal conductivity”, Journal of Applied Polymer Science, Vol. 30, pp. 2225-2235.
Agari, Y. and Uno, T., 1986, “Estimation on thermal conductivities of filled polymers”, Journal of Applied Polymer Science, Vol. 32, No. 7, pp. 5705-5712.
Agrawal, R., Saxena, N.S., Mathew, G., Thomas, S., Sharma, K.B., 2000, “Effective thermal conductivity of three-phase styrene butadiene composites”, Journal of Applied Polymer Science, Vol. 76, pp. 1799-1803.
Benveniste, Y., 1987, “A new approach to the application of Mori-tanaka´s theory in composite materials”, Mechanics of Materials, Vol. 6, No. 2, pp. 147-157.
Boudenne, A., Ibos, L., Fois, M., Gehin, E. and Majeste, J.C., 2004, “Thermophysical properties of polypropylene/aluminium composites”, Journal
of Polymer Science Part B: Polymer physics, Vol. 42, No. 4, pp. 722-732.
Bruggeman, D.A.G., 1935, “Berechnung Verschiedener physikalischer konstanten von heterogenen substanzen”, Annals Physics (Leipzig), Vol. 24, No. 5, pp. 636-679.
Butta, E. and Migliaresi, C., 1996, “Materiali compositi a matrice polimerica”, AIMAT Manuale dei Materiali per l´Ingegneria, Mc. Graw Hill, ISBN-883863211-1.
Carslaw, H.S. and Jaeger, J.C., 2000, “Conduction of heats in solids”, 2nd ed., Oxford Science Publications, New York.
Cheng, S.C. and Vachon, R.I., 1969, “The prediction of the thermal conductivity of two and three phase solid heterogeneous mixture”,
International Journal of Heat Mass Transfer, Vol. 12, No. 3, pp. 249-264.
Gere, T.M., 1984, “Timoshenko SP. Mechanics of Materials”, Brooks Cole, Monterey, CA.
Gustafsson, S.E., 1991, “Transient plane source techniques for thermal conductivity and thermal diffusivity measures of solid materials”, Review of
Scientific Instruments, Vol. 62, No. 3, pp. 797-804.
Halpin, J.C., 1969, “Stiffness and expansion estimates for oriented short fiber composites”, Journal of Composite Materials, Vol. 3, pp. 732-734.
Halpin, J.C. and Kardos, J.L., 1976, “The Halpin-Tsai equations: A review”, Polymer Engineering and Science, Vol. 16, No. 5, pp. 344-352.
Hashin, Z. and Shtrikman, S., 1963, “A variational approach to the theory of the elastic behaviour of multiphase materials”, Journal of
Mechanics and Physics of Solids, Vol. 11, pp. 127-140.
Kim, S.W., Choi, B., Lee, S.H. and Kang, K.H., 2008, “Measurement of thermophysical properties of particulate-filled polymer composites”, High
Temperatures-High Pressures, Vol. 37, No. 1, pp. 21-30.
Kroner, E., 1958, “Berechnung der elastischen Konstanten des Vielkristalls aus den Konstanten des Einkristalls”, Zeitschrift für Physik, Vol. 151, pp. 504-518.
Lee, G.W., Park, M., Kim, J., Lee, J.I. and Yoon, H.G., 2006, “Enhanced thermal conductivity of polymer composites filled with hybrid filler”, Composites Part A: Applied Science and Manufacturing, Vol. 37, No. 5, pp. 727-734.
Lewis, T. and Nielsen, L.E., 1970, “Dynamic mechanical properties of particulate-filled composites”, Journal of Applied Polymer Science, Vol. 14, pp. 1449-1471.
Lielens, G., Pirotte, P., Couniot, A., Dupret, F. and Keunings, R., 1998, “Prediction of thermo-mechanical properties for compression moulded composites”, Composites Part A: Applied Science and
Manufacturing, Vol. 29, No. 1-2, pp. 63-70.
Maxwell, J.C., 1954, “A Treatise on Electricity and Magnetism”, 3rd edition, Chapter 9, Dover Inc., New York, NY.
McLaughlin, R., 1977, “A study of the differential scheme for composite materials”, International Journal of Engineering Science, Vol. 15, No. 4, pp. 237-244.
Miller, M.G., Keith, J.M., King, J.A., Edwards, B.J., Klinkenberg, N. and Schiraldi, D.A., 2006, “Measuring thermal conductivities of anisotropic synthetic graphite-liquid crystal polymer composites”, Polymer Composites, Vol. 27, No. 4, pp. 388-394.
Moore, P., 2007, “Nondestructive Testing Handbook”, American Society for Nondestructive Testing, Vol. 7, pp. 319-321.
Mu, Q., Feng, S. and Diao, G., 2007, “Thermal conductivity of silicone rubber filled with ZnO”, Polymer Composites, Vol. 28, No. 2, pp. 125-130.
Pal, R., 2007, “New models for thermal conductivity of particulate composites”, Journal of Reinforced Plastics and Composites, Vol. 26, No. 7, pp. 643-651.
Papanicolaou, G.C. and Bakos, D., 1992, “The influence of the adhesion bond between matrix and filler on the tensile strength of particulate-filled polymers”, Journal of Reinforced Plastics and Composites, Vol. 11, No. 2, pp. 104-126.
Paul, B., 1960, “Prediction of elastic constants of multiphase materials”,
Transactions of the Metallurgical Society of AIME, Vol. 218, pp. 36-41.
Ravichandran, K.S., 1994, “Elastic properties of two phase composites”,
Journal of the American Ceramic Society, Vol. 77, No. 5, pp. 1178-1184.
Reuss, A., 1929, “Berechnung der Fliebgrenze von Mischkristallen auf grund der Plastizitatsbedingung fur Einkristalle”, Journal of Applied
Mathematics and Mechanics, Vol. 9, No. 1, pp. 49-58.
Rosochowski, A., Matuszak, A., 2000, “Rapid tooling: the state of the art”,
Journal of Materials Processing Technology, Vol. 106, No. 1-3, pp. 191-198.
Rusu, M., Sofian, N. and Rusu, D., 2001, “Mechanical and thermal properties of zinc powder filled high density polyethylene composites”,
Polymer Testing, Vol. 20, No. 4, pp. 409-417.
Subodh, G., Manjusha, M.V., Philip, J. and Sebastian, M.T., 2008, “Thermal properties of polytetrafluoroethylene/Sr2Ce2Ti5O16 polymer/ ceramic composites”, Journal of Applied Polymer Science, Vol. 108, No. 3, pp. 1716-1721.
Sundstrom, D.W. and Chen, S.Y., 1970, “Thermal Conductivity of Reinforced Plastics”, Journal of Composite Materials, Vol. 4, No. 1, pp. 113-117. Tavman, I.H., 1997, “Thermal and mechanical properties of copper powder filled poly(ethylene) composites”, Powder Technology, Vol. 91, pp. 63-67.
Torquato, S., 1985, “Effective electrical conductivity of two-phase disordered composite media”, Journal of Applied Physics, Vol. 58, No. 10, pp. 3790-3797.
Vinod, V.S., Varghese, S. and Kuriakose, B., 2004, “Aluminium powder filled nitrile rubber composites”, Journal of Applied Polymer
Arup Kumar Nandi and Shubhabrata Datta
Voigt, W., 1889, “Uber die Beziehung zwischen den beiden Elasticitats-constanten isotroper korper”, Annals of Physics, Vol. 38, pp. 573-587.
Walpole, L.J., 1966a, “On bounds for the overall elastic moduli of inhomogeneous system –I”, Journal of the Mechanics and Physics of Solids, Vol. 14, No. 3, pp. 151-162.
Walpole, L.J., 1966b, “On bounds for the overall elastic moduli of inhomogeneous system–II”, Journal of the Mechanics and Physics of Solids, Vol. 14, No. 5, pp. 289-301.
Wu, T.T., 1965, “On the parametrization of the elastic moduli of two-phase materials”, Journal of Applied Mechanics, Vol. 32, pp. 211-214.
Ye, C.M., Shentu, B.Q. and Weng, Z.X., 2006, “Thermal conductivity of high density polyethylene filled with graphite”, Journal of Applied
Polymer Science, Vol. 101, No. 6, pp. 3806-3810.
Yung, K.C. and Liem, H., 2007, “Enhanced thermal conductivity of boron nitride epoxy-matrix composite through multi-modal particle size mixing”,