LOW-LEVEL TIE FEATURE EXTRACTION OF MOBILE MAPPING DATA
(MLS/IMAGES) AND AERIAL IMAGERY
P. Jende, Z. Hussnain, M. Peter, S. Oude Elberink, M. Gerke, G. Vosselman
University of Twente, Faculty of Geo-Information Science and Earth Observation (ITC), Department of Earth Observation Science, The Netherlands
{p.l.h.jende,s.z.hussnain,m.s.peter,s.j.oudeelberink,m.gerke,george.vosselman}@utwente.nl
KEY WORDS: Mobile Mapping, Feature Extraction, Feature Matching, Image Orientation
ABSTRACT:
Mobile Mapping (MM) is a technique to obtain geo-information using sensors mounted on a mobile platform or vehicle. The mobile platform’s position is provided by the integration of Global Navigation Satellite Systems (GNSS) and Inertial Navigation Systems (INS). However, especially in urban areas, building structures can obstruct a direct line-of-sight between the GNSS receiver and navigation satellites resulting in an erroneous position estimation. Therefore, derived MM data products, such as laser point clouds or images, lack the expected positioning reliability and accuracy. This issue has been addressed by many researchers, whose aim to mitigate these effects mainly concentrates on utilising tertiary reference data. However, current approaches do not consider errors in height, cannot achieve sub-decimetre accuracy and are often not designed to work in a fully automatic fashion. We propose an automatic pipeline to rectify MM data products by employing high resolution aerial nadir and oblique imagery as horizontal and vertical reference, respectively. By exploiting the MM platform’s defective, and therefore imprecise but approximate orientation parameters, accurate feature matching techniques can be realised as a pre-processing step to minimise the MM platform’s three -dimensional positioning error. Subsequently, identified correspondences serve as constraints for an orientation update, which is conducted by an estimation or adjustment technique. Since not all MM systems employ laser scanners and imaging sensors simultaneously, and each system and data demands different approaches, two independent workflows are developed in parallel. Still under development, both workflows will be presented and preliminary results will be shown. The workflows comprise of three steps; feature extraction, feature matching and the orientation update. In this paper, initial results of low-level image and point cloud feature extraction methods will be discussed as well as an outline of the project and its framework will be given.
1. INTRODUCTION
Mobile Mapping is on the verge of becoming a substantial addition to the family of geo-data acquisition techniques. Airborne or satellite data cover large areas, but have limited capabilities when it comes to the density of data postings and high accuracy, whereas classical terrestrial techniques are expensive and often impractical. Particularly in urban areas, MM shapes up to be an extraordinarily useful technique not just to complement airborne or satellite coverage, but to enable a completely new array of possibilities. MM imaging systems and laser scanners collect high-resolution data, but have to rely on external georeferencing by GNSS. As GNSS being intermittently available, INS provides relative measures between position fixes and compensates for measurement noise and errors. Although GNSS carrier-phase measurements allow highly accurate positioning, urban areas remain problematic regarding the measurement reliability due to multipath effects and occlusions. When these phenomena persist over longer periods, accurate positioning cannot be maintained, and consequently data accuracy will be diminished (Godha, Petovello et al. 2005). This paper presents a method to detect and extract low-level image and point cloud features as a prerequisite for the rectification of MM data using aerial imagery. First, a brief outline of the project will be given. In section 2, a literature overview on similar work will be presented, and applied feature detection and extraction methods will be shortly introduced, followed by section 4 addressing low-level feature extraction for images as well as for point clouds. Section 5 discusses initial results of low-level feature extraction methods of both aerial and MM images as well as point cloud data. Lastly, section 6 concludes the work presented
in this paper as well as gives an outlook on future developments.
2. PROJECT OVERVIEW
The aim of our research project is to enable a reliable localisation pipeline for MM data obtained in urban areas, and to verify existing data sets according to their localisation accuracy in order to economise the acquisition of ground control. Due to apparent differences in the sensor setup and data, two workflows for Mobile Laser Scanning (MLS) and Mobile Mapping Imaging (MMI) are being developed. The common basis is the utilisation of high-resolution aerial nadir and oblique imagery as an external reference to compensate for vertical as well as for horizontal errors. In a first stage, common features between the ground data and aerial nadir imagery are sought. Based on the imprecise, but approximate exterior orientation of the MM data, more reliable and efficient matching techniques can be employed. For instance, a confined search for correspondences and their verification in the other image can be inferred even from coarse orientation parameters. The next stage will be the integration of oblique images into the pipeline to yield common features on the vertical axis in order to better detect errors in height, and to increase the overall number of tie features considerably. Façades and other vertical objects, such as street lights and traffic signs, are potential objects which can be used for that purpose in the future. In a last step, this tie information allows for either a re-computation of the trajectory or, alternatively, an adjustment of the data as such.
3. RELATED WORK
3.1 Previous Approaches
Coping with poor localisation of mobile platforms in urban areas has been addressed by many authors. Mostly by employing tertiary data as an external reference, either the data itself (Tournaire, Soheilian et al. (2006); Jaud, Rouveure et al. (2013); Ji, Shi et al. (2015)) or the platform’s trajectory (Kümmerle, Steder et al. (2011); Levinson and Thrun (2007); Leung, Clark et al. (2008)) has been corrected. Depending on the data input and type (e.g. aerial imagery, digital maps or ground control points), different registration methods were utilised to impose unaffected, reliable and precise orientation information from external data on MM data sets. Subsequently, yielded correspondences were used as a constraint within a filter or adjustment solution. Even though many authors achieved a successful localisation based on an external reference, errors in height were not corrected, and a consistent sub-decimetre accuracy could not be reached.
3.2 Low-Level Feature Extraction
Both, low- and high-level feature extraction methods, are relevant for this research project. Whereas low-level features allow a great flexibility towards the selection of suitable correspondences, the registration of data originating from different sensors (i.e. Mobile Laser Scanning and aerial imagery) may demand an extension of that concept. Although MLS intensity information enables the derivation of corner features, an abstract representation by identifying common objects in both data sets can facilitate determining thorough and reliable transformation parameters. Hence, high-level feature extraction methods will be highlighted in the future. In this paper, however, emphasis will be placed on low-level feature extraction which is still an active field of research as real-time applications have been gaining more attention in the last few years. Classic feature detection algorithms, such as the Förstner-Operator (Förstner and Gülch 1987) or the Harris Corner Detector (Harris and Stephens 1988) are accompanied by state-of-the-art approaches like AKAZE (Alcanterilla, Nuevo et al. 2013) or FAST (Rosten and Drummond 2006). Although many improvements have been made in this field, the most important property of a feature detector remains to identify the same keypoints over a set of images.
Once features have been detected in the image, they have to be described unambiguously to increase their distinctiveness among other features in order to match them correctly. Low-level feature description approaches can be divided into two categories – binary and float description. Whereas float descriptors, such as SIFT (Lowe 2004), are based on a Histogram of Oriented Gradients (HoG), binary descriptors (e.g. BRIEF (Calonder, Lepetit et al. 2010)) are analysing the neighbourhood of a feature keypoint with a binary comparison of intensities according to a specific sampling pattern. Float descriptors are typically more expensive to compute, and need more memory to store their output than binary descriptors. However, depending on the application, robustness of these two categories varies (Heinly, Dunn et al. (2012); Miksik and Mikolajczyk (2012)).
In this paper, different feature detection as well as float and binary description methods will be compared taking the example of aerial nadir, MM panoramic imagery and intensity images derived from MLS data. Feature keypoints across the data sets will be computed with SIFT (Lowe 2004), KAZE (Alcantarilla, Bartoli et al. 2012), AKAZE (Alcanterilla, Nuevo
et al. 2013) and the Förstner Operator (Förstner and Gülch 1987).
SIFT detects blobs with a Difference-of-Gaussian method at different scaled instances of the image. KAZE computes a non-linear scale space using an additive operator splitting technique, where keypoints are detected at locations with a maximum response of the determinant of the Hessian matrix. Similarly, AKAZE also relies on keypoint detection based on the Hessian matrix, but computes a non-linear scale space with fast explicit diffusion. Förstner detects corners based on the search for local minima of eigenvalues of a covariance matrix of image gradients. Except for Förstner, all aforementioned procedures allow for an additional feature description. SIFT utilises a HoG in a local neighbourhood to describe a keypoint. KAZE’s keypoints are described with the SURF descriptor (Bay, Ess et al. 2008) modified to be compatible with the detector’s non -linear scale space. AKAZE uses a binary description based on an adapted version of Local Difference Binary (Yang and Cheng 2012) where sample patches around the keypoint are averaged and then compared in a binary manner. For Förstner keypoints, LATCH (Levi and Hassner 2015) has been used for a binary feature description. LATCH compares sample-triplets around a keypoint, where the sampling arrangement is learnt. Respective results will be discussed in section 5.
4. LOW-LEVEL FEATURE EXTRACTION
4.1 MMI & Aerial Nadir Images
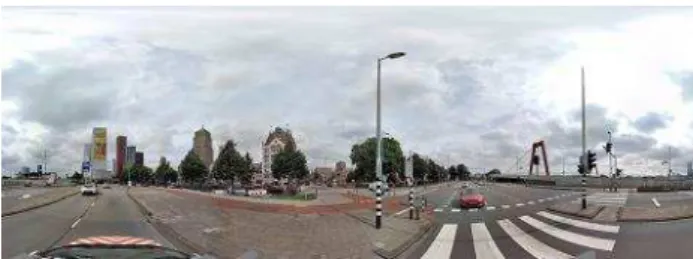
Aerial nadir ortho-images with a ground sampling distance of approximately 12 centimetres serve as the reference data set in this project. The MM images are 360*180 degrees panoramic images (Figure 1) acquired every 5 metres along the platform’s trajectory. For more details and specifications, please see (Beers 2011).
Figure 1 Mobile mapping panoramic image in equirectangular projection
In order to successfully use the aerial images’ exterior orientation for the rectification of MM data, respective tie information has to be reliable and accurate. Although ground and aerial nadir data have a different perspective on the scene, low-level feature correspondences can be identified in all data sets. For example, corners of road markings, centres of manholes and building corners resemble each other across all sensors.
4.1.1 Pre-processing
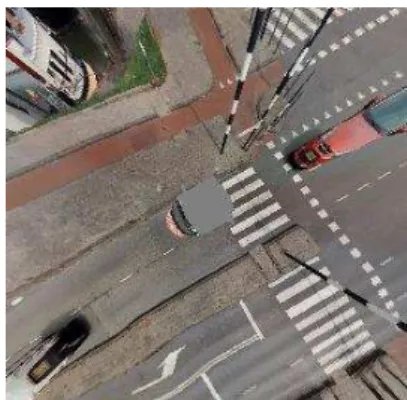
In order to simplify and optimise feature matching, the panoramic images are projected onto an artificial ground plane to increase the resemblance to the aerial images. The ground plane is computed based on the location of the MM imaging sensor and the fixed height of the sensor above ground. Especially in areas where the actual ground is not exactly flat, this approximation can lead to certain distortions (see Figure 2). In the future, the rather reliable relative orientation between two
recording locations will be used to compute a more accurate plane. Since this paper focuses solely on feature detection and description, and the aerial images used are ortho-projected, this fact can be neglected for now.
MM panoramic images are stored in an equirectangular projection, encoding directly spherical coordinates for every image pixel. Therefore, no projection matrix or other intrinsic parameters are needed to reproject the panoramic image. The quadratic ground plane is centred at the dropped perpendicular foot of the respective recording location. Analogue to the aerial imagery’s resolution of 12 centimetres, the ground plane is rasterised holding a world coordinate for every cell. Subsequently, each raster cell’s coordinate is back-projected into the panoramic image in order to extract the respective RGB value, and transfer the information back onto the ground plane. Since every back-projected ray will pierce the image plane of the panoramic image, and thus every raster cell will contain an RGB value, an interpolation of the resulting projected image seems dispensable. However, the geometric representation of the pixels of both grids varies, leading to multiple assignments of the same RGB value especially at the edge of the projected image appearing as blur. Hence, a bilinear interpolation of the extracted value according to the pixel neighbourhood of the panoramic image is conducted. Consequently, every pixel in the projected image is composed of an individual set of grey values.
Figure 2 Panoramic projected onto an artificial ground plane
4.1.2 Feature Extraction
The only overlapping area for feature detection induced by different original perspectives between aerial ortho-images and MM images is the road surface and its immediate vicinity. Therefore, road markings, such as zebra crossings or centre lines are being targeted on for feature detection. Resulting from atmospheric conditions and motion blur (esp. cameras without forward motion compensation), the image quality of the aerial photographs can be affected. To compensate for these effects, the projected panoramic images might need to be blurred even though sharing the same resolution with the aerial image.In the process of projecting the panoramic images onto the ground, not just the projection but also the approximate scale and rotation of the aerial image have been retrieved simultaneously. In particular, this circumstance simplifies the matching process considerably, but also renders to be useful for the step of feature description as less invariances and therefore fewer ambiguities have to be considered by the descriptor; i.e. the descriptor does not have to account for scale and rotational invariance since the panoramic image is north oriented and has got the same resolution.
On the other hand, the images have not been acquired at the same time and with different sensor systems. Consequently, this fact is resulting in another category of a description problem.
For instance, changes in illumination and contrast may affect the computation of the descriptor.
Moreover, repetitive patterns of road markings (e.g. zebra crossings) cannot be ignored as they may result in false feature matches. Either this issue has to be tackled on the descriptor level or during the matching stage. Introducing rules, such as ordering constraints (Egels and Kasser (2001), p. 198) or perceptual grouping (Lowe (1985), p. 4), to describe a chain or group of adjacent features may prevent misassignment. Additionally, approximate camera parameters can be exploited within the matching procedure. By back-projecting identified keypoints into the other image, a window can be defined to constrain the search for correspondences. These methods are currently under development or labelled future work. Aforementioned feature detection and description procedures will be applied to our data sets and results will be discussed in section 5.
4.2 Mobile Laser Scanning
The Mobile laser scanning point cloud (MLSPC) is acquired from one or more lidar sensors mounted on a moving car. The car’s trajectory is estimated by GNSS and IMU, where a GNSS based position is retrieved after one second intervals. The IMU is used to interpolate all intermediate positions. A particular mobile mapping car moving at a speed of 36 km/h covers an area of 10m in 1 second. During this 1 second interval, the IMU provides relatively accurate positions which favours to crop MLCPC patch-wise, where the size of each patch is 10 by 10 m. State of the art laser scanning systems claim to achieve a relative accuracy of 10 mm, when a control point is provided within 100 m of scanning. Thus, even if the scanning is conducted at a slower acquisition speed, the 10 by 10 m patch would not be affected by (IMU-based) distortions to an extent that would hamper feature extraction. Moreover, the point cloud which has been used in this project, already has an absolute accuracy in sub-metre range for roughly 25 km of scanning, which means that the relative accuracy of the point cloud is still within a 10 mm range.
Thereafter, each cropped point cloud patch is converted to an ortho-image by assigning a barycentric interpolation of laser intensities to its corresponding image pixel. A particular point cloud patch and the generated ortho-image is shown in Figure 3. The proposed method detects low-level features from ortho-image gradients using SIFT, KAZE, AKAZE and Förstner feature detectors. The feature point description is obtained from SIFT, KAZE, AKAZE and LATCH feature descriptors.
Figure 3 Point cloud patch (left) to an orthoimage (right).
5. RESULTS
In this section, feature detection and description methods will be compared according to their potential for deriving significant tie features and correspondences between aerial nadir and mobile mapping panoramic images as well as between aerial
nadir and MLS intensity images. First, a comparison between SIFT1, KAZE, AKAZE and Förstner2 on each of the three data sets will be conducted. Subsequently, acquired keypoints will be described with their corresponding method except for Förstner where a LATCH description will be used. Although still under development, feature matching will be utilised to compare the quality of each descriptor. To this end, simple descriptor matching to yield correspondences and a homography estimation to detect outliers will be used. As the focus of this project is on urban areas, four subsets with each 15 m side length of a typical road scene between two intersections have been selected for this experiment (Figure 4).
Figure 4 Four subsets of a typical urban scene (coloured tiles from scene 1 on the left to scene 4 on the right)
5.1 Feature detection
In urban areas, road markings and other prominent objects, such as kerbstones or manholes, identifiable among all data sets are favoured for feature detection. However, due to noise and different original perspectives, it is considered to be a challenging task for the step of feature detection to maintain a comparable detection rate over the entire data set.
Depending on the scene, this detection rate varies. The number of road markings and the detector itself, highly influence the results. For instance, due to its scale invariance SIFT detects keypoints on different blurred instances of the same image, and thus yields a lot more potential features than a corner detector, such as Förstner. As it will be shown in section 5.2, a potent feature detection alone is not sufficient for a successful registration.
Aerial Image
Panoramic Image
MLS Intensity
Total
SIFT 234 379 810 1423
KAZE 119 304 458 881
AKAZE 29 68 175 272
Förstner 40 75 153 268
Table 1 Number of combined keypoints over all subsets per detection method
5.1.1 SIFT
SIFT yields more keypoints than any other method used in this paper (Table 1). It detects 60% keypoints more than KAZE and even 5 times more keypoints than AKAZE or Förstner. Being very sensitive to image noise and detecting keypoints on different image scales, the detected features are not always
1 For SIFT, KAZE, AKAZE and LATCH, their respective
OpenCV implementation has been used
2 Implementation of the Förstner-Operator by Marc Luxen,
University of Bonn
useful. In particular, this comes into effect for both types of MM images as they have a higher original resolution and therefore a higher entropy (Figure 5).
Figure 5 SIFT keypoints detected in aerial image (left), panoramic image (centre) and MLS intensity image (right)
5.1.2 KAZE
KAZE detects fewer keypoints than SIFT, but still considerably more than AKAZE or Förstner. However, road markings are very well preserved, and especially their corner features, which are the most important image entity in our case, were mostly detected (Figure 6).
Figure 6 KAZE keypoints detected in aerial image (left), panoramic image (centre) and MLS intensity image (right)
5.1.3 AKAZE
Although, AKAZE and KAZE are quite similar in the way how a feature is detected (determinant of Hessian), their main difference lies in the computation of image pyramids to detect keypoints at different image scales. AKAZE detects fewer keypoints than KAZE, but these keypoints are most often important corners of road markings (Figure 7). Nonetheless, in two of four aerial images, AKAZE only detected one single keypoint which turns out to be too few for matching purposes.
Figure 7 AKAZE keypoints detected in aerial image (left), panoramic image (centre) and MLS intensity image (right)
5.1.4 Förstner Operator
The Förstner Operator is the only feature detector without the consideration of scale. This, and the fact that Förstner detects features solely at corners and centres of small image objects, leads to a very deliberate keypoint detection. However, almost every detected feature can be regarded as significant for the registration process. Due to its capability of sub-pixel localisation of keypoints, the same object point can be represented slightly shifted among different image sources which shapes up as a challenge for feature description.
Figure 8 Förstner keypoints detected in aerial image (left), panoramic image (centre) and MLS intensity image (right)
5.2 Feature description
Identified keypoints need to be described unambiguously to enable feature matching between two images. In general, difficulties arise if there is a change in perspective, illumination, coverage, or scale between the images as well as ambiguities resulting from repetitive patterns. In order to obviate apparent difficulties for registering the images, the MM data has been projected onto the ground to increase the resemblance to aerial imagery. As a consequence, scale and perspective are more similar among the data sets, but differences in illumination and coverage cannot be mitigated easily. Thus, different description methods are evaluated with regard to their ability to cope not just with the aforementioned changes but also to their performance to bridge sensor-induced differences.
SIFT, KAZE, AKAZE and LATCH will be used for feature description. As mentioned earlier, LATCH will be used for keypoints detected with the Förstner-Operator. To measure the descriptor quality of each method, the images have to be matched. The number of matches, inliers classified by RANSAC as well as the actual number of correct correspondences will be compared among different descriptors. Two out of four scenes (scene 1 and scene 2) will be discussed in detail3. Moreover, for every test scene, four different settings have been tested. To this end, MM data has been blurred with a Gaussian filter to increase the resemblance to the aerial data set. Moreover, a resampling of all data sets has been conducted as it has been shown that increasing the sampling size can facilitate a feature’s distinctiveness considerably (Köthe 2003).
1st run No modification of source images 2nd run Gaussian blurring of source images 3rd run Resampling to 150% of original size
4th run Blurring and subsequent resampling of source images
5.2.1 Aerial images and panoramic images
5.2.1.1 Scene 1
The first scene comprises of a zebra crossing and dotted road markings aggravating correct matching due to possible descriptor ambiguity. If enough correct correspondences are found, RANSAC converges to a correct solution. In the first run, however, none of the methods was able to achieve a good result (see e.g. Figure 9). The derived keypoint descriptors were not distinct enough to be matched accordingly. By blurring the images with a Gaussian low-pass filter in the second iteration, results slightly improved for KAZE (see Table 2). Yet, by resampling the source images to 150% of their original size, results got significantly better especially for KAZE, but also a
3 More results are provided on
https://www.researchgate.net/profile/Phillipp_Jende
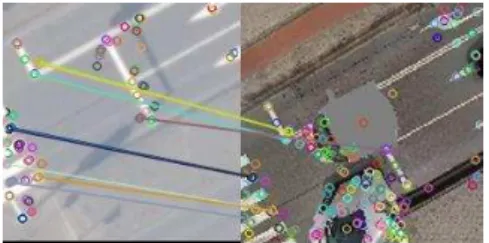
bit for SIFT and AKAZE (see Figure 10). In the fourth run, a Gaussian blurring followed by a resampling did not have an impact on the matching quality of this scene (see Table 3). Furthermore, LATCH yielded very poor results regardless of the iteration.
Figure 9 Matched LATCH keypoints in the first scene and first iteration
1st run 2nd run
M
at
ch
es
In
li
er
s
C
o
rr
ec
t
Ma
tc
h
es
M
at
ch
es
In
li
er
s
C
o
rr
ec
t
M
at
ch
es
SIFT 61 15 1 61 13 0
KAZE 41 12 1 41 12 2
AKAZE 14 6 0 14 6 0
LATCH 9 4 0 9 0 0
Table 2 Matching results of scene 1 between aerial and panoramic image of the 1st and 2nd iteration
Figure 10 Comparison of matching results of AKAZE (top), KAZE (centre) and SIFT (bottom) in 3rd run of the 1st scene
3rd run 4th run
M
atche
s
Inli
er
s
C
or
re
ct
M
atche
s
M
atche
s
Inli
er
s
C
or
re
ct
M
atche
s
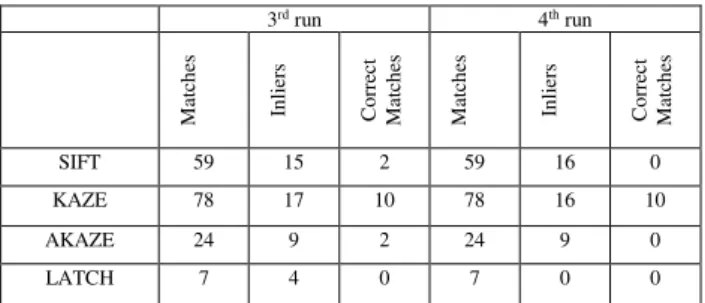
SIFT 59 15 2 59 16 0
KAZE 78 17 10 78 16 10
AKAZE 24 9 2 24 9 0
LATCH 7 4 0 7 0 0
Table 3 Matching results of scene 1 between aerial and panoramic image of the 3rd and 4th iteration
5.2.1.2 Scene 2
The second scene shows linear road markings and parts of a zebra crossing. Whereas major parts of the zebra crossing and the dotted road markings were visible in the first scene, large parts of the road markings are covered by the mobile mapping car itself in the second scene which may impede the matching process. Similarly to the first scene, unmodified imagery was difficult to match and LATCH nor AKAZE found a single correspondence. With SIFT, however, a couple of keypoints could be matched, even though just one correct correspondence has been identified (see Figure 11).
Figure 11 Matched SIFT keypoints in the second scene and first iteration (correct correspondence is light purple)
1st run 2nd run
M
atche
s
Inli
er
s
C
or
re
ct
M
atche
s
M
atche
s
Inli
er
s
C
or
re
ct
M
atche
s
SIFT 54 12 1 54 11 2
KAZE 42 8 1 42 12 0
AKAZE 1 0 0 1 6 0
LATCH 1 0 0 1 0 0
Table 4 Matching results of scene 2 between aerial and panoramic image of the 1st and 2nd iteration
By blurring the images with a Gaussian filter, especially SIFT returns a better result. Albeit only two correct correspondences have been identified, results got considerably better (see Figure 12). Apparently, RANSAC removed a couple of outliers, and was able to stabilise the estimation of the homography. Without ground truth, the matched bars of the zebra crossing might appear as correct correspondences. These descriptor ambiguities have to be tackled on another processing level.
Figure 12 Matched SIFT keypoints in the second scene and second iteration
Now, by resampling the images to 150% of their original size in the 3rd iteration, KAZE benefitted the most, although yielding only 4 correct matches out of 14 matches classified as inliers (see Figure 13).
Figure 13 Matched KAZE keypoints in the second scene and third iteration
Blurring the images prior to resampling them further improves the results for KAZE and AKAZE while decreasing the quality of SIFT’s output (see Figure 14). Again, LATCH did not show any improvement.
Figure 14 Comparison of matching results of AKAZE (top), KAZE (centre) and SIFT (bottom) in 4th run of the 2nd scene
3rd run 4th run
M
at
ch
es
Inli
er
s
C
or
re
ct
M
atche
s
M
atche
s
Inli
er
s
C
or
re
ct
M
atche
s
SIFT 51 12 0 51 11 1
KAZE 79 14 4 79 20 6
AKAZE 15 6 0 15 8 2
LATCH 3 0 0 3 0 0
Table 5 Matching results of scene 2 between aerial and panoramic image of the 3rd and 4th iteration
5.2.2 Aerial images and MLS intensity images
5.2.2.1 Scene 1
In the 1st run (Table 6), KAZE yielded the best results with only few mismatches, and those occurred due to descriptor ambiguity. AKAZE has a competitive result, however obtained fewer matches than KAZE. SIFT and LATCH both equally failed to achieve a reliable number of matches. In the 2nd run, blurring the images, dramatically improved the number of correct matches from SIFT descriptor. Similarly, KAZE’s result also improved moderately. AKAZE has performed consistently
and results did not improve. The image blurring did not have an effect on the poor results of the LATCH descriptor. In the 3rd run (Table 7), resizing the images to 150%, results of SIFT and KAZE have improved. Interestingly, all calculated matches are correct and there is no mismatch. The results from AKAZE have improved slightly as well.
The 4th run, blurring and resizing the images, increased the number of inliers from KAZE, while there is no mismatch as shown in Figure 15. The total number of matches even decreased in case of AKAZE.
Figure 15 Comparison of SIFT (top) and KAZE (bottom) in 4th run on 1st scene.
1st run 2nd run
M atche s Inli er s C or re ct M atche s M atche s Inli er s C or re ct M atche s
SIFT 61 15 1 61 14 12
KAZE 41 12 8 41 13 12
AKAZE 14 7 5 14 7 4
LATCH 9 4 0 9 4 0
Table 6 Matching results of scene 1 between aerial and MLS ortho-image of the 1st and 2nd iteration
3rd run 4th run
M atche s Inli er s C or re ct M atche s M atche s Inli er s C or re ct M atche s
SIFT 59 14 14 59 14 14
KAZE 78 19 19 78 20 20
AKAZE 24 9 6 24 8 3
LATCH 7 4 0 7 0 0
Table 7 Matching results of scene 1 between aerial and MLS ortho-image of the 3rd and 4th iteration
5.2.2.2 Scene 2
In the 1st run (Table 8), on this difficult scene, all descriptors totally failed except KAZE, which also performed poorly due to descriptor ambiguity. SIFT also seemed to struggle with the descriptor ambiguity and therefore yielded no match. Blurring the images did not change anything, except that KAZE’s result slightly improved. The 3rd run (Table 9) did not lead to any significant improvements. Contrarily to the 1st scene, the total number of matches from KAZE even decreased due to descriptor ambiguity. Although AKAZE was able to derive some matches, it cannot be considered as a significant improvement. SIFT and LATCH also failed to achieve a single
match in the 3rd run. In the 4th run, the number of matches from KAZE improved significantly. Interestingly, not a single mismatch could be identified. Results are shown in Figure 16. SIFT, however, could not improve and yielded only a single match.
Figure 16 Matching results of AKAZE (top) and KAZE (bottom) in 4th run on scene 2.
1st run 2nd run
M atche s Inli er s C or re ct M atche s M atche s Inli er s C or re ct M atche s
SIFT 54 10 0 54 11 0
KAZE 42 10 4 42 11 7
AKAZE 1 0 0 1 0 0
LATCH 1 0 0 1 0 0
Table 8 Matching results of scene 2 between aerial and MLS ortho-image of the 1st and 2nd iteration
3rd run 4th run
M atche s Inli er s C or re ct M atche s M atche s Inli er s C or re ct M atche s
SIFT 51 9 0 51 9 1
KAZE 79 17 5 79 21 21
AKAZE 15 6 3 15 8 5
LATCH 3 0 0 3 0 0
Table 9 Matching results of scene 2 between aerial and MLS ortho-image of the 3rd and 4th iteration
6. DISCUSSION
6.1 Conclusion
This paper addressed the topic of tie feature extraction within the framework of the registration of aerial nadir images, mobile mapping panoramic images and MLS data. The aim of the overall project is to develop an automatic pipeline to correct the trajectory of mobile mapping platforms, especially in urban areas where reliable GNSS localisation is scarce. As a prerequisite for an orientation update of the platform’s trajectory, precise tie information is needed. In this paper, feature-based extraction techniques have been evaluated. It could be shown that the outcome highly depends on the algorithm itself and data pre-processing. KAZE seems to be the most reliable feature extraction method in both cases – mobile
laser scanning intensity and panoramic imagery. SIFT and AKAZE only yield mediocre results, and do not benefit from resampling and blurring the images to the same extent as KAZE does. Although the Förstner-Operator detects good and significant features, LATCH failed to describe them accordingly to allow for a successful matching. In our scenario, binary descriptors are not as powerful coping with changes in illumination and contrast as float descriptors, and cannot manage to handle features originating from different sensors that well. However, due to this specific setup, and a very generic feature matching, further tests have to be conducted to draw a thorough conclusion on binary descriptors’ performance. Interestingly, the discussed techniques show a better performance in conjunction with MLS and aerial data than with MMI data.
6.2 Outlook
Evidently, repetitive patterns of road markings are the biggest obstacle for a successful registration of the data sets. To efficiently tackle this issue, spatial information has to be introduced. Although the positioning accuracy of mobile platforms may be diminished in urban areas, their exterior orientation could support feature matching. In other words, they can be utilised to introduce search constraints as they allow for the localisation of individual keypoints. Besides that, using contextual information and shape knowledge can augment feature description to prevent mismatches. Additionally, nonessential descriptor invariances or capabilities could be removed from the respective original implementations (e.g. rotational & scale invariance, sub-pixel localisation etc.). As far as MLS data is concerned, utilising high-level feature extraction methods could further facilitate the registration process also in areas with a lower point density and therefore fewer distinct keypoints. For this reason, entities, such as kerbstones or entire zebra crossings, can be utilised to accomplish this task.
ACKNOWLEDGEMENTS
This project is funded and supported by the Dutch Technology Foundation STW, which is part of Netherlands Organisation for Scientific Research (NWO), and which is partly funded by the Ministry of Economic Affairs.
REFERENCES
Alcantarilla, P. F., A. Bartoli and A. J. Davison (2012). "KAZE Features."
Alcanterilla, P. F., J. Nuevo and A. Bartoli (2013). "Fast Explicit Diffusion for Accelerated
Features in Nonlinear Scale Spaces."
Bay, H., A. Ess, T. Tuytelaars and L. Van Gool (2008). "Speeded-up robust features (SURF)." Computer vision and image understanding 110(3): 346-359.
Beers, B. (2011). "Collection and Application of 2D and 3D Panoramic Imagery."
Calonder, M., V. Lepetit, C. Strecha and P. Fua (2010). "Brief: Binary robust independent elementary features." Computer Vision–ECCV 2010: 778-792.
Egels, Y. and M. Kasser (2001). Digital Photogrammetry, Taylor & Francis, Inc.
Förstner, W. and E. Gülch (1987). "A fast operator for detection and precise location of distinct points, corners and circular features."
Godha, S., M. G. Petovello and G. Lachapelle (2005). "Performance Analysis of MEMS IMU/HSGPS/Magnetic Sensor Integrated System in Urban Canyons." ION GNSS 2005. Harris, C. and M. Stephens (1988). "A Combined Corner and Edge Detector." Proceedings of Fourth Alvey Vision Conference: 147-151.
Heinly, J., E. Dunn and J.-M. Frahm (2012). Comparative evaluation of binary features. Computer Vision–ECCV 2012, Springer: 759-773.
Jaud, M., R. Rouveure, P. Faure and M.-O. Monod (2013). "Methods for FMCW radar map georeferencing." ISPRS Journal of Photogrammetry and Remote Sensing 84(0): 33-42. Ji, S., Y. Shi, J. Shan, X. Shao, Z. Shi, X. Yuan, P. Yang, W. Wu, H. Tang and R. Shibasaki (2015). "Particle filtering methods for georeferencing panoramic image sequence in complex urban scenes." ISPRS Journal of Photogrammetry and Remote Sensing 105(0): 1-12.
Köthe, U. (2003). "Edge and junction detection with an improved structure tensor." Pattern Recognition, Proceedings 2781: 25-32.
Köthe, U. (2003). Gradient-Based Segmentation Requires Doubling of the Sampling Rate.
Kümmerle, R., B. Steder, C. Dornhege, A. Kleiner, G. Grisetti and W. Burgard (2011). "Large scale graph-based SLAM using aerial images as prior information." Auton. Robots 30(1): 25-39.
Leung, K. Y. K., C. M. Clark and J. P. Huissoon (2008). Localization in urban environments by matching ground level video images with an aerial image. Robotics and Automation, 2008. ICRA 2008.
Levi, G. and T. Hassner (2015). "LATCH: Learned Arrangments of Three Patch Codes."
Levinson, J. and S. Thrun (2007). "Map-Based Precision Vehicle Localization in Urban Environments." Robotics: Science and Systems.
Lowe, D. G. (1985). Perceptual Organization and Visual Recognition, Kluwer Academic Publishers.
Lowe, D. G. (2004). "Distinctive image features from scale-invariant keypoints." International Journal of Computer Vision 60(2): 91-110.
Miksik, O. and K. Mikolajczyk (2012). "Evaluation of Local Detectors and Descriptors for Fast Feature Matching." 2012 21st International Conference on Pattern Recognition (Icpr 2012): 2681-2684.
Rosten, E. and T. Drummond (2006). Machine learning for high-speed corner detection. Computer Vision–ECCV 2006, Springer: 430-443.
Tournaire, O., B. Soheilian and N. Paparoditis (2006). "Towards a Sub-Decimetric Georeferencing of Ground-Based Mobile Mapping Systems in Urban Areas: Matching Ground-Based and Aerial-based Imagery Using Roadmarks." ISPRS Commission I Symposium "From Sensors to Imagery".
Yang, X. and K.-T. Cheng (2012). LDB: An ultra-fast feature for scalable augmented reality on mobile devices. Mixed and Augmented Reality (ISMAR), 2012 IEEE International Symposium on, IEEE.