Inês Prata Machado
Bachelor of Science in Biomedical Engineering
Human Activity Data Discovery based on
Accelerometry
Dissertation to Obtain Master Degree in Biomedical Engineering
Adviser :
Dr. Hugo Gamboa, Faculty of Sciences and
Tech-nology, New University of Lisbon
Co-Adviser :
Dr. Vítor Paixão, Champalimaud Foundation,
Cham-palimaud Neuroscience Programme
Jury:
Chairperson: Dr. Mário António Basto Forjaz Secca
Supervisor: Dr. Carla Maria Quintão Pereira
Members of the Committeeis: Dr. Hugo Filipe Silveira Gamboa
Human Activity Data Discovery based on Accelerometry
Copyright c Inês Prata Machado, Faculdade de Ciências e Tecnologia, Universidade
Nova de Lisboa
A Faculdade de Ciências e Tecnologia e a Universidade Nova de Lisboa têm o direito,
perpétuo e sem limites geográficos, de arquivar e publicar esta dissertação através de
ex-emplares impressos reproduzidos em papel ou de forma digital, ou por qualquer outro
meio conhecido ou que venha a ser inventado, e de a divulgar através de repositórios
científicos e de admitir a sua cópia e distribuição com objectivos educacionais ou de
Acknowledgements
I would like to express my sincere gratitude to my supervisor Dr. Hugo Gamboa for the
opportunity to work in the exciting field of human activity recognition, for the guidance,
support and for the knowledge passed on which allowed me to achieve my goals and
dreams. I am very thankful to Dr. Vítor Paixão, my co-supervisor from Champalimaud
Foundation, whose support, dedication, motivation and enthusiasm helped me with no
doubt during this research.
I would like to thank all ofPLUXteam members Neuza Nunes, Filipe Carvalho,
Ri-cardo Gomes, Angela Pimentel, Nídia Batista, Lídia Fortunato and Tiago Araújo for
cre-ating a healthy environment where moments of hard work and pure entertainment were
reconciled harmoniously. A special thanks to Neuza Nunes for her supervision over my
work, for her dedication and patience while helping me during the development of my
thesis. I would like to thank all Costa Lab team members from Champalimaud
Founda-tion for all the support and help during this research.
Finally, also a special thanks goes to my colleagues Marília Barandas e Mafalda
Câ-mara for all the support, laughs and lunches that we shared over these last months. To
my friends Pedro Garcia, Jorge Ferreira, Pedro Moura, Emanuel Marques, Vanessa Cunha
and Margarida Rebelo for making these last five years unforgettable.
Last but not least, I’m very thankful to my family. To my sisters Rita and Ana who
have been by my side everyday, and helped me during my research with patience and
dedication. A special thank to my parents for always trusting me and for giving me the
opportunity to be here today allowing me to grow and evolve personally and
Abstract
The demand for objectivity in clinical diagnosis has been one of the greatest challenges in
Biomedical Engineering. The study, development and implementation of solutions that
may serve as ground truth in Physical Activity (PA) recognition and in medical diagno-sis of chronic motor diseases is ever more imperative. This thediagno-sis describes a Human
Activity Recognition (HAR) framework based on feature extraction and feature selection techniques where a set of time, statistical and frequency domain features taken from
3-dimensional accelerometer sensors was designed. In the present study, machine learning
algorithms were applied in a non-supervised environment using feature representation
of accelerometer data to discover the activities performed by different subjects. A
fea-ture selection framework is developed in order to improve the clustering accuracy and
reduce computational costs. The features which best distinguish a particular set of
ac-tivities were selected from a180th - dimensional feature vector through machine
learn-ing algorithms. The implemented framework achieved very encouraglearn-ing results in
hu-man activity recognition: an average person-dependent Adjusted Rand Index (ARI) of
99.29%±0.5% and a person-independent ARI of 88.57%±4.0% were reached. Accu-rate and detailed measurement of an individual’s PAis a key requirement for helping researchers understand the relationship between motor activity and health.
Keywords: Human Activity Recognition, Sensor Signal Processing, Feature Extraction,
Resumo
A procura pela objectividade no diagnóstico clínico tem sido um dos grandes desafios
na área da Engenharia Biomédica. O desenvolvimento e implementação de ferramentas
que podem servir deground truthno estudo do comportamento humano e no
diagnós-tico médico de doenças crónicas é cada vez mais imperativo. Este trabalho descreve
uma ferramenta de reconhecimento de actividade humana com base na extracção e
selec-ção de características de sinais de acelerometria. São usadas técnicas de aprendizagem
automática baseadas num vector de características do domínio estatístico, temporal e
espectral. As características que melhor distinguem um determinado conjunto de
activi-dades foram seleccionadas através da aplicação de algoritmos de aprendizagem
automá-tica a um vector de 180 caracterísautomá-ticas. Foi desenvolvida uma ferramenta de selecção de
características com o objectivo de optimizar os resultados obtidos e diminuir os custos
computacionais. O algoritmo implementado apresenta resultados bastante promissores.
Foi alcançada uma performance de99.29%±0.5%para testes dependentes do sujeito e
88.57%±4.0%para testes independentes do sujeito. Uma avaliação precisa e detalhada da actividade física é um requisito fundamental para entender a relação entre
comporta-mento e o respectivo estado de saúde do indivíduo.
Palavras-chave: Reconhecimento de Actividade Humana, Processamento de Sinal,
Contents
1 Introduction 1
1.1 Motivation . . . 1
1.2 Objectives of the Current Work . . . 2
1.3 State of the Art : Brief Historical Perspective . . . 3
1.4 Thesis Overview . . . 6
2 Theoretical Background 9 2.1 Activity Recognition based on Wearable Sensor. . . 9
2.2 Number and Body Position of the Accelerometer . . . 11
2.3 Human Activities Acceleration . . . 11
2.4 Machine Learning Techniques for Activity Recognition . . . 12
2.4.1 The K-Means Clustering Algorithm . . . 12
2.4.2 Clustering Distance Metric . . . 13
2.5 General Structure for Human Activity Recognition Systems . . . 13
2.6 Clustering Performance Evaluation . . . 15
2.6.1 Adjusted Rand Index as a Metric for Comparing Partitions . . . 16
2.7 Classification-based Evaluation: Proposed Metric . . . 16
3 Statistical, Temporal and Spectral Domain Features 19 3.1 Statistical Domain Features . . . 19
3.2 Temporal Domain Features . . . 22
4 A Framework for Activity Recognition 27
4.1 Composition of Triaxial Accelerometer Signal . . . 27
4.1.1 Body and Gravitational Acceleration Components . . . 28
4.2 Feature Design. . . 30
4.3 Feature Extraction . . . 31
4.3.1 Preprocessing Techniques: Domains and Approaches . . . 31
4.3.2 Relevant Features for HAR Systems . . . 32
4.3.3 Feature Normalization . . . 34
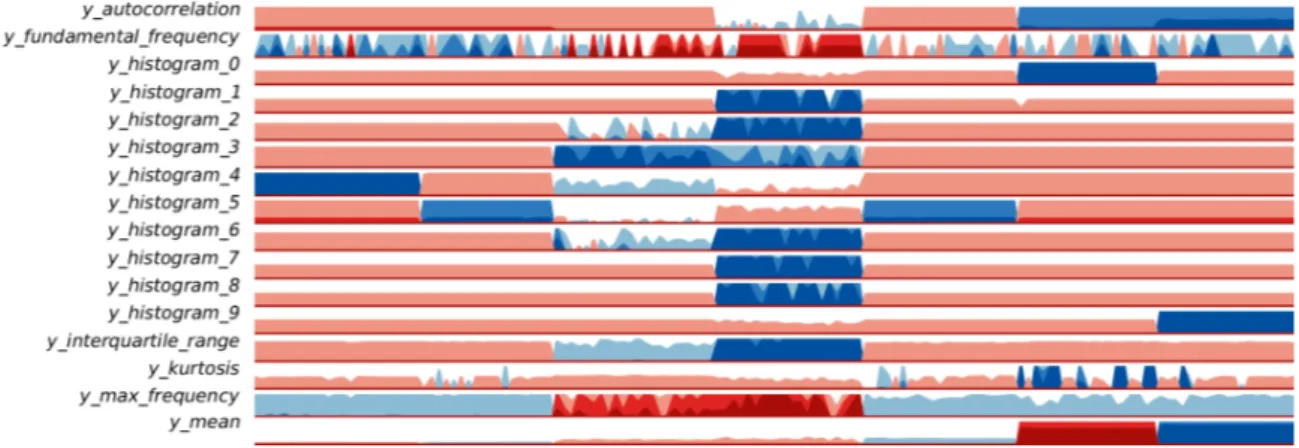
4.4 Graphical Perception of Feature Visualizations: The Horizon Plot . . . 34
4.5 Feature Selection Techniques . . . 35
4.5.1 Choosing an Appropriate Window-Length . . . 35
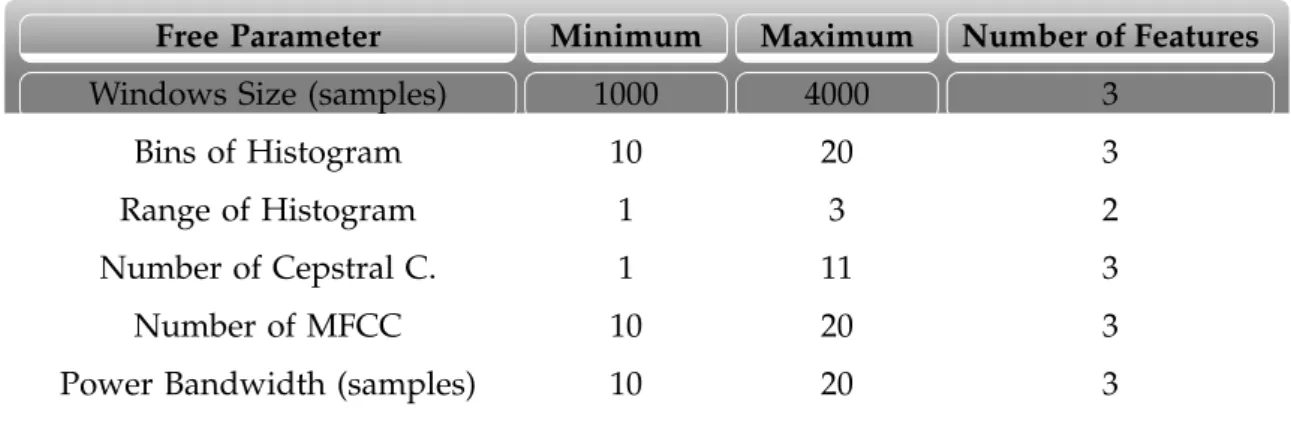
4.5.2 Free Parameters of HAR Features . . . 36
4.6 Unsupervised Learning . . . 37
4.6.1 Signal Annotation: Creating of a Ground Truth. . . 37
5 Performance Evaluation 39 5.1 System Architecture and Data Acquisition . . . 39
5.1.1 Influence of Window Length on the K-Means Performance . . . 40
5.2 Clustering Evaluation for Subject-independent Context . . . 42
5.3 Clustering Evaluation for Subject-dependent Context . . . 43
5.4 Discussion . . . 47
6 Conclusions 49 6.1 General Contributions and Results . . . 49
6.2 Future Work . . . 50
List of Figures
1.1 Thesis Overview. . . 7
2.1 General Structure for Human Activity Recognition Systems. . . 15
3.1 Statistical, Temporal and Spectral Domain Features. . . 20
3.2 Typical recording from the accelerometer showing seven minutes of mo-tion data where the subject is asked to perform specific tasks.. . . 21
3.3 Histogram representation of a typical recording from the accelerometer showing seven minutes of recorded data where the subject is asked to per-form specific tasks. . . 21
4.1 Body and Gravitational Acceleration of Signal Accelerometer Sensor. . . . 30
4.2 Feature Dictionary: histogram collected information. . . 32
4.3 Horizon Graph: Time Series Visualization Technique. . . 35
4.4 Ground Truth: Annotation Structure. . . 38
5.1 Clustering Performance (mean value) as a function of different window length extracted from the best set of features. . . 41
5.2 Orange Software Visualization Scheme. . . 47
List of Tables
2.1 Target Accelerometer System Parameters. . . 10
2.2 Physical activities: Amplitude of the Movement with different Sensor Lo-cations. . . 12
4.1 Collected Information from each Feature. . . 32
4.2 Statistical, Temporal and Spectral Domain Features. . . 33
4.3 Different combinations of Free Parameters and Window Size of the Signal. 37
5.1 Recorded Movements. . . 40
5.2 Clustering Performance (mean value) as a function of different window length extracted from the best set of features. . . 42
5.3 Confusion Matrix, in percentage, for all subjects, where Lying Down(1) is lying down (belly up), Lying Down(2)is lying down (right side down) and Lying Down(3) is lying down (left side down). . . 43
5.4 Clustering Accuracy (mean and standard deviation) per subject. . . 44
5.5 Confusion Matrix, in percentage, for the first subject where Lying Down(1) is lying down (belly up), Lying Down(2) is lying down (right side down) and Lying Down(3)is lying down (left side down). . . 44
5.7 Confusion Matrix, in percentage, for the third subject where Lying Down(1) is lying down (belly up), Lying Down(2) is lying down (right side down) and Lying Down(3)is lying down (left side down). . . 45
5.8 Confusion Matrix, in percentage, for the fourth subject where Lying Down(1) is lying down (belly up), Lying Down(2) is lying down (right side down) and Lying Down(3)is lying down (left side down). . . 45
5.9 Confusion Matrix, in percentage, for the fifth subject where Lying Down(1) is lying down (belly up), Lying Down(2) is lying down (right side down) and Lying Down(3)is lying down (left side down). . . 45
5.10 Confusion Matrix, in percentage, for the sixth subject where Lying Down(1) is lying down (belly up), Lying Down(2) is lying down (right side down) and Lying Down(3)is lying down (left side down). . . 46
5.11 Confusion Matrix, in percentage, for the seventh subject where Lying Down(1) is lying down (belly up), Lying Down(2) is lying down (right side down) and Lying Down(3)is lying down (left side down). . . 46
Acronyms
ACC Accelerometry
AAL Ambient Assisted Living
ASD Autism Spectrum Disorder
ARI Adjusted Rand Index
BA Body Acceleration
DBSCAN Density-based Spatial Clustering of Applications with Noise
FFT Fast Fourier Transform
GA Gravitational Acceleration
HAR Human Activity Recognition
HRV Heart Rate Variability
JSON JavaScript Object Notation
MEMS Microelectromechanical Systems
MFCC Mel-Frequency Cepstral Coefficients
OCD Obsessive Compulsive Disorder
PA Physical Activity
PD Parkinson’s Disease
PSD Power Spectral Density
RI Rand Index
1
Introduction
1.1
Motivation
The constant concern with the human physical and psychological well-being has been
the drive for research studies that have led to a promising evolution of medicine and
engineering. In Biomedical Engineering, the demand for objectivity in clinical diagnosis
has been one of the greatest challenges. The study, development and implementation
of solutions that may serve as ground truth in the medical diagnosis of pathologies so
subjective and hard to trace such as Obsessive Compulsive Disorder (OCD) or Autism Spectrum Disorder (ASD) is ever more imperative.
The change of motor activity is one of the essential signs of psychiatric disorders and
many of these, including Depression andOCD, exhibit diagnostic criteria that require an assessment of the motor activity changes of the patient. The behavioural classification
usually relies on observation, therefore a highly experienced analyst is always needed,
which is the result of a too focused observation on small movements, causing
difficul-ties in long term experiences. Human body movement has up to 244 degrees of freedom
[1], making the modelling of structural and dynamic features for activity recognition of such a tough object, a complex task. Analysing human action is particularly
challeng-ing because of the complex non rigid and self occludchalleng-ing nature of the articulated human
1. INTRODUCTION 1.2. Objectives of the Current Work
during daily life, including objective measurements, such as Heart Rate, Heart Rate
Vari-ability (HRV) and Accelerometry (ACC).
In the medical and therapeutic field, the accelerometer is used in the evaluation of
human movement, detection of sleep disorders and fall detection, amongst other
appli-cations [2]. The aim of this research is to study and propose novel tools forACCin hu-man activity recognition. In the present study, the software OpenSignals [3] was used for signal acquisition and signal processing algorithms were developed in Python
Program-ming Language [4] and Orange Software [5]. This dissertation was developed at PLUX
-Wireless Biosignalsin collaboration with the Champalimaud Foundation - Champalimaud
Neuroscience Programme.
1.2
Objectives of the Current Work
The main focus of the present work is understanding signals produced by a Triaxial
Ac-celerometer (TA), interpreting them in the context of human movement and identifying clinically relevant parameters from the data. Signal processing techniques are
imple-mented with the purpose of examining accelerometer data and finding new information
that would be difficult to identify directly from the raw data.
The hypothesis of the current work is that ACC is a suitable technique for moni-toring movement patterns in free-living subjects over long periods of time and that it
can be used to measure quantitative parameters that can provide clinical insight into the
health status of the subject. A method for convenient monitoring of detailed ambulatory
movements in daily life, using a portable measurement device employing a singleTAis presented. The goal of this thesis is to extract information on statistical, temporal and
spectral domains ofACCsignals for human activity recognition.
Tests will be made, based on machine learning methodologies, which will allow the
identification of different activities performed by different subjects. This tool is based on
an architecture of signal sensor processing, feature extraction, feature selection and
clus-tering algorithms. To achieve the proposed goals, the following steps were implemented:
1. Acquire and analyse the data produced by aTA, placed on different parts of the body, during human movement: create a database and propose an annotation
1. INTRODUCTION 1.3. State of the Art : Brief Historical Perspective
2. Develop a framework for the interpretation of the data provided by anACC moni-toring system: design a set of time, statistical and frequency domain features from
several areas such as speech recognition andPA;
3. Develop algorithms to extract relevant information from the data;
4. Apply clustering algorithms based on feature representation of accelerometer data:
visualization of time series features - The Horizon Plot [6];
5. Explore the choice of features and signal window size on the performance of
differ-ent clustering algorithms;
6. Develop a framework to differentiate human activities, such as sitting, walking,
standing, running and lying;
7. Evaluate the use of the system in daily life settings and the data interpretation
framework: intra and inter subject context discovery;
8. Implement a new metric for assessing the obtained results from unsupervised
tech-niques: classification-based evaluation.
1.3
State of the Art : Brief Historical Perspective
In recent decades, there has been an increasing interest in the use ofACCto monitor hu-man behaviour. The advance of Microelectromechanical Systems (MEMS) has helped the development of small size and low cost accelerometers, making it a very convenient tool
for monitoring free-living subjects. Accelerometers are inexpensive, require relatively
low power [7], and are embedded in most of today’s cellular phones. Many HAR sys-tems have been developed in the past which incorporate the use of accelerometers [8] and nowadays,TAare, perhaps, the most broadly used sensors to recognize ambulatory activities [9].
Those physical activity recognition systems recognize a variety of everyday postures,
physical and household activities and common exercise routines from a small set of
wear-able accelerometers using machine learning techniques. One of the key point is the
di-versity of areas where ACC has been used in the past. The most studied have been: physical activity recognition (defining and comparing group of subjects with different
1. INTRODUCTION 1.3. State of the Art : Brief Historical Perspective
standard reference for the measurement of physical activities), gait, detection of falls and
sit-to-stand transfers (which is an important indicator for postural instability). The use of
accelerometers has helped on diagnose and prevention of a number of diseases such as
Parkinson’s Disease (PD),OCD,ASDand Depression [10,11,12,13,14].
Obsessive Compulsive Disorder is one of the most debilitating neuropsychiatric
dis-orders, characterized by unreasonable thoughts (obsessions) that lead to repetitive
be-haviours (compulsions) [10]. The diagnosis ofOCDis mostly based on descriptions of the experiences lived by the patient, in the behaviours described by relatives and by
evaluating the patient’s mental state. The change of motor activity is one of the essential
signs of psychiatric disorders and many of these, including Depression andOCD, exhibit diagnostic criteria that require an assessment of the motor activity changes of the patient.
Parkinson’s Disease was initially characterized by James Parkinson in 1817. PDis classified as a chronic movement disorder. Predominant attributes ofPDare rigidity from an increase in muscle tone, shuffling gait, impaired balance and tremor during resting
status [11]. Accelerometers have been tested and evaluated for the characterization of
PDstatus, and the integration of accelerometer technology has the potential to further advance treatment ofPD[15].
Autism Spectrum Disorder is a disorder affecting a child’s social development
char-acterized by deficits in social skills, communication and repetitive or restricted interests.
Children with autism will often exhibit behaviours, such as vocal stutters and brief bouts
of vigorous activity (e.g., violently striking the back of the hands) to cope with everyday
life. Over the past few years, research in both physical activity and autism with ACC
has been rigorous, leading to more advanced methods of assessment and sampling [12]. Recognizing this behaviours via wearable sensors can provide valuable information
re-garding an individual’s degree of functional ability.
Depression is a major public health problem and is characterized by one or two
im-portant depressive episodes, such as lowered mood, increased sense of worthlessness,
fatigue, and preoccupation with death and suicide [13]. By using accelerometers, the ef-fects of psychomotor retardation on the level of gross body movement can be measured.
Accelerometers can also be used to identify regions of physical activity, sleep, and
seden-tary behavioural states throughout the day [14].
One type of system designed for elderly people aims to detect potentially dangerous
1. INTRODUCTION 1.3. State of the Art : Brief Historical Perspective
can be seen as a complement to traditional emergency systems such as smoke or fire
alarms, by detecting, for instance, when a person has fallen [16] or when vital body signs indicate imminent health threats [17]. Other type of health-related system aims to use context-information to promote a more active and thus healthy lifestyle, or to actively
support elderly or disabled people in performing everyday activities.
Physical-activity recognition via wearable sensors can provide valuable information
regarding an individual’s degree of functional ability and lifestyle. Even in the case of
healthy people, these movements can be highly individualistic. Nonetheless, there are a
set of basic parameters that are common to all instances of these movements. This allows,
throughACC, the identification and classification of certain behaviours of daily life. To study daily life activities, accelerometers need to be able to detect accelerations between
±12g, in general, and greater than±6gif placed at the waist [18].
Regarding the used classification systems, two approaches have been used to
pat-tern recognition. The first approach uses fixed-threshold classification while the second
approach uses reference-pattern-based classification. In fixed-threshold classification,
ac-tivities and postural orientations are discriminated by applying a threshold (derived
em-pirically) to the accelerometer signal. In reference-pattern-based classification, activity
patterns are compared to template reference patterns [19]. The traditional approach in
HARfor classifying a time series into physical activity, is to use regression-based thresh-olds called cut-points [20] which allow researchers to estimate the time spent performing physical activities at different intensity levels. Researchers, however, have found
cut-points to be inaccurate, and are turning to machine learning methods to identify physical
activity types and estimate energy expenditure more accurately [21].
Several papers have reported high recognition accuracy (92.25% [9], 95% [22], 97% [23], and up to 98% [24]) under different evaluation methodologies. This work aims to go beyond the state of the art inHAR, presenting solutions that address some of current limitations: implement a novel set of features, test different signal segmentation methods,
selecting different window sizes and overlap percentage and propose a novel metric for
unsupervised methodologies.
The main objective of this study is to present a method for convenient monitoring
of detailed ambulatory movements in daily life, by the use of a portable measurement
1. INTRODUCTION 1.4. Thesis Overview
1.4
Thesis Overview
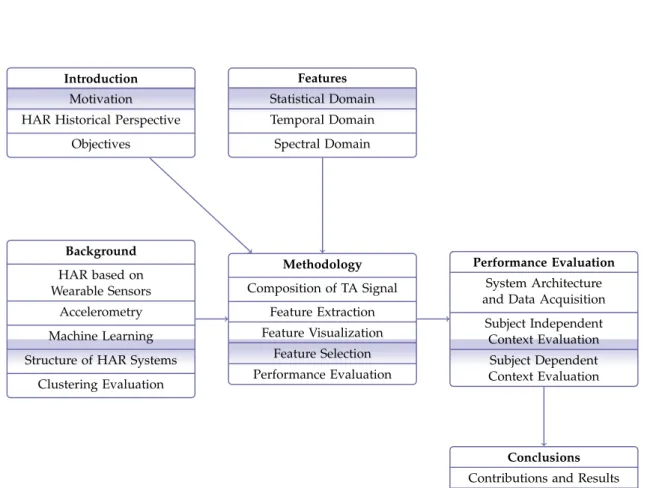
The structure of this thesis is schematically represented in Figure1.1.
In the first two chapters the basis that support the present research is reported. Chapter1
provides a brief historical perspective, where objectives and motivation of this research
are clarified. The importance of objective monitoring human movement is discussed.
Also in this chapter, an overview on other studies about HARwith wearable sensors is presented. In Chapter2, different activities, sensors, and machine learning approaches that have been proposed are discussed. Techniques for the assessment of human
move-ment are reviewed and the choice of ACCfor unsupervised home monitoring is estab-lished. The impact of the sensor specifications has also been analysed.
Chapter3presents a set of time, statistical and spectral domain features used in this investigation. The choice of features is a fundamental first step in applying machine
learning methodologies to sensor data, and it can have a strong influence on the outcome
of any approach.
In Chapter4, the composition of theTAsignal is explained. The signal is made up of several components, and each of these is examined. The proposed methodology and
the approach used in the work to extract and select features based on motion data is
described.
In Chapter5, the carried out tests to pick the features which best distinguish a particu-lar set of activities are described. The experimental evaluation of theACCdata collection and interpretation system is discussed.
In Chapter6, the results obtained from the investigation are presented. This chapter draw the main conclusions from the work and provides recommendations for further
research.
The Appendix contains the paper accepted in the context of the presented research
1. INTRODUCTION 1.4. Thesis Overview
Introduction
Motivation HAR Historical Perspective
Objectives
Background
HAR based on Wearable Sensors
Accelerometry
Machine Learning
Structure of HAR Systems
Clustering Evaluation
Methodology
Composition of TA Signal
Feature Extraction Feature Visualization
Feature Selection Performance Evaluation
Features
Statistical Domain Temporal Domain
Spectral Domain
Performance Evaluation
System Architecture and Data Acquisition
Subject Independent Context Evaluation Subject Dependent Context Evaluation
Conclusions
Contributions and Results Future Work
2
Theoretical Background
Monitoring human movement can provide valuable information on a patient life style,
health status, rate of rehabilitation and other potentially useful clinical data. The present
work addresses these challenges in the context of wearable accelerometer-based simple
activity recognition. ACC is a method of movement kinematic analysis which allows, through the use of an accelerometer, the quantification of caused or suffered
accelera-tions of the human body [25]. It has been pointed out that ACC, a technique that is increasingly being used for monitoring human movement in laboratories and research
studies, is suitable for long term monitoring of human movement [21].
2.1
Activity Recognition based on Wearable Sensor
In signal acquisition, the sensor is the part of the instrument sensible to variations of
the physical parameter to be measured and must be specific to the nature of the signal
to be acquired [25]. Besides the fact that accelerometers usually lead to good results in recognition of physical activities, they are small and cheap, require relatively little
2. THEORETICALBACKGROUND 2.1. Activity Recognition based on Wearable Sensor
acceleration displaces the mass. Acceleration can be defined as the rate of change of
direction or magnitude in the velocity of an object [25]. Therefore, its units arems−2org units, where1g= 9.81ms−2. When choosing an accelerometer, it should be considered:
• Dynamic Range: the±maximum amplitude that the accelerometer can measure
before distorting or clipping the output signal. Dynamic range is typically specified
units ing’s.
• Frequency Response: the frequency range to which the sensor will detect motion
and report a true output. Frequency response is typically specified as a range
mea-sured in Hertz.
• Sensitive Axis:accelerometers are designed to detect inputs in reference to an axis.
Single-axis accelerometers can only detect inputs along one plane. TAcan detect inputs in three orthogonal plans and are suitable for most applications.
• Size and Mass of an Accelerometer: these parameters can change the
character-istics of the tested object. The mass of the accelerometers should be significantly
smaller than the mass of the system to be monitored [25].
The most common accelerometers used in human activity research measure
accelera-tions either in the vertical plane (uni-axial), or in three planes (triaxial) and respond both
to frequency and intensity of the movement [28]. As the majority of human motion oc-curs in more than one movement axis,TAare used to measure the acceleration in each orthogonal axis. Table 2.1presents some accelerometer specifications used in the present investigation.
Table 2.1: Target Accelerometer System Parameters.
Parameter Target Value
Number of axes 3
Sampling Frequency 1.25 to 800 Hz
Maximum Acceleration Amplitude
12 bits 8 bits ±2g 2/2048 2/128 ±4g 4/2048 4/128 and Acceleration Resolution (in bits andg) ±8g 8/2048 8/128
Maximum Acceleration without Damage 5000g
2. THEORETICALBACKGROUND 2.2. Number and Body Position of the Accelerometer
the device can register. The output of an accelerometer worn on the body is dependent
on four factors: the position at which it is placed, its orientation at this location, the
pos-ture of the subject and the activity being performed by the subject [29]. If the subject is at rest, the output of the accelerometer is determined by its inclination relative to the
grav-itational vector. If the orientation of the accelerometer relative to the person is known,
then the resulting accelerometer recordings can be used to determine the posture of the
subject relative to each direction [29].
2.2
Number and Body Position of the Accelerometer
The placement of the accelerometer is a relevant point of discussion. A device that is to
be worn over extended periods must be designed to be as simple to put on and
com-fortable to wear in order to encourage patient compliance [30]. A system with multiple sensors placed across the body can provide superior data to a system that has only a
sin-gle sensor location. However, such system will be more time-consuming and thus, more
inconvenient to put on and wear, which will lead to reduced compliance rates.
One of the key points given is that in order to measure human acceleration, it is
im-portant to understand the motion of the human body and realize which physical property
one wishes to measure [31]. This is necessary in order to choose the right combination of measurement range and accelerometer placement.
Generally, body motion can be measured with a single accelerometer placed close
to the body’s center of mass, which is located within the pelvis [32]. The advantage of this placement is that attachment at the waist allows monitoring of accelerations near the
center of mass. Any movement of the body will cause the center of mass to shift [33]. There are other common placement locations such as chest or thigh [19]. Normally, accelerometers are attached to the part of the body whose movement is being studied.
Ultimately, the optimal position to place the accelerometer depends on the application
and the type of activities to be recognized. The present study aims to develop aHAR
framework, for a waist mounted accelerometer based system.
2.3
Human Activities Acceleration
The magnitude of the acceleration tends to increase from the head to the ankle, and is
2. THEORETICALBACKGROUND 2.4. Machine Learning Techniques for Activity Recognition
decrease from the ankle to the head, and is greater in the vertical direction than in the
transverse plane [18].
The behaviour of the recognition accuracy as a function of the accelerometer sampling
rate was studied by Maurer et al. (2006) [34]. It was shown that no significant gain in accuracy is achieved above 20 Hz for ambulation activities. Table2.2, adapted from [18], shows some amplitude intervals for some typical activities, all units are ing.
Table 2.2: Physical activities: Amplitude of the Movement with different Sensor Loca-tions.
Motion Vertical (g) Horizontal (g)
Head Body Ankle Head Body Ankle
Walking - -0.3; 0.8 -1.7; 3.3 -0.2; 0.2 -0.3; 0.4 -2.1; 0.4 Running 0.8; 4.0 0.9; 5.0 3.0; 12.0 - -
-Since the measurement ranges have an impact on the precision and cost of the
ac-celerometer, and the frequency determines the sampling rate of the device, this
knowl-edge becomes important when designing a sensor for clinical assessment.
2.4
Machine Learning Techniques for Activity Recognition
An efficient approach based on machine learning methods has been recently proposed in
several research projects with focus on activity recognition. Machine learning algorithms
based on the feature representation of accelerometer data have become the most widely
used approaches in PAprediction [35]. There are two main types of machine learning algorithms: unsupervised and supervised learning. In this thesis, unsupervised learning
was chosen because of it collection of methods for grouping unlabelled data into subsets
(called clusters) that are believed to reflect the underlying structure of the data, based on
similarity groups within the data.
2.4.1 The K-Means Clustering Algorithm
K-means is a commonly used partitioning based clustering technique that searches for a
specified number of clusters, which are represented by their centroids, by minimizing an
error function [36]. This algorithm takes as input the number of clusters to generate,C, and a set of observation vectors to cluster and returns a set of centroids, one for each of
theCclusters. The input data points are allocated to one of the existing clusters according
2. THEORETICALBACKGROUND 2.5. General Structure for Human Activity Recognition Systems
(centroid) of each cluster is then computed so as to update the cluster center. This update
occurs as a result of the change in the membership of each cluster. The processes of
re-assigning the input vectors and the update of the cluster centers is repeated until no more
change in the value of any of the cluster centers. An observation vector is classified with
the centroid index of the centroid closest to it.
The k-means algorithm tries to minimize distortion, which is defined as the sum of
the squared distances between each observation vector and its dominating centroid [37]. Each step of the k-means algorithm refines the choices of centroids to reduce distortion.
The change in distortion is used as a stopping criterion: when the change is lower than a
threshold, the k-means algorithm is not making sufficient progress and terminates. One
can also define a maximum number of iterations. If there is a set of observations vector
xjwithj= 1, . . . , N, to be organized intoCipartitions withi= 1, . . . , k, then the squared error criterion is defined by Equation2.1:
J(M) =
k X
i=1
N X
j=1
kxj−mik2 (2.1)
wheremiis an element of the cluster prototype or centroid matrixM [38].
2.4.2 Clustering Distance Metric
A good clustering test will produce clusters in which the intra-class similarity is high and
the inter-class similarity is low. The K-Means Clustering Algorithm [39] gives a single set of clusters, with no particular organization or structure within them. An important
component of a clustering algorithm is the distance measured between data points. If the
components of the data, for instance vectors, are all in the same physical units then it is
possible that the simple Euclidean distance metric is enough to successfully group similar
data instances. Another type of distance measurement that can be used is Hamming,
Manhattan or Pearson Correlation [39].
2.5
General Structure for Human Activity Recognition Systems
In the literature, there are many different methods to extract activity information from
2. THEORETICALBACKGROUND 2.5. General Structure for Human Activity Recognition Systems
Feature Extraction, Dimensionality Reduction and lastly, Clustering or Classification
Pro-cess. Figure2.5represents the general structure forHARsystems.
Preprocessing:Initial samples received from any type of sensor are called raw data.
Accelerometers respond to gravitational and body acceleration and the aim of filtering
the signal was to approximately separate the Body Acceleration Component and the
Gravitational Acceleration Component [41]. In the present study, in order to isolate the Body Acceleration Component, a second-order Butterworth High-Pass filter with cut-off
frequency of 0.25 Hz was used.
Segmentation: Different segmentation methods can be applied to time-series data
which enhance relevant signal properties and enable the gather of useful information
from continuous stream of data: in the present study, timing windows and sliding
win-dows were considered as segmentation methods [40]. For activity recognition, where ac-celerometer data from physical activity is windowed, the choice of the number of frames
is guided by a trade-off between two aspects: information and resolution. In the present
study, the accelerometer data was collected, cleaned, and preprocessed to extract features
that characterize 1000, 2000 and 4000 samples data windows with different overlap
per-centages.
Feature Extraction:Features can be defined as the abstractions of raw data since they
are reduced sets of original raw data which basically represent main characteristics and
behaviours of the signal. The reduced subset of large input data can be called as a
fea-ture vector, it contains important hints for the activity to be recognized and it is the main
input for clustering algorithms [40]. In the present investigation, features are grouped as time, frequency and statistical domains.
Dimensionality Reduction: The aim of dimensionality reduction is to reduce the
computational complexity and increase the performance of the activity recognition
pro-cess. After the previous steps, collected data can be used directly in the clustering step.
But some part of data may not even contribute to the results of the clustering process.
Therefore, feature selection chooses distinguishing features from a set of candidates and
2. THEORETICALBACKGROUND 2.6. Clustering Performance Evaluation
Clustering Algorithms:Clustering mechanisms separate and organize unlabeled data
into different groups whose members are similar to each other in some metric [42]. These groups are called clusters. Being a method of unsupervised learning, the learner only
receives unlabeled inputs with no class information. A good clustering test will produce
clusters in which the intra-class similarity is high and the inter-class similarity is low. The
ultimate goal of clustering is to provide meaningful insights from the original data. In
the present work, K-Means Clustering Algorithm [39] was used.
Separate Body and
Gravi-tational Acceleration
Feature Extraction
Feature Selection
Clustering Algorithm
Best Cluster Permutation
Processing Proposed
Evaluation
Proposed Algorithm
Figure 2.1: General Structure for Human Activity Recognition Systems.
2.6
Clustering Performance Evaluation
Ideally, after a feature space clustering procedure, each cluster should contain samples
of only one activity. This would indicate that the data of the given feature was clearly
separable and thus, well-suited as an input for classification.
In the worst case, the clustering performance is equal to the probability of the
per-formed activity (∼ n−1 wherenis the number of activities). This would imply that the feature was not discriminative for the given set of activities and thus unlikely to be suited
for recognition [43]. The clustering performance should be higher than random guessing. Evaluating the performance of a clustering algorithm is not as trivial as counting the
number of errors or the precision and recall of a supervised classification algorithm. In
2. THEORETICALBACKGROUND 2.7. Classification-based Evaluation: Proposed Metric
into account, but rather if this clustering define separations of the data similar to some
ground truth set of classes or satisfying some assumption such that members belong
to the same class are more similar that members of different classes according to some
similarity metric.
2.6.1 Adjusted Rand Index as a Metric for Comparing Partitions
Given the knowledge of the ground truth class assignment (labels true) and predicted
labels from the clustering algorithm, theARIis a function that measures the similarity of the two assignments, ignoring permutations and with chance normalization [39]. IfCis a ground truth class assignment andkthe clustering labels,xandyare defined as:
• x, the number of pairs of elements that are in the same set inCand in the same set
ink.
• y, the number of pairs of elements that are in different sets inCand in different sets
ink.
The raw (unadjusted) Rand index is then given by Equation2.2:
RI = x+y Cnsamples
2
(2.2)
WhereCnsamples
2 is the total number of possible pairs in the dataset (without ordering).
However, the Rand Index (RI) score does not guarantee that random label assignments will get a value close to zero (mainly if the number of clusters is in the same order of
magnitude as the number of samples) [39]. To counter this effect the expected of random labels can be discounted by defining the adjusted Rand index shown in Equation2.3:
ARI = RI−E[RI]
max(RI)−E[RI] (2.3)
2.7
Classification-based Evaluation: Proposed Metric
Evaluation of unsupervised approaches is usually difficult due to the lack of ground
2. THEORETICALBACKGROUND 2.7. Classification-based Evaluation: Proposed Metric
• Clustering the data into homogeneous groups.
• Creating rules that connect instances to the correct clusters.
• Recognizing activities inside the clusters.
A confusion matrix contains information about true and predicted labels from a
clus-tering system. The performance of such systems is commonly evaluated using the data
in the matrix. Once the clustering algorithm randomly associates the clustering results
to non- annotated groups, theAlgorithm 1, that links these groups to their corresponded
activity, was implemented.
Algorithm 1Best Cluster Permutation.
1: dim←matrix.shape[0] ⊲Compute matrix dimension
2: p←matrix.argmax(axis= 1) ⊲Find maximum value index for each row
3: up←unique(p) ⊲Sort unique index ofp
4: iflen(up) ==dim then
5: returnp ⊲Check if there is only a maximum value per row
6: else
7: newP ←zeros(dim)−1.0 8: foriinrange(len(up))do
9: ind←f ind(up[i] ==p) 10: iflen(ind) == 1 then
11: newP[ind]←up[i] 12: else
13: bInd←argmax(amax(m[ind,:],1),0) ⊲Find the maximum index and assign it
14: newP[ind[bInd]]←up[i]
15: end if
16: end for
17: ind←f ind(newP ==−1) ⊲Check labels not assigned 18: miss←range(dim)−set(up)
19: tempP ←bcp(matrix[ind,:][:, missing]) ⊲Matrix is recursively built
20: newP[ind]←miss[tempP] ⊲Returns vector with true assignments 21: newCm←zeros((dim, dim))
22: foriinarange(len(newP))do
23: newCm[i,:]←matrix[newP[i],:] 24: end for
25: returnnewCm ⊲Returns Confusion Matrix
26: end if
This function receives the confusion matrix of random assignment and goes through
each row of the matrix and stores the index that contains the maximum value of each
row. It is checked whether the index is unique throughout the matrix. If the index is
2. THEORETICALBACKGROUND 2.7. Classification-based Evaluation: Proposed Metric
labels. Otherwise, it checks the index with the maximum value, and assigns it. The
process is recursively repeated. After obtaining the assignment vector, the matrix with
3
Statistical, Temporal and Spectral
Domain Features
The choice of features is a fundamental first step in applying machine learning
method-ologies to sensor data, and it can have a strong influence on the outcome of any approach.
In the present work, each activity is model based on timing and sliding window
strate-gies. Specifically, the continuous sensor streams are divided into fixed length windows.
By choosing a proper window length, all the information of each activity can be extracted
from each single window. The information is then transformed into a feature vector by
computing a180th- dimensional feature vector over the sensor data within each window.
Three sets of features which are incorporated in the recognition investigation framework
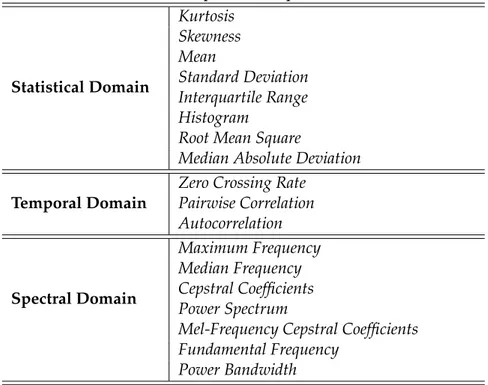
are now described. Figure3summarizes the list of features considered in this work.
3.1
Statistical Domain Features
A fundamental task in many statistical analysis is to characterize the location and
vari-ability of the time series. A further characterization of the data includes skewness,
kur-tosis and histogram. Histogram is an effective graphical technique for showing both the
3. STATISTICAL, TEMPORAL ANDSPECTRALDOMAINFEATURES 3.1. Statistical Domain Features Features
Statistical Domain Temporal Domain Spectral Domain Kurtosis
Skewness Mean Standard Deviation Interquartile Range
Histogram Root Mean Square Median Absolute Deviation
Zero Crossing Rate Pairwise Correlation
Autocorrelation
Maximum Frequency Median Frequency Cepstral Coefficients Power Spectral Density
Mel-Frequency Cepstral Coefficients Fundamental Frequency
Power Bandwidth
Figure 3.1: Statistical, Temporal and Spectral Domain Features.
can be used to evaluate that variable as a predictor of static and dynamic activities.
Kur-tosis is a measure of whether the data are peaked or flat relative to a normal distribution
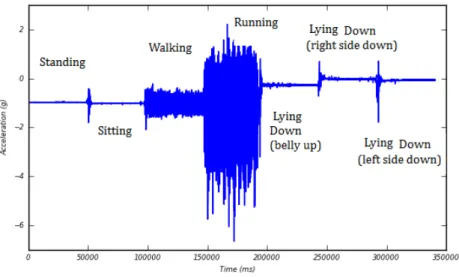
[44]. Skewness is a measure of the degree of asymmetry of the sensor signal distribu-tion [44]. This function receives as inputs an-dimensional array with data and the axis along which skewness is calculated. Figure 3.2 represents a typical recording from the accelerometer showing seven minutes of motion data, where the subject is asked to
per-form specific tasks. Time, in milliseconds, is represented in thex-axis and the magnitude
of the acceleration is represented, ing, in they-axis. Histogram is a graphical representa-tion of the distriburepresenta-tion of data, Figure 3.3. This function groups data into bins, plotting the number of members in each bin against the bin number. It receives the number of
bins and defines the number of equal-width bins in the given range (the lower and upper
3. STATISTICAL, TEMPORAL ANDSPECTRALDOMAINFEATURES 3.1. Statistical Domain Features
Figure 3.2: Typical recording from the accelerometer showing seven minutes of motion
data where the subject is asked to perform specific tasks.
The result of a normalized histogram is the value of the probability density function
at the bin, normalized such that the integral over the range is 1 [44]. An array of different number of bins is calculated for each axis, representing the distribution of acceleration
values. The amplitude, number of members in each bin, is considered as a new feature
to add to the feature vector.
3. STATISTICAL, TEMPORAL ANDSPECTRALDOMAINFEATURES 3.2. Temporal Domain Features
Mean is the DC component (average value) of the signal over the window. There
have been various early uses of the mean metric in activity recognition [45,46]. Several researchers have used the mean to identify user posture (sitting, standing or lying) and
also to discriminate the type of activity as either dynamic or static [47]. The Standard Deviation can give an indication of the stability of a signal, measuring the variability of
the signal over the window. The standard deviation of the acceleration signal is useful
in capturing the range of possible acceleration values to separate activities that may look
similar in nature but different in their speed and acceleration (e.g. walking vs. running).
In the past, Median Absolute Deviation was used in the automated detection of epileptic
seizures [48].
The Root Mean Square is the quadratic mean value of the signal over the window.
In the past, root mean square has been used to classify wavelet results by distinguishing
walking patterns [49] and is present in works of activity recognition [50]. Interquartile Range represents a measure of the statistical dispersion, being equal to the difference
between the75thand the25thpercentiles of the signal over the window. When the mean
values of different classes are similar, the interquartile range represents the dispersion of
the data and avoids the effect on range caused by extreme values in the data. As Median
Absolute Deviation, this feature was used in the automated detection of epileptic seizures
and in fall detection studies [48].
3.2
Temporal Domain Features
This section highlights the common uses of temporal-domain analysis for the recognition
of user activity from accelerometer data. Zero-crossing can be defined as the total number
of times that the signal changes from positive to negative or vice versa, normalized by
the window length. A non-zero threshold can be defined, which can be an extracted
mean value. Zero Crossing Rate is commonly applied to audio signals to identify the
surrounding environment or the type of sound such as music, speech, and noise [51]. In this work, zero crossing rate is used in human activity recognition perspective.
Signal correlation is used to measure the strength and direction of a linear relationship
between two signals. In activity recognition, correlation is especially useful in
3. STATISTICAL, TEMPORAL ANDSPECTRALDOMAINFEATURES 3.3. Frequency Domain Features
between the signals for the various axes. The most commonly used is Pearson’s
coeffi-cient [53],ρx,y, also known as the sample correlation coefficient, calculated as the ratio of the covariance of the signals along the x-axis and the y-axis to the product of their
standard deviations, as shown in Equation3.1:
ρx,y =
cov(x, y)
σxσy (3.1)
The sample correlation coefficient was applied in [52], in order to determine which are the best classifiers (or combination of them) for recognizing activities, and which among
several features are the most relevant. The correlation among accelerometer axes is useful
in distinguishing activities that may appear similar but are performed in different
dimen-sions. Autocorrelation is a commonly used feature of activity recognition to apply in a
sliding window algorithm in order to measure the self-similarity of time series segments
[54].
3.3
Frequency Domain Features
Understanding the difference between the resulting vector of a Fourier transform and
the vector of accelerometer readings is crucial to understand the Fourier transform itself.
In order to derive frequency-domain features, the window of sensor data must first be
transformed into the frequency domain, normally using a Fast Fourier Transform (FFT). The vector produced by the Fourier transform represents the distribution of values over a
range of frequencies. The output of aFFTgives the basis coefficients which represent the amplitudes and phases of the frequency components of the signal and the distribution of
the signal energy. This section highlights the common uses of frequency-domain
analy-sis for the recognition of user activity from accelerometer data. Maximum and Median
Frequency are computed. The inputs of maximum frequency are the motion data and the
sampling frequency of the signal’s acquisition,Algorithm 2.
Algorithm 2:Maximum Frequency
Input: motion data and sampling frequency.
3. STATISTICAL, TEMPORAL ANDSPECTRALDOMAINFEATURES 3.3. Frequency Domain Features
This algorithm computes theFFTof the input signal and, from the obtained frequency signal distribution, finds the frequency point where theFFTreaches its 95% of distribu-tion. This value is considered the maximum frequency point. The pseudo code to
com-pute maximum frequency is shown below:
Algorithm 2Maximum Frequency
1: f, f s←f f t(signal, samplingf requency) ⊲Compute Fast Fourier Transform
2: cf s←cumsum(f s) ⊲Cumulative Sum of the FFT elements
3: mag_index←f ind(cf s > cf s[−1]∗0.95)[0] ⊲Find index
4: max_f req←f[mag_index] ⊲Returns maximum frequency
Regarding median frequency, the inputs of this function are the motion data and the
sampling frequency. Like the previous algorithm, this one computes theFFTof the input signal and finds the frequency point in which the FFT reaches its 50% of distribution. This value is, by definition, the median frequency point.
Usage of Power Spectral Density (PSD) functions for extraction of features is a stan-dard approach in various areas of pattern recognition, including activity recognition,
acoustics and imaging [55].
Algorithm 3:Power Spectral Density
Input: ACC signal and sampling frequency.
Output: maximum power and respective frequency peak.
First, this algorithm computes thePSDof the given signal. ThePSD describes how the power of a time series is distributed with frequency. This function returns an array
of frequencies ranging from 0 Hz to sampling frequency, and the power corresponding
to each frequency,Algorithm 3. With this information, the algorithm finds the maximum
peak power and returns its value and the frequency where it occurs. PSD reduces the redundancy in signals by concentrating energy into smaller areas of the frequency
do-main. In the present work, a straightforward approach is to use magnitude averages of
PSDover a few frequency intervals. The inputs of this function are the motion data and sampling frequency of the signal. The pseudo code toPSDis shown below:
Algorithm 3Power Spectrum Density
1: power, f req←psd(sig/std(sig), F S) ⊲Compute Power Spectrum Density
2: maxP ower←max(power) ⊲Find the maximum value of PSD
3. STATISTICAL, TEMPORAL ANDSPECTRALDOMAINFEATURES 3.3. Frequency Domain Features
The cepstrum is defined as the inverse Fourier transform on the log-magnitude Fourier
spectrum [56]. The coefficients that make up the resulting cepstrum are known as the Cepstral Coefficients. In the past, cepstral coefficients have only been used for the
identi-fication of echoes that are present in an acoustic signal [56] but later, cepstral coefficients have been shown to be a feasible set of features for speaker identification and even for
musical instrument identification [57]. In the present work, cepstral coefficients are used in human activity recognition perspective.
Stevens et al. (1937) proposed the mel scale, which is a scale of pitches judged to be
equal in distance from one another according to human perception [58]. Mel-frequency cepstrum is mapped onto the mel scale before the log and inverse fourier transform is
taken. As such, the scaling in mel frequency cepstrum mimics the human perception of
distance frequency and its coefficients are know as the Mel-Frequency Cepstral
Coeffi-cients (MFCC). MFCCare now widely used in speaker recognition tasks [59] and has been shown to yield excellent results [60], [61]. In [60], it is also shown thatMFCC out-performs normal cepstral coefficients for speaker recognition. MFCCare used today in voice recognition areas - audio finger printing [62]. For the first time, these coefficients appear in physical activity recognition and have revealed to be quite promising due to
the achieved performances.
The fundamental frequency, f0, of a periodic or quasi-periodic signal is the inverse of the repeating period pattern length, which is the longer repeating unit of a signal.
Considering the signal as a superposition of sinusoids, the f0 is the lowest frequency harmonic [63]. Regarding activity recognition, for example, as cycling involves a uni-form movement of the legs, a frequency-domain analysis of thigh acceleration shows a
single dominant frequency. In contrast, running or walking may result in more complex
4
A Framework for Activity
Recognition
Most approaches to activity recognition, using body-worn accelerometers, involve a
multi-stage process. Firstly, the sensor signal is divided into a number of small time segments,
referred to as windows, each of which is considered sequentially. For each window, one
or more features are derived to characterize the signal. These features are then used as
input to a clustering algorithm which associates each window with a cluster. Before
us-ing the accelerometer system in any monitorus-ing context and before the development of
algorithms to interpret data recorded by the system, it is necessary to understand the
na-ture of the signals produced by theTAunit. The signal is made up of several components and each component is examined. The difficulties in distinguishing between the different
signal components are discussed.
4.1
Composition of Triaxial Accelerometer Signal
This section describes the composition of the TA signal. According to [41], the signal measured by each fixed-body accelerometer is a linear sum of, approximately, three
4. A FRAMEWORK FORACTIVITYRECOGNITION 4.1. Composition of Triaxial Accelerometer Signal
• Acceleration resulting from body movement - Body Acceleration Component;
• Acceleration resulting from gravity - Gravitational Acceleration Component;
• Noise intrinsic to the measurement system.
The first two components provide different information about the wearer of the
de-vice: the Gravitational Acceleration (GA) provides information about the space orienta-tion of the device, and the Body Acceleraorienta-tion (BA) provides information about the move-ment of the device. The separation of the information regarding the movemove-ment of the
device - BA Component - is important, however these two components have overlap-ping frequency spectra.
According to [41], theBAcomponent ranges from above 0 Hz to possibly up 20 Hz, but it is mostly contained in the range above 0 and below 3 Hz. This range overlaps the
area covered by theGAcomponent, which goes from 0 to several Hertz. This makes the identification of the signal parts which correspond to theBAor to theGAcomponents, difficult. It is possible to approximately separate the BAand theGAcomponents with some filtering. In [41], a wide range of different filters types with different characteristics and different windowing percentages were tested, in order to determine their ability to
differentiate the components of the acceleration signal.
4.1.1 Body and Gravitational Acceleration Components
Accelerometers respond to Gravitational and Body Acceleration. TheGAis also referred to the static component, while acceleration due to body movement is referred to the
dy-namic component. According to [41], theBAcomponent depends on three factors:
• The nature of the activity being undertaken;
• The location on the body at which the acceleration is measured;
• The orientation of the accelerometer relative to the body;
Considering thatx,y, andzare the outputs of theTAalong thex,yandz-axes respec-tively, and that theGAcomponent along thex-axis is represented byxGA, and similarly for theyandz-axes, then:
4. A FRAMEWORK FORACTIVITYRECOGNITION 4.1. Composition of Triaxial Accelerometer Signal
y=yGA+yBA (4.2)
z=zGA+zBA (4.3)
The resultant acceleration, measured by an accelerometer, is the vector sum of all of
the accelerations acting on the device along the sensitive axis - Equations4.1, 4.2, 4.3. This is equal to the gravitational acceleration component plus the body acceleration
com-ponent, neglecting the effects of noise - Equation4.4.
ρ=px2+y2+z2 =p
(xGA+xBA)2+ (yGA+yBA)2+ (zGA+zBA)2 =
=
q
(x2GA+yGA2 +zGA2 ) + (x2BA+yBA2 +zBA2 ) + 2(xGAxBA+yGAyBA+zGAzBA) =
=pρGA+ρBA+ 2(xGAxBA+yGAyBA+zGAzBA)
(4.4)
whereρis the acceleration magnitude vector.
All human movement contains some postural reorientation, therefore, when theTA
is worn by a person, changes in the acceleration signals are made up of simultaneous
changes in theGAandBAcomponents. As there are temporal and frequency overlaps between the two components, it is not possible to perfectly separate them, and
approxi-mations must be made. In the present work, a cut-off frequency of 0.25 Hz was chosen,
as it is consistent with the frequencies used in other research works. For example, [64] and [65] choose to use 0.5 Hz, while [66] choose 0.1 Hz.
Figure4.1 illustrates the motion data processing of a typical recording from the ac-celerometer, showing seven minutes of recorded data during a supervised test where the
subject is asked to perform specific tasks. In order to isolate theBAComponent, a Butter-worth High-Pass Filter was used. The acceleration signal in blue represents the original
4. A FRAMEWORK FORACTIVITYRECOGNITION 4.2. Feature Design
0 50000 100000 150000Time (ms)200000 250000 300000 350000 2
0 2 4 6 8
Acceleration (g)
Total Acceleration
Body Acceleration
Gravitational Acceleration
Body and Gravitational Acceleration
Figure 4.1: Body and Gravitational Acceleration of Signal Accelerometer Sensor.
4.2
Feature Design
TA are made up of three separated accelerometer data time series, one time series for acceleration on each axis ACCx, ACCy and ACCz. Complementary to the three axes data, an additional time series,ACCtot, have been obtained by computing the magnitude of the acceleration - Equation4.5:
ACCtot= q
ACC2
x+ACCy2+ACCz2 (4.5)
Each time seriesACCi, withi = x, y, zwas filtered with a High-Pass Butterworth filter in order to separate the low frequency component and the high frequency component, as
suggested in [41] and [67]. Algorithm 4receives as inputs the originalACCsignal, the sampling frequency of data, the cut-off frequency and the order of the filter.
Algorithm 4:Body Acceleration Component
Input: ACC data, sampling frequency, cut-off frequency, filter
order.
Output: filtered signal.
4. A FRAMEWORK FORACTIVITYRECOGNITION 4.3. Feature Extraction
z, representing the time series for body acceleration component. Finally, the features for
each time series are extracted.
4.3
Feature Extraction
Features can be defined as the abstractions of raw data since they are reduced sets of
original raw data which represent main characteristics and behaviours of the signal. The
reduced subset of large input data can be called feature vector, it contains important hints
for the activity to be recognized and it is the main input for clustering algorithms [40]. In this section, tests are performed in order to assess the following parameters:
• The influence of the signal window size on the clustering performance.
• The influence of the free parameters in that same performance.
• The best feature combination that leads to a better performance of the implemented
algorithm.
4.3.1 Preprocessing Techniques: Domains and Approaches
The present study investigates a new method of feature extraction for clustering
tech-niques. A dictionary of features that were later extracted from the motion data, was
cre-ated, in a JavaScript Object Notation (JSON) [68].Algorithm 5describes how the feature dictionary was built. The pseudo code to create this dictionary is shown below:
Algorithm 5Feature Dictionary
1: data←jsonLoad(open(feature_Dictionary.Json)) ⊲Load Feature Dictionary
2: domain←data.keys() ⊲Find different domains 3: forf eatindomaindo ⊲Goes through all features
4: DomainF eats←data[f eat].keys()
5: forparamsinDomainF eatsdo ⊲Collected all information
6: data[f eat][params]←dict(Def ault.items() +data[f eat][params].items()) 7: end for
8: end for
For each feature, the following information is collected: Description, Imports, Use,
Free Parameters, Parameters, Number of Features, Function, Source and Reference, as
shown in Table4.1.
Some of these parameters are common for a certain group of features. A default
4. A FRAMEWORK FORACTIVITYRECOGNITION 4.3. Feature Extraction
Table 4.1: Collected Information from each Feature.
Description Brief description of the information extracted from the feature. Imports Necessary imports for the feature extraction properly work. Function Function that allows the extraction of the respective feature. Free Parameters Particular inputs of the function.
Parameters Inputs.
Number of Features The function’s number of outputs.
Use If, for a given clustering iteration, the feature is used or not.
Reference Code Reference.
Source Code Source.
features dictionary. For example, for the histogram, the extracted parameters are shown
in Figure4.2
{"statistical domain": {"histogram":
"description": "The grouping of data into bins.
Number of members in each bin against the bin number.",
"imports":"from openSignalsAccel.features import hist",
"function": "hist",
"free parameters":"nbins": [10, 20, 3], "r": [1,3,2],
"number of features": 3,
"source": "Python 2.7, Numpy Library",
"reference": "Python 2.7, Numpy Library" }
}
Figure 4.2: Feature Dictionary: histogram collected information.
4.3.2 Relevant Features for HAR Systems
Recognizing human activities depends directly on the features extracted for motion
anal-ysis. People tend to perform the same movement in a variety of different ways which
can lead to substantial variability in the features derived from body-fixed sensor data.
Therefore, to achieve effective clustering, the identification of features with high
discrim-inative ability is of high importance. A good feature set should show little variation
be-tween repetitions of the same movements and across different subjects, but should vary
considerably between different activities.
The developed dictionary divides the features into the following categories:
4. A FRAMEWORK FORACTIVITYRECOGNITION 4.3. Feature Extraction
studies and proved to be useful for activity recognition, as described in Chapter3. Oth-ers, likeMFCChave appeared for the first time inPArecognition and have revealed to be quite promising due to the achieved performances. By manipulating this dictionary, it is
possible the reproduction of clustering tests with different feature combination. Table4.2
shows the list of features considered in the present work.
Table 4.2: Statistical, Temporal and Spectral Domain Features.
Statistical Domain
Kurtosis Skewness Mean
Standard Deviation Interquartile Range Histogram
Root Mean Square
Median Absolute Deviation
Temporal Domain
Zero Crossing Rate Pairwise Correlation Autocorrelation
Spectral Domain
Maximum Frequency Median Frequency Cepstral Coefficients Power Spectrum
Mel-Frequency Cepstral Coefficients Fundamental Frequency
Power Bandwidth
For each signal, three new vectors were created: one with the feature information
per window, another with the names of the features that were extracted in the respective
clustering test and another with the label of the activity that corresponds to each window.
This way,180th- dimensional feature vector was obtained.
Algorithm 6creates a matrix withn-samples bym-features. It also outputs an array
with feature names. This feature vector has the ability to describe all known
character-istics of any instance. Features are then fed to a module which implements a specific