RAPIDMAP – RAPID MAPPING AND INFORMATION DISSEMINATION FOR DISASTERS
USING REMOTE SENSING AND GEOINFORMATION
E. Baltsavias a, *, K. Cho b, F. Remondino c, U. Soergel d, H. Wakabayashi e
a
ETH Zurich, Institute of Geodesy and Photogrammetry, Wolfgang-Pauli-Str. 15, CH-8093, Zurich, Switzerland - [email protected]
b
Tokai University, School of Information and Science & Technology, 4-1-1 Kitakaname Hiratsuka, Kanagawa 259-1292, Japan - [email protected]
c
Bruno Kessler Foundation, 3D Optical Metrology unit, via Sommarive 18, 38123, Trento, Italy - [email protected]
d
Leibniz Universität Hannover, Institute of Photogrammetry and GeoInformation, Nienburgerstrasse 1, 30167 Hannover, Germany - [email protected]
e
Nihon University, College of Engineering, I Computer Science, 1 Nakagawara, Tokusada, Tamura-machi, Koriyama, Fukushima, 963-8642 Japan - [email protected]
Submitted to ISPRS Conference on "Serving Society with Geoinformatics" ISPRS2013-SSG, Commission VII
KEY WORDS: Multi-modal data, Hazards, Change Detection, Data Fusion, Data Co-registration, Pattern Recognition, Near-Real-Time monitoring, Decision Support Systems
ABSTRACT:
This paper will present the project RAPIDMAP. The project is part of CONCERT-Japan, an ERA-NET initiative funded through the FP7 INCO project frame for enhancing research cooperation between European countries and Japan on two topics, one of which is Resilience Against Disasters. The project started in June 2013 and has a duration of 2 years. In the paper, we will outline the aims of the project, methodologies and techniques to be developed and some test data.
Remote Sensing (RS) and Geographic Information System (GIS) are powerful technologies for collecting useful information on the damages of disasters in short time. However, since many different types of RS data are available (satellite, aerial, UAV, terrestrial), data co-registration, information integration and feature extraction need reliable and advanced methodologies. In the RAPIDMAP project, we will develop practical ways to integrate RS data processing tools in near-real-time and allow users to use this data soon after the disasters by means of WebGIS tools. This will help not only decision makers but also end-users in the disaster area. The key components of this project are:
(1) Near-real-time monitoring: the procedure of near-real-time monitoring with satellites as well as Unmanned Airborne Vehicles (UAV) will be set up and demonstrated.
(2) Data co-registration: in disasters, various images as well as maps come from different sources. The co-registration of multiple images is a key technology for information integration. In this project, a system to co-register multiple images in near-real-time will be developed.
(3) Data fusion and change detection: one of the advantages of RS is to collect information with multiple sensors. Various methods for fusing optical with active microwave (SAR) sensor data for information extraction and change detection will be developed. (4) Decision Support System (DSS) based on WebGIS technologies: the collected and integrated information has to be easily
accessible and visible by decision makers and end-users in near-real-time and worldwide. By using WebGIS technologies, wireless networks and portable terminals, a DSS will allow easy access, retrieval and visualization of all information (fused data, images, maps, etc.) in very short time after data collection and processing.
The project will be practically tested and demonstrated at the Tohoku area in Japan and another test site, which were recently affected by large disasters.
1. INTRODUCTION
According to the respective WEB site (www. concertjapan.eu), CONCERT-Japan is a EU funded project in the International Cooperation Activities under the Capacities Programme of the EU FP7 for Research and Technology Development. The aim of this project is to promote an effective and coordinated science and technology cooperation between* European countries and
*
Corresponding author.
Japan with a view to further expanding and harmonizing already existing cooperation between them. The core project consortium consists of 13 partners including organizations from European countries and Japan. The project focussed on two topics, one of them „Resilience against Disasters“. The central aim is to protect lives and property from damages, especially large scale ones and in urban areas, by promoting new, effective and holistic approaches. For this topic, 5 projects were selected, among them the RAPIDMAP project presented here. The project started June 1st, 2013, has a duration of 2 years and
This contribution has been peer-reviewed.
involves 5 institutions (see authors’ affiliations). Its WEB site is http://rapidmap.fbk.eu/.
2. THE RAPIDMAP PROJECT
Remote Sensing (RS) and Geographic Information System (GIS) are powerful technologies for collecting, combining, analysing and visualising rapidly useful information on the damages from disasters. However, since many different types of RS data are available, imagery co-registration, information integration and feature extraction need reliable and advanced methodologies. In the RAPIDMAP project, the partners will develop practical ways to integrate RS data tools in near real time and allow users to use those data soon after the disasters by means of WebGIS tools. This will help not only decision makers but also end-users in the disaster area. The four key components of this project are listed in section 3.
3. RESEARCH METHODOLOGY
3.1 Near real-time monitoring using satellite data
Tokai University has its own ground station Tokai University Space Information Center (TSIC) in Kumamoto, Japan (see Figure 1). TSIC has three x-band and three s-band antennas and is one of the most sophisticated and automated ground stations owned by a university. TSIC has been operated since 1986 and is currently receiving data from NPP, Terra, Aqua, NOAA, MTSAT2, Landsat-8 and GCOM-W1. With a fully automated system, TSIC is disseminating MODIS, MTSAT2 and NPP/VIIRS data to end-users in near-real-time. Dissemination of Landsat-8 data is also planned. In winter, the MODIS images are
provided to the Japan Coast Guard (JCG) in near-real-time on daily basis (Cho et. al. 2007, 2012).
Figure 1. Tokai University Space Information Center (TSIC) seen from an aerial view (a). The 2.4m x-band antenna (b).
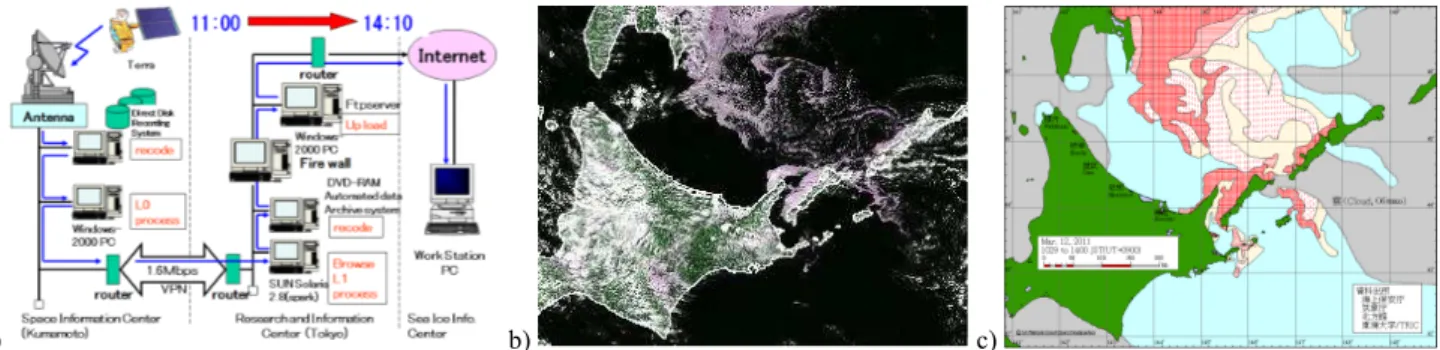
Figure 2 (a) shows the configuration diagram of near-real-time MODIS data distribution system for sea ice monitoring. MODIS data are received at TSIC at around 11:00. The MODIS colour composite images of the Sea of Okhotsk are automatically produced and provided to JCG at around 14:10 via internet. On less cloudy days, JCG produces the Sea Ice Chart mainly using MODIS images (see Figure 2 (b), (c)). Tokai University has a long lasting experience in disaster mapping and analyses based on remote sensing data.
In this project, the procedure of integrating and disseminating various satellite images of disaster areas to the end-users in near-real-time will be demonstrated. The satellite images include those of Terra & Aqua/MODIS, NPP/VIIRS, MTSAT2/Imager, and Landsat-8/OLI&TIRS. Our target is to provide geocoded satellite images to end-users within few hours.
a) b) c)
Figure 2. Configuration diagram of near-real-time MODIS data distribution system for sea ice monitoring (a). MODIS image (b) and sea ice chart produced from MODIS images (c).
3.2 Near-real-time monitoring using UAV data
Nihon University - Faculty of Engineering is located in Fukushima, Japan and is now performing Unmanned Aerial Vehicle (UAV) surveys at the damaged area in Fukushima. Microdrones md4-1000 is an electrically powered and GPS/INS equipped UAV system, which can quietly fly for 40km under certain conditions with its autonomous waypoint navigation. This UAV is a quadrocopter with vertical take-off and landing (VTOL) capability to provide an ideal remote sensing platform for local applications. Figure 3 shows a view of the UAV and Table 1 summarizes its main characteristics. In this project, the procedure for UAV observation and near-real-time data transmission will be developed, as well as the linking of the geo-tagged images to other RS data and maps.
Nihon University has been operating this UAV to capture low altitude aerial images and to monitor radiation dose. Figure 2 shows an example of aerial images taken over the northern part of Lake Inawashiro. Figure 4 (a) shows individual images taken
by the Olympus Pen camera onboard the UAV and Figure 4 (b) shows an orthoimage mosaic created from 15 images.
Figure 3. The Microdrone md4-1000 (www.microdrones.com).
自律飛行・自動航行が可能な小型無人飛行機
md4-1000 は、drone、UAV(Unmanned Aerial
Vehicle)といった略称で呼ばれる、小型無人飛行機です。
撮影、探査、測量、点検や観察
など さまざまな分野で活躍で
きるように設計されています。
md4-1000(以下 drone)は、小型化された垂直離着陸飛行機 (VTOL)の特長を生かして、遠隔操作による自律飛行のみならず、
GPS Waypoint ナビゲーション・システムを用いて、自動航行を することができます。
独自の AAHRS(Attitude,Altitude and Heading Reference System 姿勢・高度・方位制御システム)により、まったくの未経 験パイロットであっても、通常 1 時間ほどのトレーニングで drone の飛行方法を習得することができます。
動力源は、リチウムポリマーバッテリが採用され、独立した4台 のブラシレスモーターがギアを介さず直接プロペラを駆動します。 この構造により、高効率と低騒音を両立しています。(3mの距離 でホバリング時の騒音 68dB)
Platform weight 2.7 kg
Maximum payload 1.2 kg
UAV size 114cm×114cm×50cm
Maximum flight time 70 min Recommended flight height < 300 m
Table 1. Main characteristics of md4-1000.
a) b)
Figure 4. Individual images taken over Lake Inawashiro showing floating plants (a) and the produced orthoimage (b).
3.3 Data co-registration
The focus here is on images, although also other types of data (e.g. maps) will be employed. Images of various sensors need to be analysed in a combined fashion. However, first they must be in the same geometry. This can be achieved by generating a) orthoimages, or b) co-registering the images through a geometric transformation of one image to another or one image to a map. Orthoimage generation requires the use of a Digital
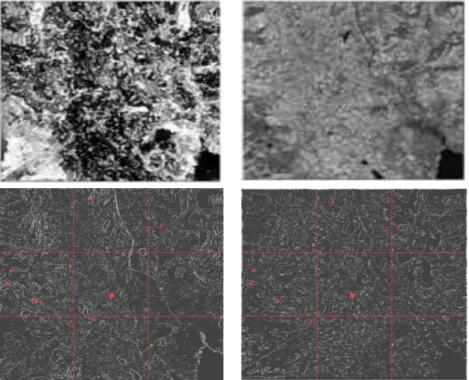
Elevation Model (DEM) and Ground Control Points (GCPs), whereby for modern SAR sensors georeferencing is possible without GCPs. However, after a disaster, the DEM may have changed substantially, while the generation of a new DEM is time consuming or not possible with mono images. Also acquisition of new GCPs, e.g. with GPS, is time consuming or even impossible. Thus, here we will focus on the co-registration. The difficulty is that the images have multi-temporal differences, have different spatial resolution and spectral properties, while the viewing geometry of each sensor is different. Particularly difficult is the co-registration of optical and radar images, where the image formation has geometrically very different properties. The problem becomes greater if we wish to co-register images before and after the disaster, because then the situation may have changed drastically and the images look very dissimilar. In this case, we will try to use stable features that have not changed, exploiting also the fact that images, especially satellite ones, cover a large area. For the co-registration we need to find identical points in all images. This should be done as much as possibly automatically by robust matching, even if the images look very different. Since such matching will produce in any case many errors, an essential part of the work is to develop methods also for detection and elimination of errors. The set of good match points is used to geometrically transform one image to another. In case, the master image is already an orthoimage (such images generally exist, describing the situation before the disaster), then the matched points can be used to derive GCPs based on the planimetric coordinates of the orthoimage and the height from the DEM, used for the orthoimage generation. Preliminary but quite promising work on automated co-registration of optical and SAR images via image matching and matching error detection is published in Soukal and Baltsavias (2012). Some results are shown in Figure 5.
Figure 5. Radarsat-1 (left), Landsat-7/ETM+ (right), top grey level images, bottom thresholded gradient images used for matching to reduce grey level differences with 100 best match points (in red) and best point in 3x3 tiles with none of the 100 best points (in green).
自律飛行・自動航行が可能な小型無人飛行機 md4-1000 は、drone、UAV(Unmanned Aerial Vehicle)といった略称で呼ばれる、小型無人飛行機です。 撮影、探査、測量、点検や観察
など さまざまな分野で活躍で きるように設計されています。
md4-1000(以下 drone)は、小型化された垂直離着陸飛行機 (VTOL)の特長を生かして、遠隔操作による自律飛行のみならず、
GPS Waypoint ナビゲーション・システムを用いて、自動航行を することができます。
独自の AAHRS(Attitude,Altitude and Heading Reference System 姿勢・高度・方位制御システム)により、まったくの未経 験パイロットであっても、通常 1 時間ほどのトレーニングで drone の飛行方法を習得することができます。 動力源は、リチウムポリマーバッテリが採用され、独立した4台 のブラシレスモーターがギアを介さず直接プロペラを駆動します。 この構造により、高効率と低騒音を両立しています。(3mの距離 でホバリング時の騒音 68dB)
また、drone は最大で約 70 分間の飛行が可能です。(環境・設定 等により変化します)
オプションのビデオ・ゴーグルを用いることで、視程を上回って 飛行を行うことができます。
Vehicle)といった略称で呼ばれる、小型無人飛行機です。 撮影、探査、測量、点検や観察
など さまざまな分野で活躍で きるように設計されています。
md4-1000(以下 drone)は、小型化された垂直離着陸飛行機 (VTOL)の特長を生かして、遠隔操作による自律飛行のみならず、
GPS Waypoint ナビゲーション・システムを用いて、自動航行を することができます。
独自の AAHRS(Attitude,Altitude and Heading Reference System 姿勢・高度・方位制御システム)により、まったくの未経 験パイロットであっても、通常 1 時間ほどのトレーニングで drone の飛行方法を習得することができます。 動力源は、リチウムポリマーバッテリが採用され、独立した4台 のブラシレスモーターがギアを介さず直接プロペラを駆動します。 この構造により、高効率と低騒音を両立しています。(3mの距離 でホバリング時の騒音 68dB)
また、drone は最大で約 70 分間の飛行が可能です。(環境・設定 等により変化します)
オプションのビデオ・ゴーグルを用いることで、視程を上回って 飛行を行うことができます。
International Archives of the Photogrammetry, Remote Sensing and Spatial Information Sciences, Volume XL-7/W2, 2013 ISPRS2013-SSG, 11 – 17 November 2013, Antalya, Turkey
This contribution has been peer-reviewed.
3.4 Data fusion and change detection
The fusion part of the project shall cover both the cases of SAR to SAR as well as optical images or GIS data to SAR because these issues are of high relevance for disaster response. The former configuration is useful to facilitate change detection by an operator comparing two images at least for SAR data taken from approximately the same orbital position because differences observed in pre-event and post-event SAR images indicate changes of interest. In this set-up, the image analysis may take place even in slant range geometry and the result would be transformed to real world coordinates.
We want to focus on a task, which is both relevant and promising to be fulfilled by means of SAR, namely the detection of flooded areas. There are two main reasons for this choice. Firstly, flooding is a type of disaster, which occurs quite frequently and may cause tremendous economic damage and, even worse, loss of human lives. Secondly, SAR is well suited for the detection of water surfaces: due to the large wavelength and the side-looking viewing geometry of the active signal such areas appear usually darker than the surrounding ground.
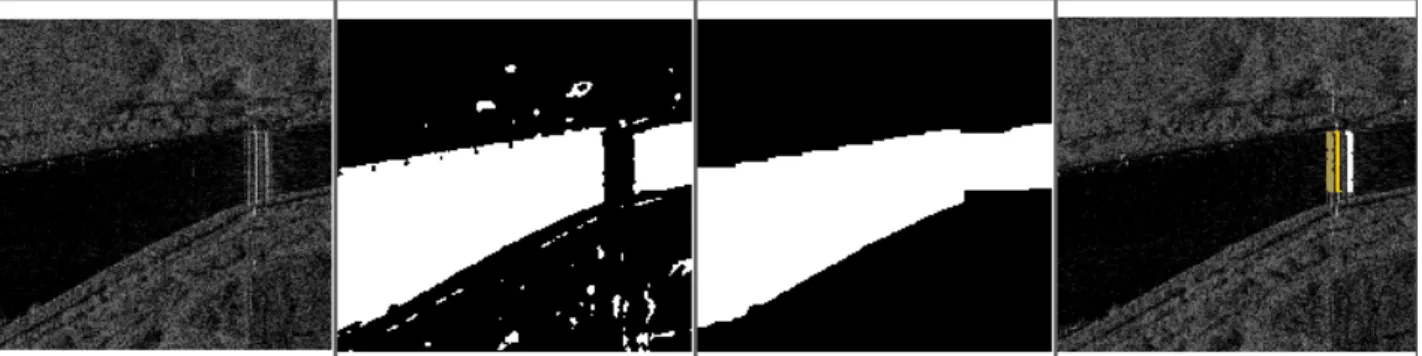
In Figure 6 an example of previous related work of us is shown (Soergel et al., 2006): in high-resolution airborne SAR data an area covered by water (a channel in this case) is detected, as well as a bridge spanning the water body.
As already discussed, in case of satellite data taken from same viewing direction we could detect temporal changes by comparing such segmentation results. However, such preferable image acquisition geometry is not always feasible, instead we often have to deal with multi-aspect and/or multi-sensor imagery. Hence, another focus of the project is on precision co-registration of high-resolution SAR to optical data. Depending on the type of disaster, changes of various kinds are important (e.g. in case of flooding we want to detect areas newly covered by water, whereas for earthquake scenarios the state of buildings and infrastructure is of more interest).
However, the information content we can extract by remote sensing is a function of geometric, temporal, and spectral sampling of available sensors. This means we have to tailor the attainable range of changes aimed to be detected according to the actual needs and the opportunities determined by the available data. If the images are taken from different aspects or involve fusion of optical and SAR data, the demand on the task rises tremendously. We have to cope with different imaging geometries and 3D effects, different spectral properties, viewing angles and spatial resolution, multi-temporal differences etc., and have to combine image space (2D) with 3D processing and fusion in a common coordinate system. Some first investigations on combination of optical and SAR images for building detection are given in Wegner et al. (2011).
Figure 6. From left to right: amplitude SAR image, potential water surfaces (bright areas), morphologic filtering results in better water extraction, and detection of bridge crossing the channel.
3.5 DSS based on WebGIS technologies
All the collected and integrated information will be made easily accessible and visible to decision makers and end-users in near-real-time and worldwide using WebGIS technologies. A GIS can be considered a geo-informatics tool able to merge cartography, statistical and spatial analysis as well as database technologies. A GIS tool allows to capture, store, retrieve, analyse and visualise data, geographically referenced to a map projection in a specific coordinate system and perform spatial analyses using such data. A Web-based GIS allows for GIS functionalities online facilitating the distribution and access of the project results through Web browsers, following a client-server structure. The user performs a query on certain data (spatial or non-spatial) from his client application, running generally within a Web browser, and the results are provided by a remote server to the Web browser. This allows to dynamically and interactively explore data, as well as to combine different data to produce new information (e.g. maps) according to certain criteria given by the user. Such functionalities are the core of a so-called Decision Support Systems (DSS), a suitable way to allow online access to multiple users, manage critical situations and take decisions within a very limited time (Dai et al., 1994; Power, 2002). Decision-making and decision theories are popular research topics in many disciplines from business to social sciences, from military to engineering. In particular, a DSS for rapid mapping
and disaster response management is mandatory to visualize and merge all available observations and data, produce up-to-date maps of the current situation as well as predict future scenarios. A typical natural hazard DSS is characterized by:
1. Continuously changing environment according to the different stage of disaster;
2. Scarcity of information, often inexact or incomplete;
3. Large uncertainty in terms of emergency’s dimensions, damages, requirements, etc.;
4. Delivery of quick response in very short time.
DSSs have a long history (Keen, 1978) and are nowadays very often employed for rapid mapping purposes in case of natural hazards like fires, flooding, earthquakes, etc. (e.g. http://cdss.state.co.us).
4. TEST DATA – TOHOKU AREA, JAPAN
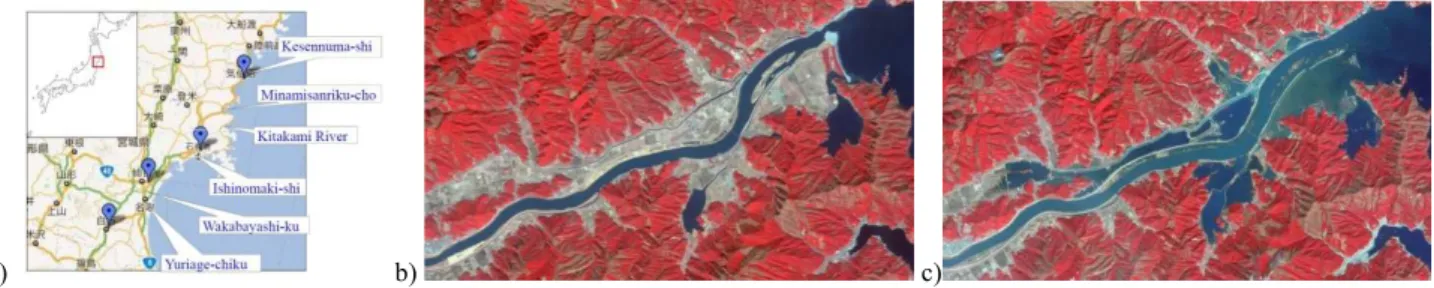
On March 11, 2011, a huge area in the northeast coast of Japan was seriously damaged by a magnitude 9.0 earthquake and a subsequent tsunami. More than 15,000 people died and more than 2,600 people are still missing. At that time, more than 5,000 satellite images were taken within two weeks after the disaster under international cooperation. In this study, the authors have selected Kesennuma-shi, Kitakami River, Ishinomaki-shi,
Wakabayashi-ku, and some other areas as our test site (see Figure 7 (a)). These are all seriously damaged areas in the Miyagi Prefecture. The test satellite data used in this study include, but are not limited to, ALOS/PALSAR-AVNIR-PRISM, FORMOSAT-2/RSI, TerraSAR-X/SAR and Terra & Aqua /MODIS images. The satellite images before and after the
disaster are co-registered and analysed for extracting the damaged areas and evaluating the damages. Figure 7 (b) and (c) show the AVNIR images of Kitakami River before and after the tsunami. Another test site, probably in Europe, will be additionally selected.
a) b) c)
Figure 7. Test sites in Japan (a). ALOS/AVNIR2 false colour images on February 27, 2011 (b) and on March 14, 2011 (c).
5. SUMMARY AND CONCLUSIONS
We shortly presented the project RADIPMAP, its aims, main research topics, including some preliminary work, and some test data to be used. Since the project is in its start, results will be published in the future. The aims are certainly challenging, especially for difficult cases, as the Japanese test site, devastated by the tsunami, but we are confident that we can develop new, useful and to a large extent automated methods for rapid mapping. A major difficulty that has been noticed till now is the usage of free (or very cheap) data (mainly images), although large amounts of such data exist, often paid by taxpayers’ money, and their usage in this project would be purely for research purposes and for a socially very important topic.
ACKNOWLEDGMENTS
We gratefully acknowledge financial support by Concert-Japan and the national institutions of the authors’ countries participating in it.
REFERENCES
Bach, H., Appel, F., Fellah, K., de Fraipont, P., 2005. Application of flood monitoring from satellite for insurances. Proc. of IGARSS, on CD, 4p.
Cho, K., Misono, T., Shimoda, H., 2007. Study on extracting sea ice area from MODIS data for the Okhotsk Sea. Proc. of the 22nd International Symposium on Okhotsk Sea & Sea Ice, The Okhotsk Sea and Ocean Research Association, C-3, pp. 42-45.
Cho, K., Yokotsuka, H., Shimoda, H., Matsumae, Y., 2012. A study on Near-real-time Monitoring with Earth Observation Satellites. Proc. of the School of Information Science and Technology, Tokai University, Series J, pp. 3-10 (in Japanese).
Dai, J., Wang, S., Yang, X., 1994. Computerized support systems for emergency decision making. Annals of Operations Research, 51(7): 313-325.
Keen, P. G. W., 1978. Decision support systems: an organizational perspective. Addison-Wesley Pub., ISBN 0201036673, 264 p.
Power, D. J., 2002. Decision support systems: concepts and resources for managers. Westport, Connecticut, Quorum Books.
Soergel, U., Gross, H., Thiele, A., Thoennessen, U., 2006. Extraction of bridges over water in multi-aspect high-resolution InSAR data. International Archives of The Photogrammetry, Remote Sensing and Spatial Information Sciences, Vol. XXXVI, Part 3, pp. 185-190.
Soukal, P., Baltsavias, E., 2012. Image matching error detection with focus on matching of SAR and optical images. Proc. of ACRS 2012, 26-30 Nov., Pattaya, Thailand, 7 p.
Wegner, J.D., Hänsch, R., Thiele, A., Soergel, U., 2011. Building Detection from one Orthoimage and High-Resolution InSAR Data using Conditional Random Fields. IEEE Journal of Selected Topics in Applied Earth Observations and Remote Sensing, 4(1): 83-91.
This contribution has been peer-reviewed.