www.clim-past.net/12/483/2016/ doi:10.5194/cp-12-483-2016
© Author(s) 2016. CC Attribution 3.0 License.
Climate variability and human impact in South America
during the last 2000 years: synthesis and perspectives
from pollen records
S. G. A. Flantua1, H. Hooghiemstra1, M. Vuille2, H. Behling3, J. F. Carson4, W. D. Gosling1,5, I. Hoyos6, M. P. Ledru7, E. Montoya5, F. Mayle4, A. Maldonado8, V. Rull9, M. S. Tonello10, B. S. Whitney11, and C. González-Arango12
1Institute for Biodiversity and Ecosystem Dynamics (IBED), University of Amsterdam, Science Park 904, 1098 XH Amsterdam, the Netherlands
2Department of Atmospheric and Environmental Sciences, University at Albany, State University of New York, Albany, NY, USA
3Georg August University of Göttingen, Albrecht von Haller Institute for Plant Sciences, Department of Palynology and Climate Dynamics, Untere Karspüle 2, 37073 Göttingen, Germany
4Department of Geography and Environmental Science, University of Reading, Reading, RG6 6AB, UK
5Department of Environment, Earth & Ecosystems, The Open University, Walton Hall, Milton Keynes, MK7 6AA, UK 6Faculty of Engineering, GAIA, Institute of Physics Group Fundamentos y Enseñanza de la Física y los Sistemas Dinámicos, Universidad de Antioquia, Medellin, Colombia
7Institut des Sciences de l’Evolution de Montpellier (ISEM) UM2 CNRS IRD EPHE, Place Eugène Bataillon, Cc 061, 34095 Montpellier CEDEX, France
8Centro de Estudios Avanzados en Zonas Áridas (CEAZA), Universidad de La Serena. Av Raúl Bitrán 1305, La Serena, Chile 9Institute of Earth Sciences “Jaume Almera” (ICTJA-CSIC), C. Lluís Solé Sabarís s/n, 08028 Barcelona, Spain
10Instituto de Investigaciones Marinas y Costeras CONICET, Universidad Nacional de Mar del Plata, Mar del Plata, Argentina
11Department of Geography, Ellison Place, Northumbria University, Newcastle upon Tyne, NE1 8ST, UK 12Departamento de Ciencias Biológicas, Universidad los Andes, A.A. 4976 Bogotá, Colombia
Correspondence to:S. G. A. Flantua ([email protected]) and H. Hooghiemstra ([email protected])
Received: 31 May 2015 – Published in Clim. Past Discuss.: 29 July 2015
Revised: 17 December 2015 – Accepted: 4 January 2016 – Published: 29 February 2016
Abstract. An improved understanding of present-day cli-mate variability and change relies on high-quality data sets from the past 2 millennia. Global efforts to model regional climate modes are in the process of being validated against, and integrated with, records of past vegetation change. For South America, however, the full potential of vegetation records for evaluating and improving climate models has hitherto not been sufficiently acknowledged due to an ab-sence of information on the spatial and temporal coverage of study sites. This paper therefore serves as a guide to high-quality pollen records that capture environmental variability during the last 2 millennia. We identify 60 vegetation (pollen) records from across South America which satisfy
tinguishing natural from anthropogenically driven vegetation change. We stress the need for the palynological community to be more familiar with climate variability patterns to cor-rectly attribute the potential causes of observed vegetation dynamics. This manuscript forms part of the wider LOng-Term multi-proxy climate REconstructions and Dynamics in South America – 2k initiative that provides the ideal frame-work for the integration of the various palaeoclimatic subdis-ciplines and palaeo-science, thereby jump-starting and fos-tering multidisciplinary research into environmental change on centennial and millennial timescales.
1 Introduction
Accurately simulating the complexity of Earth’s climate sys-tem is still a major challenge for even the most advanced Earth system models. One major obstacle for evaluating model performance in historical runs is the lack of long and reliable climate records from some regions of the Earth. Given the scarcity of instrumental records in many regions, alternative, proxy-based climate reconstructions therefore provide an excellent data set against which to test models and their ability to accurately simulate longer-term features of climate change. Proxy data sets from sedimentary records (in particular pollen, charcoal, and tephra from lake sedi-ments and peat bogs) have been particularly underutilized in this regard.
Increasingly studies have demonstrated the integration of multiple proxies (Li et al., 2010) in climate reconstructions, with a special focus on the last 2 millennia. This period could be considered a baseline to current conditions, as climate has been very similar to the present. This integration is still in its infancy in South America (SA), especially in the tropics. Since 2009, regional climate reconstructions from SA have gained momentum from compilations of multiple data sets and from fine-tuning of model reconstruction methods (Vil-lalba et al., 2009). However, an improved understanding of the spatial distribution of proxy data sets has been identified as necessary to make further progress (Villalba et al., 2009; Flantua et al., 2015). Tree ring studies constitute a widely dis-tributed and frequently used high-resolution climate archive that has fortunately recently expanded its spatial coverage (Boninsegna et al., 2009; Villalba et al., 2009). However, the tree ring records are limited compared to the spatial and tem-poral coverage provided by records obtained from sedimen-tary archives (e.g. pollen records). The newly updated inven-tory of palynological research in SA documents the extensive spatial and temporal coverage of pollen-based research avail-able throughout the continent (Flantua et al., 2015). How-ever, to integrate records from different sedimentary archives across SA, a standard chronological framework is required. To this end an alternative recalibrated age model and eval-uation of chronologies have been undertaken to facilitate
2016). However, multi-proxy climate reconstructions from the last 2 kyr have hitherto been focused mainly on southern SA (PAGES-2k Consortium, 2013), omitting input from the northern two thirds of the continent. Furthermore, palynolog-ical research has been underrepresented in most reconstruc-tions of climate variability (Villalba et al., 2009; Neukom et al., 2010; Neukom and Gergis, 2012). The lack of an ade-quate overview of available pollen records from the conti-nent has been an impediment to the advancement of its use and inclusion in climate studies.
As a result, we identified the need to review and discuss pollen records in SA that can fulfil requirements for inclusion in 2 ka palaeoclimate reconstructions, within the framework of LOng-Term multi-proxy climate REconstructions and Dy-namics in South America (LOTRED-SA, this Special Issue) and the PAGES-2k Network (http://www.pages-igbp.org/ini/ wg/2k-network/intro). This paper is structured following an assessment for individual regions in SA within the context of current climate modes. These modes are characterized by their precipitation and temperature fingerprint over SA and used as a baseline framework to identify past climatic changes from pollen records. Certain zones are more prone to particular climate signals; therefore, comparison between the spatial expression of climate modes and highly correlated records from different regions strengthens the interpretation of palaeoecological findings. To use pollen as a palaeocli-mate proxy, the degree of human impact on the vegetation needs to be considered as being minimal or absent over the last 2 kyr. Therefore, drivers of vegetation change, both nat-ural and anthropogenic, are discussed within the different re-gions to describe the general settings required for palaeoe-cological research in the last millennia. Records that identify significant human impact are identified and excluded from the proposed data set for PAGES-2k when the climate sig-nal is lost but are considered useful within the regiosig-nal pur-poses of LOTRED-SA (this Special Issue). We provide a qualitative translation from pollen metrics to climate vari-ables based on expert knowledge. We finish by discussing the potential of including pollen-inferred climate information in 2 ka climate model validation and emphasize the importance of multi-proxy working groups such as LOTRED-SA.
2 Climate settings
2.1 Continental overview climate zones and modes
spatial influence of climate modes is assessed by document-ing their role in drivdocument-ing interannual precipitation and temper-ature variability.
Continental SA extends from the tropics (12◦N) to
midlat-itudes (55◦S). Three major noticeable climate zones can be
distinguished: tropical, subtropical, and extratropical SA. At-mospheric circulation and climate in all three zones is highly modulated and constrained by the orography of the Andes, the shape of the continent, and interactions with the underly-ing land surface, vegetation, and soil moisture; furthermore, ocean currents, such as the cold Humboldt Current affecting coastal climate along the South American west coast, also affect climate (Wang and Fu, 2002; Li and Fu, 2006).
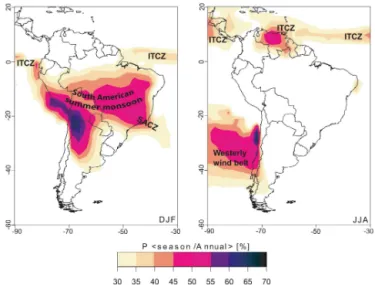
The climate of tropical SA is dominated by the seasonal migration of the Intertropical Convergence Zone (ITCZ) over the Atlantic and Pacific, and the seasonal development of convective activity associated with the South American sum-mer monsoon (SASM) over the interior of the continent (Fig. 1). The seasonal migration of the ITCZ primarily af-fects coastal areas and northernmost SA as it is character-ized by a fairly well-constrained narrow band of low-level wind convergence over the equatorial oceans. The SASM is a seasonal phenomenon that develops between September and April and primarily affects the SA tropics and subtropics south of the Equator (Garreaud et al., 2009). During the aus-tral spring (September to November, SON) moisture influx from the ITCZ contributes to the development of this mon-soon system (Zhou and Lau, 2001; Vuille et al., 2012). This monsoonal system reaches its mature phase (maximum de-velopment) during December to February (DJF) and is char-acterized by heavy rainfall advancing southward from tropi-cal to subtropitropi-cal latitudes. To the east of the tropitropi-cal Andes a strong low-level wind, the Andean low-level jet (ALLJ), transports moisture in a southeasterly direction from the trop-ics to the subtropical plains (Cheng et al., 2013), feeding the South Atlantic convergence zone (SACZ), extending from the southeastern (SE) Amazon basin toward the southeast out over the South (S) Atlantic. The extratropical region is char-acterized by a quasi-permanent westerly circulation embed-ded in between the subtropical anticyclones located over the subtropical Pacific and Atlantic to the north and the circum-polar trough of low pressure to the south. Frequent north-ward propagation of extratropical cold air incursions east of the Andes provide for continued atmospheric interaction and heat exchange between mid- and low latitudes over the sub-tropical continent. The latitudinal extension of the westerlies over land displays limited variations across the year and cov-ers southern and central (C) Argentina and Chile. Additional information is presented in the Supplement.
Both precipitation and temperature exhibit significant vari-ability on interannual to interdecadal timescales in all three climate zones of SA (e.g. Garreaud et al., 2009). This vari-ability is mainly caused by ocean–atmosphere interactions (Vuille and Garreaud, 2012) that lead to a reorganization of the large-scale circulation over SA and the neighbouring
Figure 1. Map showing the relative precipitation amount over
South America during the key seasons DJF (austral summer and mature monsoon phase) and JJA (dry season over much of tropical South America), highlighting the Intertropical Convergence Zone (ITCZ), South American summer monsoon, South Atlantic conver-gence zone (SACZ), and extratropical westerlies. Figure based on CPC Merged Analysis Precipitation (CMAP) data. Adapted from Vuille et al. (2012).
oceans. To quantify the influence and relative importance of these ocean–atmosphere coupled modes on the interannual precipitation and temperature variability over SA, spatial cor-relation and regression coefficients are calculated.
Gridded precipitation and temperature data were derived from the UDelaware data set V2.01 (Legates and Willmott, 1990) at 0.5◦resolution. We limit our assessment to the
six most relevant climate modes (Table 1). Other modes analysed were either largely redundant or showed a much weaker influence over the SA continent. The resulting corre-lation maps indicate the correcorre-lation coefficient on interannual timescales between the mode in question and the local tem-perature and precipitation at each grid cell. Conversely, the regression maps indicate the local anomaly (in physical units of millimetres or degrees Celsius) at each location that cor-responds to a unit (1 standard deviation) anomaly in the cli-mate mode. The Southern Annular Mode (SAM) and all three Atlantic modes (Atlantic Multidecadal Oscillation – AMO; tropical North and South Atlantic sea surface temperature – TSA and TNA; Table 1) were detrended prior to analysis to ensure that correlation and regression coefficients account for co-variability on interannual timescales only and do not re-sult from spurious common trends. More information on the methodology can be found in the Supplement.
In all correlation maps (Figs. 2 and 4) we show corre-lations in excess of ±0.2 only, which approximately
Sea Surface Temperature; EOF: empirical orthogonal function; NOAA OI: National Oceanic and Atmospheric Administration Optimum Interpolation.
Abbreviation Mode Methods Description Reference
Niño 3.4 Niño3.4 index SST averaged over 5◦N–5◦S, 170–
120◦W calculated from HadISST data
Describes interannual (2–7 yr) variability of tropical
Pacific SST
Rayner et al. (2003)
AMO Atlantic
Multidecadal Oscillation
Defined as the area-averaged SST in the Atlantic north of the Equator, calculated from Kaplan SST V2
Describes coherent variations in North Atlantic SST on mul-tidecadal (50–70 yr) timescales
Enfield et al. (2001)
IPO Interdecadal
Pacific Oscillation
Multidecadal Pacific-wide mode of SST variability, calculated as the sec-ond EOF of low-frequency filtered HadISST data
Describes joint variations in Pacific SST in both
hemispheres on multidecadal (20–30 yr) timescales
Folland et al. (2002)
SAM Southern
Annular Mode or Antarctic Oscillation
Calculated as leading principal component (PC) of 850 hPa geopoten-tial height anomalies south of 20◦S
Determines strength and loca-tion of circumpolar vortex (location of the extratropical westerly storm tracks)
Thompson and Wallace (2000)
TNA Tropical North
Atlantic SST
Defined as SST averaged over 5.5– 23.5◦N, 15–57.5◦W and calculated
from HadISST and NOAA OI 1×1
data sets
Describes interannual variabil-ity of SST variations in the tropical North Atlantic
Enfield et al. (1999)
TSA Tropical South
Atlantic SST
Defined as SST averaged over 0–20◦S,
10◦E–30◦W (TSA), calculated from
HadISST and NOAA OI 1×1 data sets
Describes interannual variabil-ity of SST variations in the tropical South Atlantic
Enfield et al. (1999)
us whether a certain temperature or precipitation anomaly in the regression map is statistically significant. In our discus-sion we focus primarily on the impact of the positive phase from each of these modes, as these are the fingerprints pre-sented in Figs. 2–5. Since this is a linear analysis, the nega-tive phase of these modes would lead to the same changes in temperature and precipitation but with the sign reversed. In general these outcomes are consistent with earlier analyses reported by Garreaud et al. (2009). However, some differ-ences are apparent and most likely related to different time periods analysed, our choice of using the hydrologic year as opposed to the calendar year, and different definitions of the indices used (see the Supplement for more details). For ex-ample, Garreaud et al. (2009) used the Multivariate El Niño– Southern Oscillation (ENSO) index, while here we focus on the Niño3.4 index to describe ENSO variability. Similarly, Garreaud et al. (2009) used the Pacific Decadal Oscillation index to describe Pacific interdecadal variability, while here we use the Interdecadal Pacific Oscillation (IPO).
2.2 Temperature
The largest and most significant influence on interannual temperature variability in SA is exerted by ENSO, with above average temperatures during El Niño and reduced tem-perature during La Niña (Figs. 2 and 3). A 1 standard
de-viation departure in the Niño3.4 index is associated with a change in temperature of up to 0.8◦C along the Pacific
coast of SA. In the Andes of Colombia, the correlation be-tween temperature and the Niño3.4 index is > 0.8, indicating that more than two thirds of the temperature variability on interannual scales can be explained by ENSO. The largest increase in temperature is observed during austral summer (DJF, not shown), linked to the peak phase of ENSO, which tends to occur at the end of the calendar year.
Compared to ENSO, the IPO has a similar, albeit slightly weaker, fingerprint over SA, which is not surprising given that the Pacific decadal and multidecadal variability is often described as “ENSO-like” (e.g. Garreaud and Battisti, 1999). The IPO impact extends further south along the west coast of SA than ENSO, however, with a somewhat stronger influ-ence on temperature in northern (N) to C Chile. It is note-worthy that the IPO impact over SA is almost identical to the influence of the Pacific Decadal Oscillation as described in Garreaud et al. (2009).
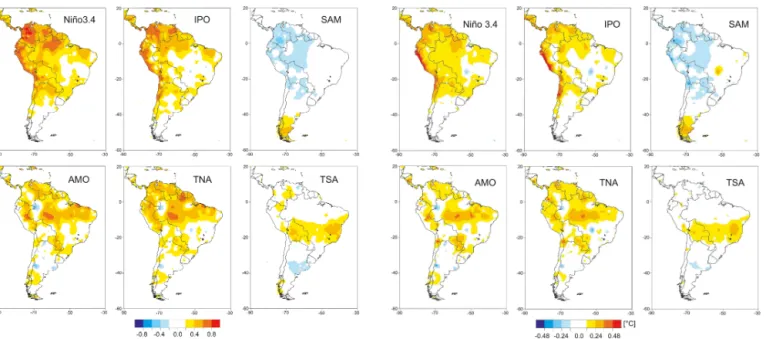
Figure 2. Correlation of annual mean temperature over South
America with climate modes Niño3.4, IPO (Interdecadal Pacific Os-cillation), SAM (Southern Annular Mode), AMO (Atlantic Multi-decadal Oscillation), TNA (tropical North Atlantic SST), and TSA (tropical South Atlantic SST). High positive values of the correla-tion coefficient indicate both increasing and decreasing values of the mode in question and the local temperature at each grid cell. High negative values indicate that the increasing (decreasing) mode in question causes a significant decrease (increase) in temperature at the grid cell. Gridded temperature fields are from the University of Delaware (1958–2008). Only correlations in excess of±0.2 are shown (roughly the threshold of the 95 % significance level).
associated with ENSO. The region of largest warming is co-located with an area of strong precipitation reduction during the warm phase of the TNA and the AMO (Figs. 4 and 5). This suggests that much of the warming is caused by cloud cover and soil moisture feedbacks associated with reductions in precipitation (reduced cloud cover leading to enhanced so-lar radiation and reduced soil moisture limiting evaporative cooling).
The S Atlantic counterpart, the TSA, is associated with a temperature dipole over subtropical SA, characterized by warming along a zonal band extending from the S–C Brazil-ian coast westward to Bolivia, while C Argentina contempo-raneously experiences cooling (Figs. 2 and 3). The warming in the subtropical region coincides with a region of reduced precipitation during the TSA positive phase (Fig. 4), suggest-ing that the warmsuggest-ing is at least in part caused by changes in the hydrological cycle (cloud cover and/or soil moisture feedbacks).
The SAM is positively correlated with temperature over Patagonia (Fig. 2) and also shows a weak negative temper-ature departure over western tropical SA during its positive phase (Fig. 3). The warming over Patagonia is strongest dur-ing austral summer (Garreaud et al., 2009; not shown) and
Figure 3.Annual mean temperature regressed upon Niño3.4, IPO (Interdecadal Pacific Oscillation), SAM (Southern Annular Mode), AMO (Atlantic Multidecadal Oscillation), TNA (tropical North At-lantic SST), and TSA (tropical South AtAt-lantic SST). High positive values of the regression coefficient indicate that positive (negative) temperature anomalies occur during the positive (negative) phase of the mode in question. High negative values indicate that the pos-itive (negative) phase of a mode leads to a decrease (increase) in temperature at the grid cell. Gridded temperature fields are from the University of Delaware (1958–2008).
results from enhanced heat advection, combined with higher solar radiation receipts due to cloud-free conditions (Gupta and England, 2006).
2.3 Precipitation
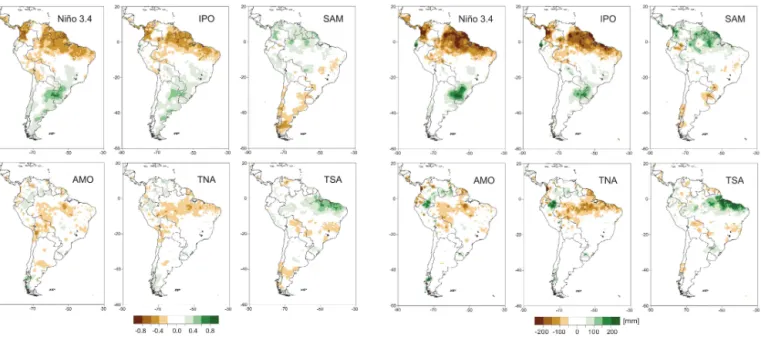
Figure 4.Precipitation correlation with modes Niño3.4, IPO (Inter-decadal Pacific Oscillation), SAM (Southern Annular Mode), AMO (Atlantic Multidecadal Oscillation), TNA (tropical North Atlantic SST), and TSA (tropical South Atlantic SST). High positive values of the correlation coefficient indicate both increasing and decreas-ing values of the mode in question and the local precipitation at each grid cell. High negative values indicate that the increasing (de-creasing) mode in question causes a significant decrease (increase) in precipitation at the grid cell.
in precipitation during El Niño is along the Pacific coast of Ecuador and northern Peru, where flooding is a common oc-currence during these events (e.g. Takahashi, 2004). During La Niña events these precipitation anomalies are essentially reversed. The correlations are weaker in our annual analysis over some regions where the ENSO influence is highly sea-sonal, such as the precipitation reduction over the C Andean “Altiplano” (high plain) region in DJF (Vuille et al., 2000) or the enhanced precipitation during El Niño in C Chile in June to August (JJA; Montecinos and Aceituno, 2003).
The largest change in the IPO in the period analysed is related to the Pacific climate shift of 1976–1977, when the tropical Pacific switched from its cold to its warm phase. Since El Niño events also became more frequent and stronger over this period (including the two extreme events of 1982– 1983 and 1997–1998), it is no surprise that the observed changes in precipitation associated with the IPO are simi-lar to the ENSO footprint, albeit somewhat weaker. Indeed the low-frequency modulation by the IPO may strengthen El Niño events during its positive phase and weaken La Niña events, while the opposite is the case during the IPO neg-ative phase, a phenomenon known as “constructive inter-ference” (e.g. Andreoli and Kayano, 2005). Espinoza Vil-lar et al. (2009) documented the influence of Pacific inter-decadal variability on precipitation over the Amazon basin
Figure 5.Precipitation regression with modes Niño3.4, IPO
(Inter-decadal Pacific Oscillation), SAM (Southern Annular Mode), AMO (Atlantic Multidecadal Oscillation), TNA (tropical North Atlantic SST), and TSA (tropical South Atlantic SST). High positive values of the regression coefficient indicate that positive (negative) precip-itation anomalies occur during the positive (negative) phase of the mode in question. High negative values indicate that the positive (negative) phase of a mode leads to a decrease (increase) in precip-itation at the grid cell.
and showed that its positive phase is related to a decrease in precipitation over the basin since 1975, consistent with our results.
Precipitation is reduced in the southernmost part of SA during the positive phase of the SAM (Fig. 4). This reduc-tion extends north into the subtropics along both the At-lantic and Pacific coast to approximately 30◦S (Silvestri and
Vera, 2003; Gillett et al., 2006). Most of this precipitation reduction is associated with reduced westerly moisture flux and moisture convergence from the Pacific (Garreaud et al., 2013). The correlation (Fig. 4) and regression (Fig. 5) maps also suggest a significant influence of the SAM on precipita-tion in parts of the tropics. This signal, however, is not well documented and its physical mechanism is unclear. It may to some extent be related to teleconnections and an anticor-relation between ENSO and the SAM (e.g. Carvalho et al., 2005), which is supported by the fact that the Niño3.4 index and the SAM correlation maps are almost mirror images of one another (Fig. 4).
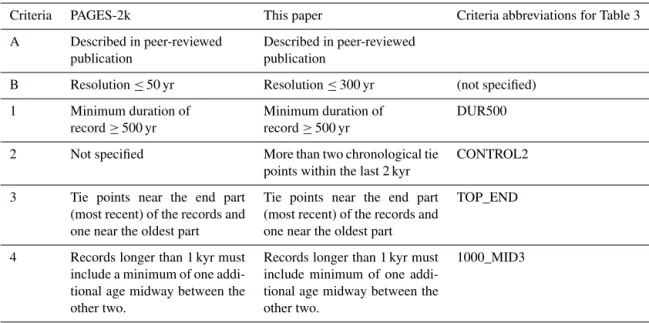
as-Table 2.Comparison of PAGES-2k criteria with criteria implemented in this study.
Criteria PAGES-2k This paper Criteria abbreviations for Table 3
A Described in peer-reviewed
publication
Described in peer-reviewed publication
B Resolution≤50 yr Resolution≤300 yr (not specified)
1 Minimum duration of
record≥500 yr
Minimum duration of record≥500 yr
DUR500
2 Not specified More than two chronological tie
points within the last 2 kyr
CONTROL2
3 Tie points near the end part
(most recent) of the records and one near the oldest part
Tie points near the end part (most recent) of the records and one near the oldest part
TOP_END
4 Records longer than 1 kyr must
include a minimum of one addi-tional age midway between the other two.
Records longer than 1 kyr must include minimum of one addi-tional age midway between the other two.
1000_MID3
sociated with the northward displacement of convective ac-tivity in the ITCZ region due to warmer SST in the tropi-cal North Atlantic and Caribbean during the positive phase of the TNA (and to a lesser extent also the AMO). This directly affects precipitation amounts over NE Brazil (e.g. Hastenrath and Greischar, 1993; Nobre and Shukla, 1996), while the northward shift in the core region of convection also leads to anomalous subsidence, located over the Ama-zon basin. In fact the recent droughts in 2005 and 2010 in the Amazon basin were both associated with such anomalously warm SST in the tropical N Atlantic (Marengo et al., 2008; Lewis et al., 2011). The only region where precipitation is enhanced is in the northwestern part of the Amazon, belong-ing to Venezuela, Colombia, and Peru (Fig. 4).
An anomalously warm tropical S Atlantic (positive phase of the TSA) leads to the exact opposite conditions, with the ITCZ displaced anomalously far south, causing copious rain-fall over NE Brazil, with weaker positive anomalies extend-ing inland as far as the Peruvian border (Fig. 5). Another region of enhanced precipitation is located in S Brazil, asso-ciated with a southerly movement of the SACZ (Fig. 1; e.g. Doyle and Barros, 2002).
3 Selection of pollen records for 2 ka
Within the working groups of PAGES, the “2k Network” was initially established in 2008 to improve current understand-ing of temperature variability across the Earth durunderstand-ing the last 2 kyr. To collate records across the Earth for this time period systematically a set of criteria that defined the suitability of individual records was required. The principle of the crite-ria was to ensure, as far as possible, consistency (and there-fore comparability) in the chronological control and
sam-pling resolution of fossil pollen records (Table 2). Of the six PAGES-2k criteria within this paper, we regarded crite-rion A (peer-reviewed publication) as the base line critecrite-rion (all sites considered are from peer-reviewed studies). How-ever, implementation of criterion B (resolution≤50 years)
was not possible for SA because such a criterion would leave only a handful of pollen records to discuss. The sparsity of samples that meet the stringent PAGES-2k resolution cri-terion occurs because sedimentary archives with long time spans (> 10 000 yr) are typically sampled at coarser temporal resolution. Furthermore, many lowland sites have slow sed-imentation rates, which preclude high-resolution sampling. Therefore, we propose a more flexible temporal resolution, depending on the identified relevance of the case study.
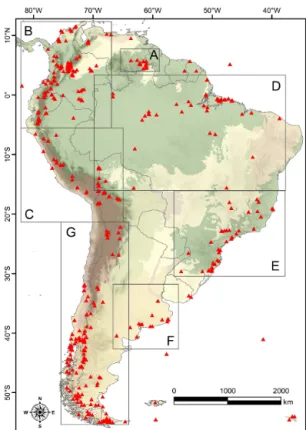
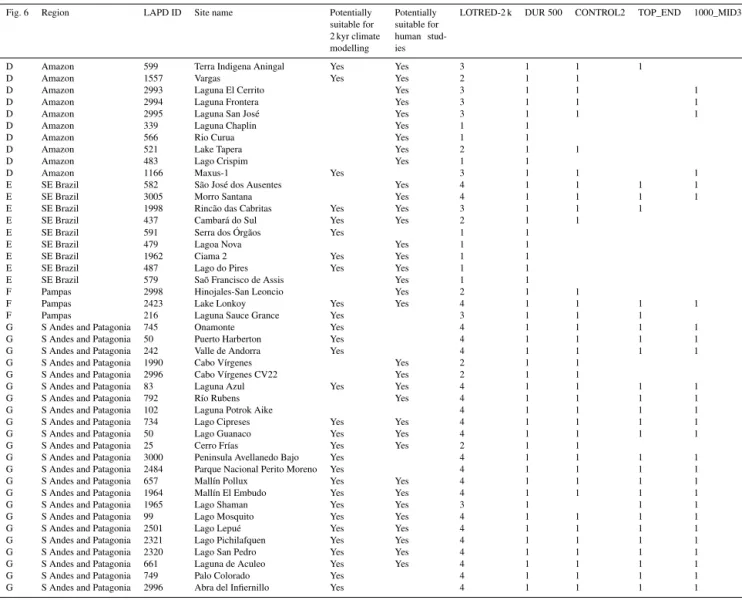
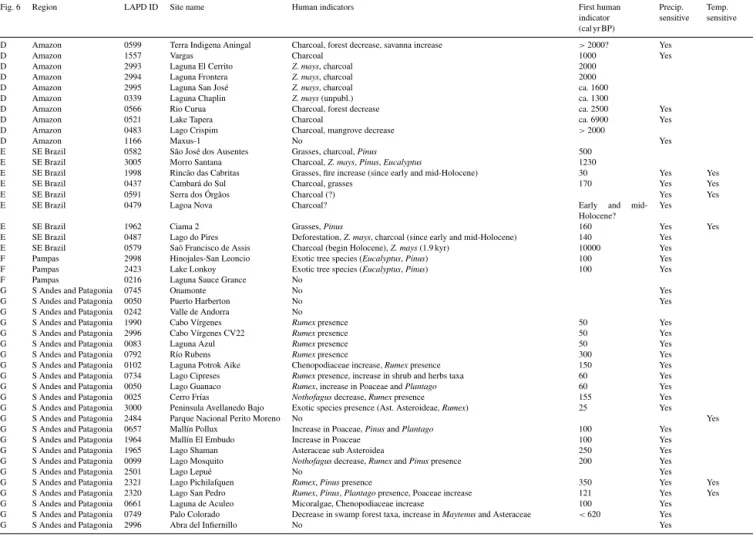
Figure 6.Map showing the location of LAPD pollen records that
cover the last 2 kyr (after Flantua et al., 2015). General regional delimitations as discussed in this paper are shown; A: Venezuelan Guayana highlands and uplands; B: Northern Andes; C: Central An-des; D: lowland Amazon basin; E: southern and southeastern Brazil; F: pampean plain; G: Southern Andes and Patagonia.
4 Results
4.1 Regional assessments
Pollen records are discussed according to their regional and geographical settings (Fig. 6): A – Venezuelan Guayana highlands and uplands (for the purposes of this study, we have defined this region as “Guayana” (different from “Guiana”) following Huber’s criteria (1995a,b) in the ref-erence botanical guide to the “Flora of the Venezuelan Guayana”); B – Northern Andes; C – Central Andes; D – lowland Amazon basin; E – southern and southeastern Brazil; F – pampean plain; G – Southern Andes and Patago-nia. The references to all records discussed are presented in Table 3.
4.2 Climate–vegetation interaction in the Venezuelan Guayana highlands and uplands
The study area, also known as the Gran Sabana (GS), is located in SE Venezuela between the Orinoco and Ama-zon basins (Fig. 6 Box A; Huber and Febres, 2000). Hu-ber (1995a) recognized three main elevational levels on the Venezuelan Guayana: lowlands (0–500 m above sea
(1500–3000 m a.s.l.). Lowlands are absent in the GS, which is mainly characterized by a continuous upland peneplain spiked with isolated highlands (table mountains, “tepuis”). The GS highlands are part of the so-called Pantepui phy-togeographical province, which is characterized by unique biodiversity and endemism patterns, encompassing all the tepui summits above 1500 m a.s.l. (Huber, 1994; Berry et al., 1995). The tepuian vegetation is characterized by a mosaic of bare rock, pioneer vegetation, tepuian forests, herbaceous formations, and shrublands (Huber, 1995b). Additional back-ground information is provided in the Supplement.
In the GS, 22 pollen records cover the last 2 kyr. There are four records with a chronology based on one control point and an additional 10 records for which most, or all, control points are older than 2 ka. Three potentially suitable records originate from the highlands – Eruoda PATAM6-A07, Churí Chim-2 and Apakará PATAM9-A07 – and only one is found in the uplands: Laguna Encantada PATAM4-D07 peatland (Fig. 7a; Table 3). Of the three records of the highlands, just Eruoda provides sufficiently high resolution to explore the objectives proposed here. However, only Churí Chim-2 and Apakará contain several age control points within the last 2 kyr, and Laguna Encantada presents a relatively low sam-pling resolution of 200 to 300 yr.
The criteria for chronological control excluded some of the most relevant work for the research questions posed by this paper. For example, the vegetation at the Eruoda sum-mit has persisted unchanged during the last∼2.5 kyr. This
constancy can be extended to all the tepuian summits stud-ied so far for the last 6 kyr (except Churí). Equally of high importance is the Urué record in the uplands, which does not meet the dating control constraints, but the sampling reso-lution is high enough to provide important insights into the vegetation–climate dynamics during the last 2 kyr, and will be therefore be presented here.
The Eruoda summit represents an important reference to which almost all the tepuian summit vegetation dynamics can be compared (Fig. 7b). Based on the absence of hu-man activities in these summits, it can be assumed that the vegetation dynamics observed in the fossil records are fully climate driven and therefore valuable for LOTRED-SA. In general, these summits are insensitive to temperature change (for 2 ka), whereas moisture variations potentially may cause small internal reorganizations of plant associations although these shifts are considered to be of minor ecological signifi-cance. Shifting river courses are considered to influence local vegetation patterns through the lateral movement of gallery forests in landscapes (Rull, 2005a, b).
The Urué sequence spans the last 1.6 kyr and records the vegetation dynamics after an important fire event dated
∼1.6–1.8 ka. Three main vegetation stages were reported
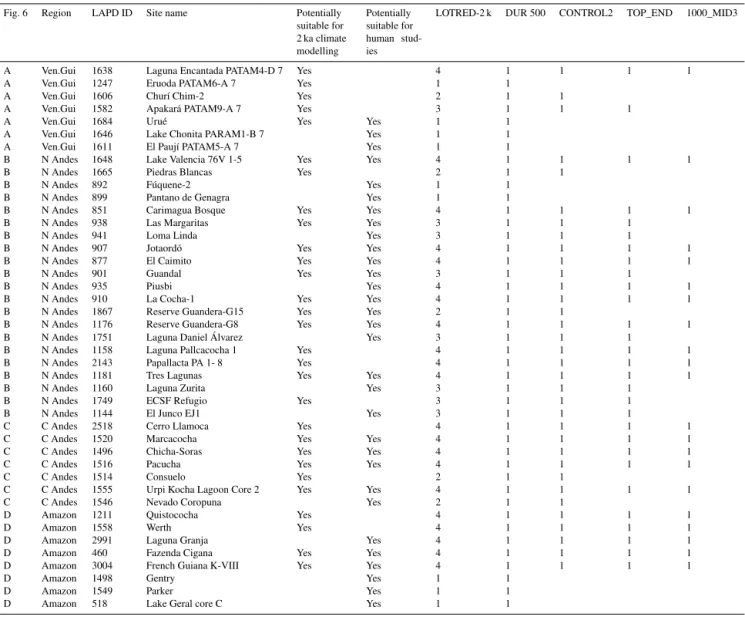
associa-Table 3.List of pollen records used and metadata.
Fig. 6 Region LAPD ID Site name Potentially suitable for 2 ka climate modelling
Potentially suitable for human stud-ies
LOTRED-2 k DUR 500 CONTROL2 TOP_END 1000_MID3
A Ven.Gui 1638 Laguna Encantada PATAM4-D 7 Yes 4 1 1 1 1
A Ven.Gui 1247 Eruoda PATAM6-A 7 Yes 1 1
A Ven.Gui 1606 Churí Chim-2 Yes 2 1 1
A Ven.Gui 1582 Apakará PATAM9-A 7 Yes 3 1 1 1
A Ven.Gui 1684 Urué Yes Yes 1 1
A Ven.Gui 1646 Lake Chonita PARAM1-B 7 Yes 1 1
A Ven.Gui 1611 El Paují PATAM5-A 7 Yes 1 1
B N Andes 1648 Lake Valencia 76V 1-5 Yes Yes 4 1 1 1 1
B N Andes 1665 Piedras Blancas Yes 2 1 1
B N Andes 892 Fúquene-2 Yes 1 1
B N Andes 899 Pantano de Genagra Yes 1 1
B N Andes 851 Carimagua Bosque Yes Yes 4 1 1 1 1
B N Andes 938 Las Margaritas Yes Yes 3 1 1 1
B N Andes 941 Loma Linda Yes 3 1 1 1
B N Andes 907 Jotaordó Yes Yes 4 1 1 1 1
B N Andes 877 El Caimito Yes Yes 4 1 1 1 1
B N Andes 901 Guandal Yes Yes 3 1 1 1
B N Andes 935 Piusbi Yes 4 1 1 1 1
B N Andes 910 La Cocha-1 Yes Yes 4 1 1 1 1
B N Andes 1867 Reserve Guandera-G15 Yes Yes 2 1 1
B N Andes 1176 Reserve Guandera-G8 Yes Yes 4 1 1 1 1
B N Andes 1751 Laguna Daniel Álvarez Yes 3 1 1 1
B N Andes 1158 Laguna Pallcacocha 1 Yes 4 1 1 1 1
B N Andes 2143 Papallacta PA 1- 8 Yes 4 1 1 1 1
B N Andes 1181 Tres Lagunas Yes Yes 4 1 1 1 1
B N Andes 1160 Laguna Zurita Yes 3 1 1 1
B N Andes 1749 ECSF Refugio Yes 3 1 1 1
B N Andes 1144 El Junco EJ1 Yes 3 1 1 1
C C Andes 2518 Cerro Llamoca Yes 4 1 1 1 1
C C Andes 1520 Marcacocha Yes Yes 4 1 1 1 1
C C Andes 1496 Chicha-Soras Yes Yes 4 1 1 1 1
C C Andes 1516 Pacucha Yes Yes 4 1 1 1 1
C C Andes 1514 Consuelo Yes 2 1 1
C C Andes 1555 Urpi Kocha Lagoon Core 2 Yes Yes 4 1 1 1 1
C C Andes 1546 Nevado Coropuna Yes 2 1 1
D Amazon 1211 Quistococha Yes 4 1 1 1 1
D Amazon 1558 Werth Yes 4 1 1 1 1
D Amazon 2991 Laguna Granja Yes 4 1 1 1 1
D Amazon 460 Fazenda Cigana Yes Yes 4 1 1 1 1
D Amazon 3004 French Guiana K-VIII Yes Yes 4 1 1 1 1
D Amazon 1498 Gentry Yes 1 1
D Amazon 1549 Parker Yes 1 1
D Amazon 518 Lake Geral core C Yes 1 1
tions transitional to savanna. Savannas were fully established around 0.9 ka, coinciding with the beginning of a phase of lower charcoal values, and continued as the dominant plant association until the present day. Savannas were accom-panied by Mauritia flexuosapalm swamps (“morichales”), which established a phase that was likely more humid. These palm swamps varied greatly in extent through time, showing a parallel between the lowest palm abundance and the occur-rence of two drought intervals. These two drought intervals were centred on 0.65–0.55 and 0.15–0.05 ka, coeval with the Little Ice Age (LIA) signal observed in the Venezuelan An-des (Rull et al., 1987; Rull and Schubert, 1989; Polissar et al., 2006). Generally, the vegetation dynamics recorded so far in the Venezuelan Guayana uplands have shown a higher sen-sitivity to changes in the available moisture than to potential shifts in the average temperatures. The last 2 kyr have been mainly characterized by vegetation change on a local scale.
4.3 Climate–vegetation interaction in the Northern Andes
The region of the N Andes consists in political terms of Colombia, Ecuador, and Venezuela and includes a wide range of different ecoregions (Fig. 6 Box B). Sharing both the Caribbean and the Pacific coastline and various climate influ-ences, Colombia has a unique pattern of different ecosystems shared with neighbouring countries. Pollen records are found throughout a wide range of biomes and elevations (Flantua et al., 2015), from the tropical rainforest and mangroves along the coast to the high Andean “páramos”. The complex for-mation of the Andes with the three mountain ridges charac-terizes this region with numerous valleys and watersheds.
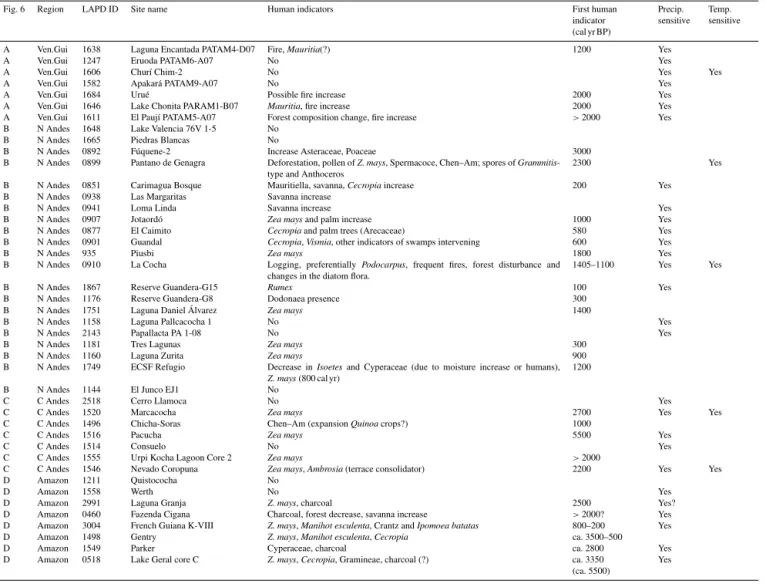
cri-Fig. 6 Region LAPD ID Site name Human indicators First human indicator (cal yr BP)
Precip. sensitive
Temp. sensitive
A Ven.Gui 1638 Laguna Encantada PATAM4-D07 Fire,Mauritia(?) 1200 Yes
A Ven.Gui 1247 Eruoda PATAM6-A07 No Yes
A Ven.Gui 1606 Churí Chim-2 No Yes Yes
A Ven.Gui 1582 Apakará PATAM9-A07 No Yes
A Ven.Gui 1684 Urué Possible fire increase 2000 Yes
A Ven.Gui 1646 Lake Chonita PARAM1-B07 Mauritia, fire increase 2000 Yes A Ven.Gui 1611 El Paují PATAM5-A07 Forest composition change, fire increase >2000 Yes B N Andes 1648 Lake Valencia 76V 1-5 No
B N Andes 1665 Piedras Blancas No
B N Andes 0892 Fúquene-2 Increase Asteraceae, Poaceae 3000 B N Andes 0899 Pantano de Genagra Deforestation, pollen ofZ. mays, Spermacoce, Chen–Am; spores ofGrammitis
-type and Anthoceros
2300 Yes
B N Andes 0851 Carimagua Bosque Mauritiella, savanna,Cecropiaincrease 200 Yes B N Andes 0938 Las Margaritas Savanna increase
B N Andes 0941 Loma Linda Savanna increase Yes
B N Andes 0907 Jotaordó Zea maysand palm increase 1000 Yes B N Andes 0877 El Caimito Cecropiaand palm trees (Arecaceae) 580 Yes B N Andes 0901 Guandal Cecropia,Vismia, other indicators of swamps intervening 600 Yes
B N Andes 935 Piusbi Zea mays 1800 Yes
B N Andes 0910 La Cocha Logging, preferentially Podocarpus, frequent fires, forest disturbance and changes in the diatom flora.
1405–1100 Yes Yes
B N Andes 1867 Reserve Guandera-G15 Rumex 100 Yes
B N Andes 1176 Reserve Guandera-G8 Dodonaea presence 300 B N Andes 1751 Laguna Daniel Álvarez Zea mays 1400
B N Andes 1158 Laguna Pallcacocha 1 No Yes
B N Andes 2143 Papallacta PA 1-08 No Yes
B N Andes 1181 Tres Lagunas Zea mays 300
B N Andes 1160 Laguna Zurita Zea mays 900
B N Andes 1749 ECSF Refugio Decrease inIsoetesand Cyperaceae (due to moisture increase or humans),
Z. mays(800 cal yr)
1200
B N Andes 1144 El Junco EJ1 No
C C Andes 2518 Cerro Llamoca No Yes
C C Andes 1520 Marcacocha Zea mays 2700 Yes Yes
C C Andes 1496 Chicha-Soras Chen–Am (expansionQuinoacrops?) 1000
C C Andes 1516 Pacucha Zea mays 5500 Yes
C C Andes 1514 Consuelo No Yes
C C Andes 1555 Urpi Kocha Lagoon Core 2 Zea mays >2000
C C Andes 1546 Nevado Coropuna Zea mays,Ambrosia(terrace consolidator) 2200 Yes Yes D Amazon 1211 Quistococha No
D Amazon 1558 Werth No Yes
D Amazon 2991 Laguna Granja Z. mays, charcoal 2500 Yes?
D Amazon 0460 Fazenda Cigana Charcoal, forest decrease, savanna increase >2000? Yes D Amazon 3004 French Guiana K-VIII Z. mays,Manihot esculenta, Crantz andIpomoea batatas 800–200 Yes D Amazon 1498 Gentry Z. mays,Manihot esculenta,Cecropia ca. 3500–500
D Amazon 1549 Parker Cyperaceae, charcoal ca. 2800 Yes
D Amazon 0518 Lake Geral core C Z. mays,Cecropia, Gramineae, charcoal (?) ca. 3350 (ca. 5500)
Yes
teria). An additional five records, which fulfilled all criteria, suggested human presence from before 2 ka and were there-fore excluded for climate reconstructions. From the remain-ing records, only four lakes lack human interference durremain-ing the last 2 kyr. The others describe human indicators over lim-ited periods of time and are considered valuable for PAGES-2k purposes (Table 3).
Lake Valencia (Figs. 6 Box B and 8a) is represented by three cores with varying quality in chronology and resolu-tion. The last 2 kyr are characterized by a decline in for-est cover, which attains the lowfor-est values of the Holocene and gives way to savannas. Aquatic proxies indicate declin-ing lake levels and increasdeclin-ing nutrient input, a trend that accelerated during the last 0.5 kyr, when human activities were more intense around the lake. Considering the entire Lateglacial–Holocene record, the Lake Valencia catchment has been shown to be more sensitive to moisture variations than to temperature, as known from tropical lowlands.
In the Andean region, changes in the altitudinal position of the upper forest line (UFL) are instrumental in recon-structing temperature changes. This ecotone is defined as the highest elevation contour of continuous forest and marks the boundary between the forest and the high Andean páramo biome (Moscol-Olivera and Hooghiemstra, 2010; Groot et al., 2013). The Andean sites in Venezuela and Colombia show indications of colder climates by decreased arboreal pollen at higher elevations. In the Venezuelan Andes, the only available pollen record is Piedras Blancas. There is no indication of human activity; hence, changes should be at-tributed mostly to climatic shifts, notably temperature and moisture. The expansion of superpáramo vegetation sug-gests a response to the warm and moist Medieval Climate Anomaly (MCA;∼1.15–0.65 ka), while a period of scarce
vegetation might be related to the LIA (∼0.6–0.1 ka) (Ledru
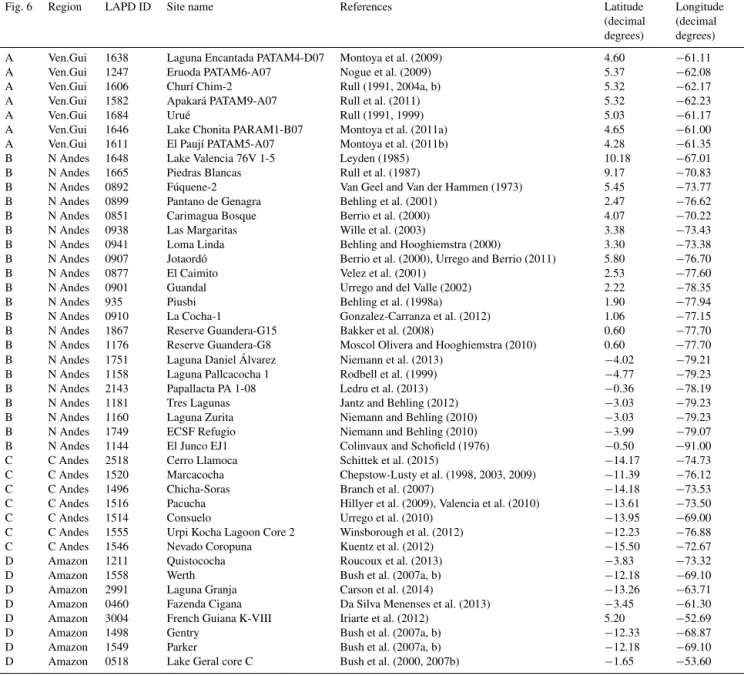
Table 3.Continued.
Fig. 6 Region LAPD ID Site name References Latitude
(decimal degrees)
Longitude (decimal degrees)
A Ven.Gui 1638 Laguna Encantada PATAM4-D07 Montoya et al. (2009) 4.60 −61.11
A Ven.Gui 1247 Eruoda PATAM6-A07 Nogue et al. (2009) 5.37 −62.08
A Ven.Gui 1606 Churí Chim-2 Rull (1991, 2004a, b) 5.32 −62.17
A Ven.Gui 1582 Apakará PATAM9-A07 Rull et al. (2011) 5.32 −62.23
A Ven.Gui 1684 Urué Rull (1991, 1999) 5.03 −61.17
A Ven.Gui 1646 Lake Chonita PARAM1-B07 Montoya et al. (2011a) 4.65 −61.00
A Ven.Gui 1611 El Paují PATAM5-A07 Montoya et al. (2011b) 4.28 −61.35
B N Andes 1648 Lake Valencia 76V 1-5 Leyden (1985) 10.18 −67.01
B N Andes 1665 Piedras Blancas Rull et al. (1987) 9.17 −70.83
B N Andes 0892 Fúquene-2 Van Geel and Van der Hammen (1973) 5.45 −73.77
B N Andes 0899 Pantano de Genagra Behling et al. (2001) 2.47 −76.62
B N Andes 0851 Carimagua Bosque Berrio et al. (2000) 4.07 −70.22
B N Andes 0938 Las Margaritas Wille et al. (2003) 3.38 −73.43
B N Andes 0941 Loma Linda Behling and Hooghiemstra (2000) 3.30 −73.38
B N Andes 0907 Jotaordó Berrio et al. (2000), Urrego and Berrio (2011) 5.80 −76.70
B N Andes 0877 El Caimito Velez et al. (2001) 2.53 −77.60
B N Andes 0901 Guandal Urrego and del Valle (2002) 2.22 −78.35
B N Andes 935 Piusbi Behling et al. (1998a) 1.90 −77.94
B N Andes 0910 La Cocha-1 Gonzalez-Carranza et al. (2012) 1.06 −77.15
B N Andes 1867 Reserve Guandera-G15 Bakker et al. (2008) 0.60 −77.70
B N Andes 1176 Reserve Guandera-G8 Moscol Olivera and Hooghiemstra (2010) 0.60 −77.70
B N Andes 1751 Laguna Daniel Álvarez Niemann et al. (2013) −4.02 −79.21
B N Andes 1158 Laguna Pallcacocha 1 Rodbell et al. (1999) −4.77 −79.23
B N Andes 2143 Papallacta PA 1-08 Ledru et al. (2013) −0.36 −78.19
B N Andes 1181 Tres Lagunas Jantz and Behling (2012) −3.03 −79.23
B N Andes 1160 Laguna Zurita Niemann and Behling (2010) −3.03 −79.23
B N Andes 1749 ECSF Refugio Niemann and Behling (2010) −3.99 −79.07
B N Andes 1144 El Junco EJ1 Colinvaux and Schofield (1976) −0.50 −91.00
C C Andes 2518 Cerro Llamoca Schittek et al. (2015) −14.17 −74.73
C C Andes 1520 Marcacocha Chepstow-Lusty et al. (1998, 2003, 2009) −11.39 −76.12
C C Andes 1496 Chicha-Soras Branch et al. (2007) −14.18 −73.53
C C Andes 1516 Pacucha Hillyer et al. (2009), Valencia et al. (2010) −13.61 −73.50
C C Andes 1514 Consuelo Urrego et al. (2010) −13.95 −69.00
C C Andes 1555 Urpi Kocha Lagoon Core 2 Winsborough et al. (2012) −12.23 −76.88
C C Andes 1546 Nevado Coropuna Kuentz et al. (2012) −15.50 −72.67
D Amazon 1211 Quistococha Roucoux et al. (2013) −3.83 −73.32
D Amazon 1558 Werth Bush et al. (2007a, b) −12.18 −69.10
D Amazon 2991 Laguna Granja Carson et al. (2014) −13.26 −63.71
D Amazon 0460 Fazenda Cigana Da Silva Menenses et al. (2013) −3.45 −61.30
D Amazon 3004 French Guiana K-VIII Iriarte et al. (2012) 5.20 −52.69
D Amazon 1498 Gentry Bush et al. (2007a, b) −12.33 −68.87
D Amazon 1549 Parker Bush et al. (2007a, b) −12.18 −69.10
D Amazon 0518 Lake Geral core C Bush et al. (2000, 2007b) −1.65 −53.60
Along the transitional zone between savanna and tropical rainforest in the east (E) Colombian savannas, three pollen records fulfil at least three criteria. Since 2 ka, a gradual in-crease in savanna vegetation is observed, suggesting a period of progressively drier conditions, e.g. at Loma Linda and Las Margaritas). However, the expanding Mauritiapalm forest observed in several records is considered to reflect increased local water availability and precipitation (Fig. 8b), and/or hu-man impact (Behling and Hooghiemstra, 1998, 1999; Rull and Montoya, 2014).
Along the N Andean Pacific slopes, Jotaordó, El Caimito, Guandal, and Piusbi document vegetation changes related to the precipitation regime in the C and S Chocó biogeographic region. Settings differ, as the first is located in a broad river
variabil-Fig. 6 Region LAPD ID Site name Potentially suitable for 2 kyr climate modelling
Potentially suitable for human stud-ies
LOTRED-2 k DUR 500 CONTROL2 TOP_END 1000_MID3
D Amazon 599 Terra Indigena Aningal Yes Yes 3 1 1 1
D Amazon 1557 Vargas Yes Yes 2 1 1
D Amazon 2993 Laguna El Cerrito Yes 3 1 1 1
D Amazon 2994 Laguna Frontera Yes 3 1 1 1
D Amazon 2995 Laguna San José Yes 3 1 1 1
D Amazon 339 Laguna Chaplin Yes 1 1
D Amazon 566 Rio Curua Yes 1 1
D Amazon 521 Lake Tapera Yes 2 1 1
D Amazon 483 Lago Crispim Yes 1 1
D Amazon 1166 Maxus-1 Yes 3 1 1 1
E SE Brazil 582 São José dos Ausentes Yes 4 1 1 1 1
E SE Brazil 3005 Morro Santana Yes 4 1 1 1 1
E SE Brazil 1998 Rincão das Cabritas Yes Yes 3 1 1 1
E SE Brazil 437 Cambará do Sul Yes Yes 2 1 1
E SE Brazil 591 Serra dos Órgãos Yes 1 1
E SE Brazil 479 Lagoa Nova Yes 1 1
E SE Brazil 1962 Ciama 2 Yes Yes 1 1
E SE Brazil 487 Lago do Pires Yes Yes 1 1
E SE Brazil 579 Saõ Francisco de Assis Yes 1 1
F Pampas 2998 Hinojales-San Leoncio Yes 2 1 1
F Pampas 2423 Lake Lonkoy Yes Yes 4 1 1 1 1
F Pampas 216 Laguna Sauce Grance Yes 3 1 1 1
G S Andes and Patagonia 745 Onamonte Yes 4 1 1 1 1
G S Andes and Patagonia 50 Puerto Harberton Yes 4 1 1 1 1
G S Andes and Patagonia 242 Valle de Andorra Yes 4 1 1 1 1
G S Andes and Patagonia 1990 Cabo Vírgenes Yes 2 1 1 G S Andes and Patagonia 2996 Cabo Vírgenes CV22 Yes 2 1 1
G S Andes and Patagonia 83 Laguna Azul Yes Yes 4 1 1 1 1
G S Andes and Patagonia 792 Río Rubens Yes 4 1 1 1 1
G S Andes and Patagonia 102 Laguna Potrok Aike 4 1 1 1 1
G S Andes and Patagonia 734 Lago Cipreses Yes Yes 4 1 1 1 1
G S Andes and Patagonia 50 Lago Guanaco Yes Yes 4 1 1 1 1
G S Andes and Patagonia 25 Cerro Frías Yes Yes 2 1 1
G S Andes and Patagonia 3000 Peninsula Avellanedo Bajo Yes 4 1 1 1 1 G S Andes and Patagonia 2484 Parque Nacional Perito Moreno Yes 4 1 1 1 1 G S Andes and Patagonia 657 Mallín Pollux Yes Yes 4 1 1 1 1 G S Andes and Patagonia 1964 Mallín El Embudo Yes Yes 4 1 1 1 1
G S Andes and Patagonia 1965 Lago Shaman Yes Yes 3 1 1 1
G S Andes and Patagonia 99 Lago Mosquito Yes Yes 4 1 1 1 1
G S Andes and Patagonia 2501 Lago Lepué Yes Yes 4 1 1 1 1
G S Andes and Patagonia 2321 Lago Pichilafquen Yes Yes 4 1 1 1 1 G S Andes and Patagonia 2320 Lago San Pedro Yes Yes 4 1 1 1 1 G S Andes and Patagonia 661 Laguna de Aculeo Yes Yes 4 1 1 1 1
G S Andes and Patagonia 749 Palo Colorado Yes 4 1 1 1 1
G S Andes and Patagonia 2996 Abra del Infiernillo Yes 4 1 1 1 1
ity. Within this region, Cecropia is used as natural distur-bance indicator due to fluvial–marine dynamics, while in the other Colombian regions this fast-growing species is consid-ered characteristic of human interference; both settings have disturbance as a common factor.
In the Colombian Andes there are no undisturbed pollen records during the last 2 kyr suitable for climate reconstruc-tions. Before the human disturbances, the La Cocha-1 record in the far south of Colombia (Fig. 8b) indicated generally wetter conditions similar to the N Ecuadorian pollen records of Guandera-G15 and Guandera-G8. A different kind of in-dex to highlight vegetation–climate interaction was used in the E Ecuadorian Andes at Papallacta PA1-08. Established to characterize the SASM and ENSO, the index interprets cloud transported arboreal pollen grains and Poaceae as a proxy for upslope cloud convection. Supported by a high resolu-tion (∼15 yr), a high frequency of dry and humid episodes
is detected during the last 1.1 kyr. In this alternation of
con-vective activity, the MCA, LIA, and current warm period are considered detectable.
In S Ecuador four pollen records suitable for PAGES-2k purposes are found within a relatively small subregion. Tres Lagunas suggests a cold phase, possibly the LIA, as one of several warm and cold phases detected during the last 2 kyr (Fig. 8b). At Laguna Zurita, the decrease in Isoetes was considered an indication of increased precipitation af-ter∼1.2 ka, observed similarly in other fossil pollen records
in the C Peruvian Andes. On the other hand, chemical analy-ses from the same core suggested drier conditions during the last millennium, confirmed by a different set of palaeocli-matic records. Unknown human interference in the last mil-lennium could be related to these divergent patterns, as the nearby ECSF Refugio and Laguna Daniel Álvarez detected
Table 3.Continued.
Fig. 6 Region LAPD ID Site name Human indicators First human
indicator (cal yr BP)
Precip. sensitive
Temp. sensitive
D Amazon 0599 Terra Indigena Aningal Charcoal, forest decrease, savanna increase >2000? Yes
D Amazon 1557 Vargas Charcoal 1000 Yes
D Amazon 2993 Laguna El Cerrito Z. mays, charcoal 2000
D Amazon 2994 Laguna Frontera Z. mays, charcoal 2000
D Amazon 2995 Laguna San José Z. mays, charcoal ca. 1600
D Amazon 0339 Laguna Chaplin Z. mays(unpubl.) ca. 1300
D Amazon 0566 Rio Curua Charcoal, forest decrease ca. 2500 Yes
D Amazon 0521 Lake Tapera Charcoal ca. 6900 Yes
D Amazon 0483 Lago Crispim Charcoal, mangrove decrease >2000
D Amazon 1166 Maxus-1 No Yes
E SE Brazil 0582 São José dos Ausentes Grasses, charcoal,Pinus 500
E SE Brazil 3005 Morro Santana Charcoal,Z. mays,Pinus,Eucalyptus 1230
E SE Brazil 1998 Rincão das Cabritas Grasses, fire increase (since early and mid-Holocene) 30 Yes Yes
E SE Brazil 0437 Cambará do Sul Charcoal, grasses 170 Yes Yes
E SE Brazil 0591 Serra dos Órgãos Charcoal (?) Yes Yes
E SE Brazil 0479 Lagoa Nova Charcoal? Early and
mid-Holocene?
Yes
E SE Brazil 1962 Ciama 2 Grasses,Pinus 160 Yes Yes
E SE Brazil 0487 Lago do Pires Deforestation,Z. mays, charcoal (since early and mid-Holocene) 140 Yes E SE Brazil 0579 Saõ Francisco de Assis Charcoal (begin Holocene),Z. mays(1.9 kyr) 10000 Yes F Pampas 2998 Hinojales-San Leoncio Exotic tree species (Eucalyptus,Pinus) 100 Yes
F Pampas 2423 Lake Lonkoy Exotic tree species (Eucalyptus,Pinus) 100 Yes
F Pampas 0216 Laguna Sauce Grance No
G S Andes and Patagonia 0745 Onamonte No Yes
G S Andes and Patagonia 0050 Puerto Harberton No Yes
G S Andes and Patagonia 0242 Valle de Andorra No
G S Andes and Patagonia 1990 Cabo Vírgenes Rumexpresence 50 Yes
G S Andes and Patagonia 2996 Cabo Vírgenes CV22 Rumexpresence 50 Yes
G S Andes and Patagonia 0083 Laguna Azul Rumexpresence 50 Yes
G S Andes and Patagonia 0792 Río Rubens Rumexpresence 300 Yes
G S Andes and Patagonia 0102 Laguna Potrok Aike Chenopodiaceae increase,Rumexpresence 150 Yes G S Andes and Patagonia 0734 Lago Cipreses Rumexpresence, increase in shrub and herbs taxa 60 Yes G S Andes and Patagonia 0050 Lago Guanaco Rumex, increase in Poaceae andPlantago 60 Yes G S Andes and Patagonia 0025 Cerro Frías Nothofagusdecrease,Rumexpresence 155 Yes G S Andes and Patagonia 3000 Peninsula Avellanedo Bajo Exotic species presence (Ast. Asteroideae,Rumex) 25 Yes
G S Andes and Patagonia 2484 Parque Nacional Perito Moreno No Yes
G S Andes and Patagonia 0657 Mallín Pollux Increase in Poaceae,PinusandPlantago 100 Yes
G S Andes and Patagonia 1964 Mallín El Embudo Increase in Poaceae 100 Yes
G S Andes and Patagonia 1965 Lago Shaman Asteraceae sub Asteroidea 250 Yes
G S Andes and Patagonia 0099 Lago Mosquito Nothofagusdecrease,RumexandPinuspresence 200 Yes
G S Andes and Patagonia 2501 Lago Lepué No Yes
G S Andes and Patagonia 2321 Lago Pichilafquen Rumex,Pinuspresence 350 Yes Yes
G S Andes and Patagonia 2320 Lago San Pedro Rumex,Pinus,Plantagopresence, Poaceae increase 121 Yes Yes G S Andes and Patagonia 0661 Laguna de Aculeo Micoralgae, Chenopodiaceae increase 100 Yes G S Andes and Patagonia 0749 Palo Colorado Decrease in swamp forest taxa, increase inMaytenusand Asteraceae <620 Yes
G S Andes and Patagonia 2996 Abra del Infiernillo No Yes
4.4 Climate–vegetation interaction in the Central Andes
The C Andes includes the high-elevation plateau of the Altiplano, above 3000 m a.s.l, in S Peru, Bolivia, and N Chile (Fig. 6 Box C). The Altiplano is an area of internal drainage within the Andes, which contains multiple peaks over 5000 m a.s.l.. The vegetation of the Altiplano is charac-terized by different grassland types, collectively known as “puna” (Kuentz et al., 2007). Within the grassland matrix are patches of woodland dominated by trees of the genus
Polylepis (Fjeldså and Kessler, 1996). To the east and west
of the Altiplano are the steep flanks of the Andes.
In total, 57 pollen records covering the last 2 kyr were identified from the Altiplano in Peru and Bolivia. Only four of the Altiplano records met all PAGES-2k criteria: (i) Cerro Llamoca, (ii) Marcacocha, (iii) Chicha-Soras, and (iv) Pacucha (Fig. 9a; Table 3). From the surrounding regions two additional records are also considered here because of their importance and fit to the PAGES-2k criteria: (i) Con-suelo on the E Andean flank, at mid-elevation (1370 m a.s.l.), and (ii) Urpi Kocha on the Pacific coast at sea level (within the archaeological site of Pachacmac). Of the seven sites
considered in this review only two records (Cerro Llamoca and Consuelo) show no human interference, while the oth-ers indicate human impact during different periods of time throughout the last 2 kyr.
Fig. 6 Region LAPD ID Site name References Latitude (decimal degrees)
Longitude (decimal degrees) D Amazon 0599 Terra Indigena Aningal Da Silva Menenses et al. (2013) −3.45 −61.3
D Amazon 1557 Vargas Bush et al. (2007a, b) −12.33 −69.12
D Amazon 2993 Laguna El Cerrito Whitney et al. (2014) −13.25 −65.39 D Amazon 2994 Laguna Frontera Whitney et al. (2014) −13.22 −65.35 D Amazon 2995 Laguna San José Whitney et al. (2013) −14.95 −64.50 D Amazon 0339 Laguna Chaplin Mayle et al. (2000), Burbridge et al. (2004) −14.48 −61.06 D Amazon 0566 Rio Curua Behling and Da Costa (2000) −1.74 −51.46
D Amazon 0521 Lake Tapera Toledo and Bush (2007) 0.13 −51.08
D Amazon 0483 Lago Crispim Behling and Da Costa (2001) −0.77 −47.85
D Amazon 1166 Maxus-1 Weng et al. (2002) −0.45 −76.62
E SE Brazil 0582 São José dos Ausentes Jeske-Pieruschka et al. (2010) −28.94 −50.04 E SE Brazil 3005 Morro Santana Behling et al. (2007) −30.08 −51.10 E SE Brazil 1998 Rincão das Cabritas Jeske-Pieruschka and Behling (2012) −29.48 −50.57 E SE Brazil 0437 Cambará do Sul Behling et al. (2004) −29.05 −50.10 E SE Brazil 0591 Serra dos Órgãos Behling and Safford (2010) −22.46 −43.03
E SE Brazil 0479 Lagoa Nova Behling (2003) −17.97 −42.20
E SE Brazil 1962 Ciama 2 Jeske-Pieruschka et al. (2013) −27.90 −48.87
E SE Brazil 0487 Lago do Pires Behling (1995) −17.95 −42.22
E SE Brazil 0579 Saõ Francisco de Assis Behling et al. (2005) −29.59 −55.22 F Pampas 2998 Hinojales-San Leoncio Stutz et al. (2015) −37.57 −57.45 F Pampas 2423 Lake Lonkoy Stutz et al. (2012, 2015) −37.20 −57.42
F Pampas 0216 Laguna Sauce Grance Fontana (2005) −38.95 −61.37
G S Andes and Patagonia 0745 Onamonte Heusser (1993) −54.90 −68.95 G S Andes and Patagonia 0050 Puerto Harberton Markgraf and Huber (2007) −54.88 −67.17 G S Andes and Patagonia 0242 Valle de Andorra Mauquoy et al. (2004) −54.75 −68.30 G S Andes and Patagonia 1990 Cabo Vírgenes Mancini (2007) −52.33 −68.38 G S Andes and Patagonia 2996 Cabo Vírgenes CV22 Mancini and Graham (2014) −52.33 −68.40 G S Andes and Patagonia 0083 Laguna Azul Mayr et al. (2005) −52.08 −69.58 G S Andes and Patagonia 0792 Río Rubens Huber and Markgraf (2003) −52.07 −71.93 G S Andes and Patagonia 0102 Laguna Potrok Aike Wille et al. (2007), Schäbitz et al. (2013) −51.97 −70.38 G S Andes and Patagonia 0734 Lago Cipreses Moreno et al. (2014) −51.29 −72.85 G S Andes and Patagonia 0050 Lago Guanaco Moreno et al. (2009) −51.05 −73.38 G S Andes and Patagonia 0025 Cerro Frías Tonello et al. (2009), Mancini (2009) −50.40 −72.70 G S Andes and Patagonia 3000 Peninsula Avellanedo Bajo Echeverria et al. (2014) −50.27 −72.84 G S Andes and Patagonia 2484 Parque Nacional Perito Moreno Mancini et al. (2002) −47.88 −72.85 G S Andes and Patagonia 0657 Mallín Pollux Markgraf et al. (2007) −45.69 −71.84 G S Andes and Patagonia 1964 Mallín El Embudo de Porras et al. (2014) −44.67 −71.70 G S Andes and Patagonia 1965 Lago Shaman de Porras et al. (2012) −44.45 −71.09 G S Andes and Patagonia 0099 Lago Mosquito Whitlock et al. (2006) −42.83 −71.67 G S Andes and Patagonia 2501 Lago Lepué Pesce and Moreno (2014) −42.80 −73.33 G S Andes and Patagonia 2321 Lago Pichilafquen Jara and Moreno (2012, 2014) −41.14 −72.80 G S Andes and Patagonia 2320 Lago San Pedro Fletcher and Moreno (2012) −38.53 −71.32 G S Andes and Patagonia 0661 Laguna de Aculeo Villa-Martínez et al. (2004) −33.83 −70.90 G S Andes and Patagonia 0749 Palo Colorado Maldonado and Villagrán (2006) −32.08 −71.48 G S Andes and Patagonia 2996 Abra del Infiernillo Garralla (2003) −26.75 −66.75
The two records considered here that are purported to have no local human impact (Cerro Llamoca and Consuelo) pro-vide the best opportunity of obtaining a clear insight into past climatic change in the C Andes during the last 2 kyr. The record from Cerro Llamoca indicates a succession of dry and moist episodes (Fig. 9b). After 0.5 ka, sediments are com-posed of redeposited and eroded material, and consequently the interpretation of the latter half of the record is difficult. In contrast, little compositional change is evident in the Con-suelo record, with the most significant variance during the last 2 kyr being a rise inCecropiasp. pollen after 1 ka. Ce-cropia pollen is typically interpreted as an indicator of dis-turbance (Bush and Rivera, 2001), and therefore, in the ab-sence of humans signal, the rise inCecropiacould be inter-preted as an elevated level of natural disturbance. The switch
to very dry conditions at Cerro Llamoca in the western An-dean cordillera and the rise inCecropiaat Consuelo on the E Andean flank are broadly coincident (∼0.85 ka); however,
it is not possible to say if this pattern results from a common climatic mechanism.
Archaeological evidence from Chicha-Soras does not show any evidence of human occupation of the valley be-tween ∼1.9 and ∼1.4 ka. Between 1.4 and 1 ka and
val-Figure 7.Panel(a): map showing the pollen records discussed in the Venezuelan Guayana highlands and uplands and the number of PAGES-2k criteria these records fulfill. Panel(b): summary of moisture balance and temperature including human interference for the pollen records discussed. Not all records are suitable to derive both a moisture and a temperature signal. Climate and human presence are shown overlapping when the pollen record is not conclusive regarding the derived signal. Records fulfilling one or two criteria indicated by star.
ley during 1.5–0.5 ka and, consequently, that the aridity sig-nal from the pollen could be interpreted as a climatic one.
Some climate information has been inferred from the four remaining sites (Marcacocha, Pacucha, Nevado Coropuna, and Urpi Kocha) despite the strong human influence on the vegetation. At Nevado Coropuna humid conditions persisted until a short dry episode occurred at 0.97–0.82 ka (Fig. 9b). During the last 2 kyr at Marcacocha, successive peaks in Cyperaceae pollen have been interpreted as indicative of three periods of elevated aridity, while more abundant ele-vated Plantagoat ∼1.9 ka is suggested to indicate cooler
conditions, and Alnus at∼1–0.5 ka could indicate warmer
and drier conditions, although discerning the climate signal related to Alnus is difficult due to its utilization in agro-forestry practices (Chepstow-Lusty and Jonsson, 2000). At Pacucha and Urpi Kocha, significant changes to the pollen assemblage in the last 2 kyr are attributed to human activity rather than climate. Although the pollen records are likely to be somewhat obscured by the agricultural activities and irri-gation of the crops, all high-elevation records with a moisture
balance signal suggest generally drier conditions occurred in the C Andes between 1.2 and 0.7 ka when compared with the rest of the last 2 kyr.
Generally, the pollen records from the Altiplano tend to show a greater sensitivity to precipitation rather than to tem-perature. The greater sensitivity to precipitation is because moisture availability is the limiting factor in most areas for both vegetation and human occupation. However, human oc-cupation indicates changes in temperature: (i) at Marcacocha, when the sudden stop in agricultural activities is attributed to colder temperatures and (ii) at Nevado Coropuna, when the increase in human occupation (expansion of Inca culture) at higher elevation shows that there was no glacier but there were warmer temperatures.
4.5 Climate–vegetation interaction in the lowland Amazon basin
Figure 8.Panel(a): map showing the pollen records discussed in the Northern Andes and the number of PAGES-2k criteria these records
fulfill. Panel(b): summary of moisture balance and temperature including human interference for the pollen records discussed. Not all records are suitable to derive both a moisture and a temperature signal. Climate and human presence are shown overlapping when the pollen record is not conclusive regarding the derived signal. Bars are shaded grey when the climate signal is obscured by human interference. Records fulfilling one or two criteria indicated by star. Galápagos Islands not shown.
500 m a.s.l. and extends to the lowland Guayanas (Fig. 6 Box D). This encompasses the evergreen rainforest, which cov-ers most of Amazonia, as well as the southern transitional or seasonally dry tropical forests located in NE Bolivia and S Rondônia, N Mato Grosso, and N Para State, Brazil. It also includes the Llanos de Moxos savannas of NE Bolivia, and the ecotonal rainforest–savanna areas of N Roraima State, Brazil, and extends to the coastal swamps or grasslands of N Brazil and French Guiana.
In total, 42 published pollen records that cover the last 2 kyr were identified from the lowland Amazon basin. By applying the dating constraints of the PAGES-2k criteria, the majority of pollen records from the Amazon basin are dis-counted from any analysis of climate–vegetation interaction for the past 2 kyr. Only 5 records complied with all four of the criteria and 11 records met with three criteria (Fig. 10a; Table 3). One of these records, Lake La Gaiba, is situated just outside the Amazon basin, in the Pantanal region of central Brazil and SE Bolivia. However, the record and its hydrologi-cal catchment reflect Holocene precipitation in the S Amazon basin (Whitney et al., 2011), and it therefore was included as part of this review.
Lake Quistococha in the NE Peruvian Amazon is
sur-rounded by a Mauritia flexuosa-dominated palm swamp.
Vegetation has undergone several significant species compo-sitional changes over the past 2 kyr. The broad pattern of veg-etation change was fromCecropia-dominated riverine forest at∼2.2 ka to abundant Cyperaceae and floating grasses or
ferns and the commencement of peat formation∼2.1 ka to
seasonally inundated riverine forest with abundant Moraceae and Myrtaceae from∼1.9 ka and, finally, the development of
closed-canopy,Mauritia-dominated swamp from∼1 ka
un-til the present. Superimposed on this broad pattern of change were rapid, centennial-scale shifts in forest composition and degree of openness. However, these rapid shifts were at-tributed by the authors to hydrological dynamics rather than to climate change or human impact.
Lake Werth belongs to a collection of sites (including Gen-try, Vargas, and Parker) in the “Madre de Díos” region of the SE Peruvian Amazon. The lake formed at∼3.4 ka and
records continuous evergreen rainforest throughout, with lit-tle evidence of burning. The records from the surrounding three lakes concur, suggesting that, regionally, rainforest (and climate) has been stable over the last 2 kyr.
reconstruc-Figure 9.Panel(a): map showing the pollen records discussed in the Central Andes and the number of PAGES-2k criteria these records fulfill. Panel(b): summary of moisture balance and temperature including human interference for the pollen records discussed. Not all records are suitable to derive both a moisture and a temperature signal. Climate and human presence are shown overlapping when the pollen record is not conclusive regarding the derived signal. Bars are shaded grey when the climate signal is obscured by human interference. Records fulfilling one or two criteria indicated by star.
tion from the much larger Lake Orícore (not shown; Car-son et al., 2014), which is located < 20 km away from La-guna Granja and shows climate-driven expansion of ever-green rainforest in this region between∼2 and 1.7 ka.
How-ever, forest expansion does not occur on the Granja site un-til 0.5 ka. The distribution of forest vs. savanna around La-guna Granja was shown to be heavily influenced by human land use between 2.5 and 0.5 ka (Carson et al., 2014, 2015); therefore, it is not suitable for analysis of naturally driven vegetation dynamics.
The Fazenda Cigana record is in the savanna–gallery-forest mosaic landscape in the N Brazilian Amazon. The core was taken as one of a pair, along with the Terra Indí-gena Aningal record, which was cored from the same
Mau-ritia swamp. The pollen records are dominated by
Mauri-tiathroughout, attributed to continuously wet climate in this region in the late Holocene. There are however centennial-scale periods of gallery forest reduction and grassland expan-sion, accompanied by increased charcoal concentrations. Da Silva Meneses et al. (2013) inferred that these periods of high burning were anthropogenic in origin and compared them to modern-day prescribed burning practices used by indigenous people in the northern Amazon to maintain an open savanna landscape. Despite the potential human interference, these records demonstrate natural stability of the forest–savanna ecotone over the last 1.5 kyr in this particular part of the N Amazon.
Figure 10.Panel(a): map showing the pollen records discussed in the lowland Amazon basin and the number of PAGES-2k criteria these
records fulfill. Panel(b): summary of moisture balance and temperature including human interference for the pollen records discussed. Not all records are suitable to derive both a moisture and a temperature signal. Climate and human presence are shown overlapping when the pollen record is not conclusive regarding the derived signal. Records fulfilling one or two criteria indicated by star; m±: m a.s.l. based on coordinates.
associated with these earthworks on a local scale. From the earliest part of this record, the fossil pollen spectra indicate seasonally inundated savanna, dominated by Cyperaceae and Marantaceae until 0.8 ka, when human inference is detected. In the post-European period after ∼0.5 ka, charcoal
abun-dance increases, probably reflecting more intensive use of fire by colonial populations.
4.6 Climate–vegetation interaction in southern and southeastern Brazil
The landscape in S and SE Brazil is diverse, from lowlands to high mountains, from subtropical regions with frost to tropical regions. Due to this heterogeneity distinct vegeta-tion types occur throughout the region. The vegetavegeta-tion in S–SE Brazil includes forest ecosystems such as the tropi-cal Atlantic rainforest,Araucariaforest, semi-deciduous for-est, “Cerrado” (savanna woodland), and different grassland
ecosystems such as “Campos” and “Campos de Altitude” (high-elevation grassland) (Fig. 6 Box E). There is a gradi-ent from no or short dry seasons in the coastal lowland to 6-month dry seasons in the hinterland (northernmost part of the highland in SE Brazil), marking the vegetational gradient from moist Atlantic rainforest to semi-deciduous forest and to Cerrado. Additional background information is provided in the Supplement.
There are approximately 50 pollen records known from S–SE Brazil, but many sites have not been published in peer-reviewed journals and were therefore not considered. Unfor-tunately, the two records that agree with all criteria show hu-man interference (Table 3). Therefore, a general overview of climate–vegetation interaction from the region is presented, considering seven records that fulfil some of the criteria (Ta-ble 3, Fig. 11a).
Figure 11.Panel(a): map showing the pollen records discussed in southern and southeastern Brazil and the number of PAGES-2k criteria
these records fulfill. Panel(b): summary of moisture balance and temperature including human interference for the pollen records discussed. Not all records are suitable to derive both a moisture and a temperature signal. Climate and human presence are shown overlapping when the pollen record is not conclusive regarding the derived signal. Bars are shaded grey when the climate signal is obscured by human interference. Records fulfilling one or two criteria indicated by star.
the early and mid-Holocene to wetter conditions after about 4.3 ka, and in particular after 1.1 ka (Fig. 11b). Increasing moisture is clearly indicated on the S Brazilian highlands by the expansion of Araucaria forests in the form of gallery forests along rivers and a pronounced expansion of
Arau-caria forest into the Campos after about 1.1 ka (e.g.
Cam-bará do Sul and Rincão das Cabritas). The expansion of gallery forests at similar time periods (5.2 and 1.6 ka) is also recorded in the southernmost lowland in S Brazil by the São Francisco de Assis record. Study sites that reflect changes in the Atlantic rainforest area indicate an expansion dur-ing the Holocene where overall wetter conditions prevailed compared to highland and southernmost lowland areas, e.g. Ciama 2 (Fig. 11b).
In contrast to other sites and regions, a relatively humid and warm phase during the LIA is inferred from the high-resolution Cambará do Sul record as an expansion of
Wein-manniain theAraucariaforest is observed. In SE Brazil the
Lago do Pires and Lagoa Nova record indicate that a dense and closed semi-deciduous forest existed in the region only during the late Holocene period under the current climatic conditions with a∼3-month dry season. In the mountains
of SE Brazil (e.g. Serra dos Órgãos record), a reduction in Campos de Altitude occurred at 0.9 ka, indicating a change to wetter conditions that is broadly coeval with a similar trend in the Lago do Pires record (Fig. 11b).
4.7 Climate–vegetation interaction in the pampean plain
The pampean plain extends east of the Andes, between 30 and 40◦S (Fig. 6 Box F), and is characterized by aeolian