CPD
6, 307–346, 2010Holocene land-cover reconstructions
M.-J. Gaillard et al.
Title Page
Abstract Introduction
Conclusions References
Tables Figures
◭ ◮
◭ ◮
Back Close
Full Screen / Esc
Printer-friendly Version
Interactive Discussion
Clim. Past Discuss., 6, 307–346, 2010 www.clim-past-discuss.net/6/307/2010/
© Author(s) 2010. This work is distributed under the Creative Commons Attribution 3.0 License.
Climate of the Past Discussions
This discussion paper is/has been under review for the journal Climate of the Past (CP). Please refer to the corresponding final paper in CP if available.
Holocene land-cover reconstructions for
studies on land cover-climate feedbacks
M.-J. Gaillard1, S. Sugita2, F. Mazier3,5, J. O. Kaplan4, A.-K. Trondman1,
A. Brostr ¨om5, T. Hickler5, E. Kjellstr ¨om6, P. Kune ˇs7, C. Lemmen8, J. Olofsson5, B. Smith5, and G. Strandberg6
1
School of Pure and Applied Sciences, Linnaeus University, 39182 Kalmar, Sweden 2
Institute of Ecology, Tallinn University, 10120 Tallinn, Estonia 3
GEODE, UMR 5602, University of Toulouse, 5 all ´ee A. Machado, 31058 Toulouse Cedex, France
4
ARVE Group, Ecole Polytechnique F ´ed ´erale de Lausanne, Station 2, 1015 Lausanne, Switzerland
5
Department of Earth and Ecosystem Sciences, Lund University, S ¨olvegatan 12, 223 62 Lund, Sweden
6
Swedish Meteorological and Hydrological Institute, 60176 Norrk ¨oping, Sweden 7
CPD
6, 307–346, 2010Holocene land-cover reconstructions
M.-J. Gaillard et al.
Title Page
Abstract Introduction
Conclusions References
Tables Figures
◭ ◮
◭ ◮
Back Close
Full Screen / Esc
Printer-friendly Version
Interactive Discussion 8
Institute for Coastal Research, GKSS-Forschungszentrum Geesthacht GmbH, 21502 Geesthacht, Germany
Received: 16 February 2010 – Accepted: 21 February 2010 – Published: 11 March 2010
Correspondence to: M.-J. Gaillard ([email protected])
CPD
6, 307–346, 2010Holocene land-cover reconstructions
M.-J. Gaillard et al.
Title Page
Abstract Introduction
Conclusions References
Tables Figures
◭ ◮
◭ ◮
Back Close
Full Screen / Esc
Printer-friendly Version
Interactive Discussion
Abstract
The major objectives of this paper are: (1) to review the pros and cons of the scenarios of past anthropogenic land cover change (ALCC) developed during the last ten years, (2) to discuss issues related to pollen-based reconstruction of the past land-cover and introduce a new method, REVEALS (Regional Estimates of VEgetation Abundance
5
from Large Sites), to infer long-term records of past land-cover from pollen data, (3) to present a new project (LANDCLIM: LAND cover – CLIMate interactions in NW Europe during the Holocene) currently underway, and show preliminary results of REVEALS reconstructions of the regional land-cover in the Czech Republic for five selected time windows of the Holocene, and (4) to discuss the implications and future directions in
10
climate and vegetation/land-cover modeling, and in the assessment of the effects of human-induced changes in land-cover on the regional climate through altered feed-backs. The existing ALCC scenarios show large discrepancies between them, and few cover time periods older than AD 800. When these scenarios are used to assess the impact of human land-use on climate, contrasting results are obtained. It emphasizes
15
the need of REVEALS model-based land-cover reconstructions. They might help to fine-tune descriptions of past land-cover and lead to a better understanding of how long-term changes in ALCC might have influenced climate. The REVEALS model is proved to provide better estimates of the regional vegetation/land-cover changes than the traditional use of pollen percentages. Thus, the application of REVEALS opens
20
up the possibility of achieving a more robust assessment of land cover at regional-to continental-spatial scale throughout the Holocene. We present maps of REVEALS estimates for the percentage cover of 10 plant functional types (PFTs) at 200 BP and 6000 BP, and of the two open-land PFTs “grassland” and “agricultural land” at five time-windows from 6000 BP to recent time. The LANDCLIM results are expected to
25
CPD
6, 307–346, 2010Holocene land-cover reconstructions
M.-J. Gaillard et al.
Title Page
Abstract Introduction
Conclusions References
Tables Figures
◭ ◮
◭ ◮
Back Close
Full Screen / Esc
Printer-friendly Version
Interactive Discussion
1 Introduction
Terrestrial vegetation (land cover) is an inherent part of the climate system. Natural, pri-marily climate-driven, vegetation and ecosystem processes interact with human land-use to determine vegetation patterns, stand structure and their development through time (e.g. Vitousek et al., 1997). The resulting land surface properties feed back on
5
climate by modulating exchanges of energy, water vapour and greenhouse gases with the atmosphere. Land ecosystems may exert biogeochemical (affecting sources and sinks of greenhouse gases, GHG, aerosols, pollutants and other gases) and biophys-ical (affecting heat and water fluxes, wind direction and magnitude) feedbacks on the atmosphere (e.g. Foley et al., 2003). These feedbacks may be either positive,
ampli-10
fying changes or variability in climate, or negative, attenuating variability and slowing trends in climate. Carbon cycle feedbacks have received particular attention (Cox et al., 2000; Ruddiman, 2003; Friedlingstein et al., 2006; Meehl et al., 2007); however, biophysical interactions between the land surface and atmosphere can be of compara-ble importance at the regional scale (Kutzbach et al., 1996; Sellers et al., 1997; Betts,
15
2000; Cox et al., 2004; Bala et al., 2007). These feedbacks represent a major source of uncertainty in projections of climate under rising greenhouse gas concentrations in the atmosphere (Meehl et al., 2007). Therefore, the incorporation of dynamic vegeta-tion into climate models to account for feedbacks and refine global change projecvegeta-tions is a current priority in the global climate modelling community (Friedlingstein et al.,
20
2006; Meehl et al., 2007; van der Linden and Mitchell, 2009). In this context, there is a growing need for spatially explicit descriptions of vegetation/land-cover in the past at continental to global scales for the purpose of improving our mechanistic understand-ing of processes for incorporation in predictive models, and applyunderstand-ing the data-model comparison approach with the purpose to test, evaluate and improve dynamic
vege-25
CPD
6, 307–346, 2010Holocene land-cover reconstructions
M.-J. Gaillard et al.
Title Page
Abstract Introduction
Conclusions References
Tables Figures
◭ ◮
◭ ◮
Back Close
Full Screen / Esc
Printer-friendly Version
Interactive Discussion
However, objective long-term records of the past vegetation/land-cover changes are limited. Palaeoecological data, particularly fossil pollen records, have been used to approximate the vegetation changes regionally and globally (e.g. Prentice and Jolly, 2000; Williams et al., 2008); unfortunately, they have been of little use particularly for the assessment of human impacts on vegetation and land cover (Anderson et al.,
5
2006; Gaillard et al., 2008). The development of databases of human-induced changes in land cover based on historical records, remotely-sensed images, land census and modelling (Klein Goldewijk, 2001; Klein Goldewijk et al., 2007; Ramankutty and Fo-ley, 1999; Olofsson and Hickler, 2008) has been informative to evaluate the effects of anthropogenic land-cover changes on the past climate (e.g. Brovkin et al., 2006;
Olof-10
sson and Hickler, 2008). However, the most used databases to date (i.e. the Klein Goldewijk’s database in particular) cover relatively short periods. Nevertheless, re-cently developed scenarios of anthropogenic land cover change (ALCC) (Pongratz et al., 2008; Kaplan et al., 2009; Lemmen, 2009) include longer time periods. But all these datasets show discrepancies between them in their estimates of land cover
dur-15
ing key time periods of the past. Therefore, the development of tools to quantify and synthesize records of vegetation/land cover change based on palaeoecological data is essential to evaluate model-based scenarios of ALCC and to improve their reliability.
The major objectives of this paper are: (1) to review the pros and cons of the ALCC scenarios developed by Ramankutty and Foley (1999), Klein Goldewijk (2001), Klein
20
Goldewijk et al. (2007, 2010), Olofsson and Hickler (2008), Pongratz et al. (2008), Ka-plan et al. (2009), and Lemmen (2009), (2) to discuss issues related to pollen-based re-construction of the past vegetation/land-cover and introduce a new method (REVEALS, Regional Estimates of VEgetation Abundance from Large Sites; Sugita, 2007a) to improve the long-term records of vegetation/land-cover, (3) to present a new project
25
CPD
6, 307–346, 2010Holocene land-cover reconstructions
M.-J. Gaillard et al.
Title Page
Abstract Introduction
Conclusions References
Tables Figures
◭ ◮
◭ ◮
Back Close
Full Screen / Esc
Printer-friendly Version
Interactive Discussion
All ages below are given in calender years AD/BC or BP (present=1950).
2 Databases of past land-cover and land-use changes
As human population and its density is generally accepted as the major driver of ALCC, long-term data of past land-cover has generally been inferred from estimates of human population density and cleared land per person. Existing databases of global
esti-5
mates of past land-use change back to AD 1700 (e.g. Ramankutty and Foley, 1999; Klein Goldewijk, 2001, i.e. the HYDE, History Database of the Global Environment), database and back to AD 800 (Pongratz et al., 2008) were derived by linking recent remote sensed images of contemporary land cover and land census data to past hu-man population censuses. Brovkin et al. (2006) used the HYDE database to
recon-10
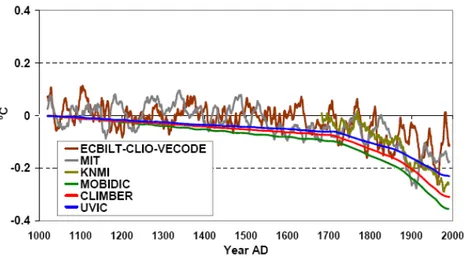
struct land-use feedbacks on climate over the past 1000 years; but due to the lack of palaeodata synthesis of past land-cover, the rate of decrease in forest cover between AD 1000 and 1700 was assumed constant. The outputs from six different climate models showed a cooling of 0.1◦C to 0.4◦C over the Northern Hemisphere due to the biophysical feedback (increased albedo) of an estimated global decrease in forest
15
cover between AD 1000 and 2000 (Fig. 1).
Olofsson and Hickler (2008) were the first to present an estimate of transient changes in carbon emissions caused by land-use on Holocene time scales. They used archaeological maps of the spread of different societal forms (“states and empires” and “agricultural groups”; Lewthwaite and Sherrat, 1980), the HYDE reconstruction
20
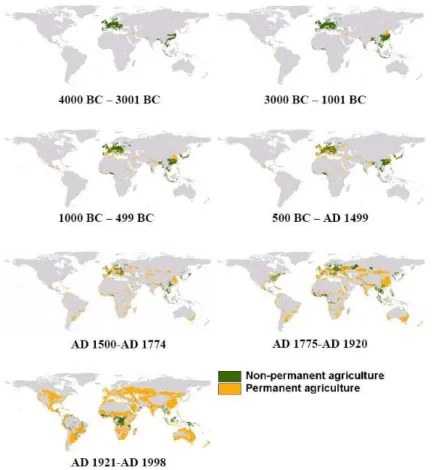
(version 2.0) for the last 300 years, global changes in population (primarily based on McEvedy and Jones, 1978), and an estimate of land suitability to derive land transfor-mation for farmland and pastures by humans at different time windows (Fig. 2). Per-manent agriculture was assumed to be associated with the development of states and empires, leading to 90% deforestation of the suitable land, and non-permanent
(slash-25
CPD
6, 307–346, 2010Holocene land-cover reconstructions
M.-J. Gaillard et al.
Title Page
Abstract Introduction
Conclusions References
Tables Figures
◭ ◮
◭ ◮
Back Close
Full Screen / Esc
Printer-friendly Version
Interactive Discussion
Far East and in Europe-Near East, characterized mainly by non-permanent agriculture from 4000 BC until 1000 BC. In Europe, permanent agriculture is represented mainly in France, Spain, and Italy during the time window 1000 BC–AD 499. From AD 500, permanent agriculture spread northwards and eastwards. The major change is seen between the time windows AD 1775–1920 and AD 1921–1998, most non-permanent
5
agriculture outside the tropics being replaced by permanent agriculture. It is striking that permanent agriculture in Europe does not differ much between the time windows AD 1500–1774 and AD 1775–1920. The 19th century is known in several regions of Europe as the time of most intensive land-use with a maximum of landscape openness, while the 20th century was characterized by a reforestation after abandonment and/or
10
through plantation, e.g. in southern Scandinavia, southern Norway, northern Italy, Cen-tral France, the Pyerenees, CenCen-tral Spain, Portugal (Krzywinski et al., 2009; Gaillard et al., 2009). The latter landscape transformation is not evidenced in the map for the time window AD 1921–1998; instead it shows an increase in the areas of permanent agriculture compared to the former period. This is probably mainly due to the version
15
(2.0) of HYDE used in the reconstruction. In the most recent version (no 3.1) of HYDE the landscape transformation during the 20th century (compared to the 19th century) is more visible.
Pongratz et al. (2008) estimated the extent of cropland and pasture since AD 800. Their reconstruction is based on published maps of agricultural areas for the last three
20
centuries with a number of corrections. For earlier times, a country-based method was developed that uses human population data as a proxy for agricultural activity. The resulting reconstruction of agricultural areas is combined with a map of potential veg-etation to estimate the resulting historical changes in land cover. One of the strengths of the study is that the uncertainties associated with the approach, in particular owing
25
CPD
6, 307–346, 2010Holocene land-cover reconstructions
M.-J. Gaillard et al.
Title Page
Abstract Introduction
Conclusions References
Tables Figures
◭ ◮
◭ ◮
Back Close
Full Screen / Esc
Printer-friendly Version
Interactive Discussion
area potentially covered by vegetation on the globe. This transformation was caused almost as much by cropland as by pasture. Around AD 1700, the agricultural area had increased to 7.7 million km2; 3.0 million km2 of forest had been cleared (85% for cropland, 15% for pasture) and 4.7 million km2of grassland and shrubland were under human use (30% for the cultivation of crop). Thus, between AD 800 and AD 1700,
5
natural vegetation under agricultural use had increased by ca. 5 million km2. Within the next 300 years, the total agricultural area increased to 48.4 million km2 (mainly pas-tureland), i.e. a ca. 5.5 times larger area than at AD 1700. This reconstruction shows that global land cover change was small between AD 800 and AD 1700 compared to industrial times, but relatively large compared to previous millennia. Moreover,
dur-10
ing the preindustrial time period of the last millennium, the reconstruction shows clear between-region differences in histories of agriculture.
Recently, Kaplan et al. (2009) created a high resolution, annually resolved time se-ries of anthropogenic deforestation in Europe over the past three millennia by using 1) a model of the forest cover-human population relationship based on estimates of human
15
population for the period 1000 BC to AD 1850, 2) a model of land suitability to cultiva-tion and pasture. Assumpcultiva-tions include that high quality agricultural land was cleared first, and that marginal land was cleared next. A second alternative map was produced by taking into account technological developments. The latter produces major diff er-ences in SW, SE and Eastern Europe. Lemmen (2009) developed an independent
20
estimate of human population density, technological change and agricultural activity during the period 9500–2000 BC based on dynamical hindcasts of socio-economic de-velopment (GLUES, Global Land Use and technological Evolution Simulator; Wirtz and Lemmen, 2003). The population density estimate was combined with per capita crop intensity from HYDE (version 3.1) to infer areal demand for cropping at an annual
res-25
CPD
6, 307–346, 2010Holocene land-cover reconstructions
M.-J. Gaillard et al.
Title Page
Abstract Introduction
Conclusions References
Tables Figures
◭ ◮
◭ ◮
Back Close
Full Screen / Esc
Printer-friendly Version
Interactive Discussion
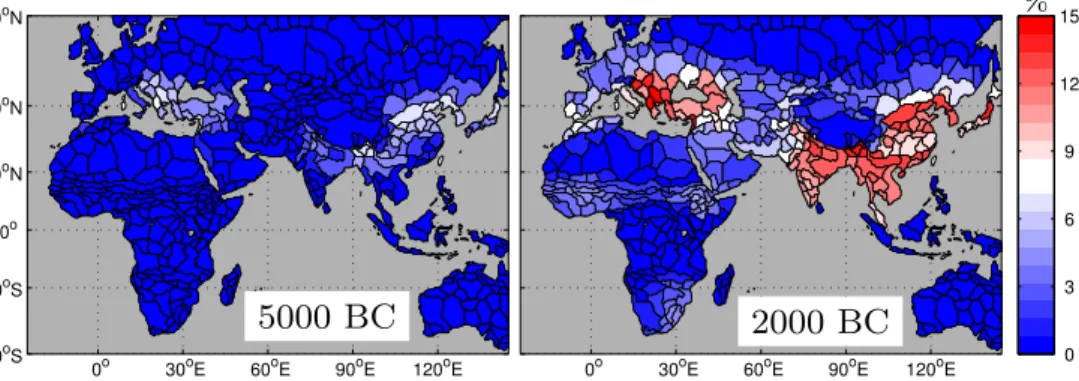
turned into crop land at 2000 BC, especially in the heavily populated areas of East and South Asia, in Southeast Europe and the Levant. A comparison to the simulated crop-land fractional area at 5000 BC shows an intensification of agriculture at 2000 BC in the ancient centers of agriculture (Near East, Anatolia, Greece, China, Japan), and an extensification visible in the spread of crops spanning the Eurasian continent at
sub-5
tropical and temperate latitudes, and the emergence of agriculture in Africa (Fig. 3). At 5000 BC, GLUES simulated a crop fraction of up to 7% in the early agricultural centers (Levante, Southeast Europe, China, Japan). The distribution of agriculture around 2000 BC reconstructed by Lemmen (2009) agrees with the estimates of Olof-sson and Hickler (2008) in Japan, China, West Africa and Europe. Major differences
10
in Olofson and Hickler’s dataset are (1) the discontinuity between the East Asian and Western Eurasian agriculture (Figs. 2, 5), especially through the Indian subcontinent, and (2) the distinction between permanent and non-permanent agriculture, which was not attempted in GLUES.
The difference reported by Kaplan et al. (2009) between their maps and the HYDE
15
database at AD 1800 is striking. The model results of Kaplan et al. (2009) provide more reasonable estimations of deforestation in Europe around AD 1800 when com-pared to historical accounts (Krzywinski et al., 2009; Gaillard et al., 2009) than the HYDE database does. Even though the maps by Olofsson and Hickler (2008) (Figs. 2, 5) are difficult to compare with those of Kaplan et al. (2009) because of the difference in
20
scale (global and continental, respectively), type (permanent/non-permanent agricul-ture and cultivation/pasagricul-ture, respectively) and unit (areas under permanent/non per-manent agriculture or forested fraction of grid cell, respectively) of the reconstructed landscape openness, the maps of Kaplan et al. (2009) show generally more open landscapes between 1000 BC and AD 1850 than the maps of Olofsson and
Hick-25
CPD
6, 307–346, 2010Holocene land-cover reconstructions
M.-J. Gaillard et al.
Title Page
Abstract Introduction
Conclusions References
Tables Figures
◭ ◮
◭ ◮
Back Close
Full Screen / Esc
Printer-friendly Version
Interactive Discussion
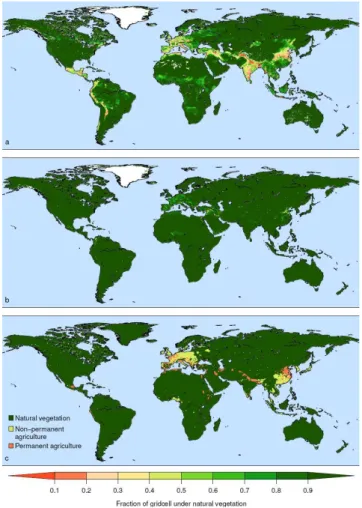
window 500 BC–AD 1499 (Fig. 2). Similarly, Kaplan et al.’s map for AD 1 exhibits much larger deforested areas than HYDE (over the entire globe) and the map by Olofsson and Hickler (2008) for the time window 500 BC–AD 1499 (in particular in Central and Eastern South America, central Africa, the Near Eat and India) (Fig. 5). This implies that previous attempts to quantify anthropogenic perturbation of the Holocene carbon
5
cycle based on the HYDE and Olofsson and Hickler’s databases may have underes-timated early human impact on the climate system. Lemmen (2009) compared his simulated crop fraction estimate with the HYDE estimate and found only local agree-ment (e.g. along the Yellow River in northern China, in the greater Lebanon area in the Near East and on the Italian peninsula), while most of the GLUES-simulated cropland
10
area is not apparent in the HYDE database; the discrepancy was attributed to missing local historical data in HYDE. Krumhardt et al. (2010) compared the human population density from GLUES extrapolated to 1000 BC with the estimate by Kaplan et al. (2009) based on McEvedy and Jones (1978) and could state a very good match for many countries and subcontinental regions.
15
3 Pollen-based reconstruction of past vegetation and land cover
Fossil pollen has been extensively used to estimate past vegetation in sub-continental to global scales. However, most studies have focused on forested vegetation. For in-stance, Williams et al. (2008) used a modern-analogue approach to estimate the past Leaf Area Index (LAI) in Northern America. They tested their approach using a
mod-20
ern training data-set and showed that it performs satisfactorily for a majority of the high number of records used. Tarasov et al. (2007) developed in northern Eurasia a method to infer the percentage cover of different tree categories (such as needle-leaved, de-ciduous, or evergreen trees) from pollen data. Their results showed that pollen-inferred tree-cover was often too high for most tree categories particularly north of 60◦latitude.
25
CPD
6, 307–346, 2010Holocene land-cover reconstructions
M.-J. Gaillard et al.
Title Page
Abstract Introduction
Conclusions References
Tables Figures
◭ ◮
◭ ◮
Back Close
Full Screen / Esc
Printer-friendly Version
Interactive Discussion
related to 1) the non-linear nature of pollen-vegetation relationships when pollen data is expressed in percentages, 2) the definition of the spatial scale of vegetation rep-resented by pollen, and 3) the differences in pollen productivity between plant taxa (e.g. Andersen, 1970; Prentice, 1985, 1988; Sugita et al., 1999; Gaillard, 2007; Gaillard et al., 2008). The pollen-vegetation relationship in percentages is not linear because of
5
the closed “universe” issue of percentage calculations and the effects of long-distance pollen from regional sources. There is always a part of the pollen assemblage that represents pollen coming from beyond the area considered for vegetation composition; therefore 0% and 100% of a taxon in the vegetation cover will not necessarily corre-spond to 0% and 100% pollen, respectively, of that taxon (e.g. Sugita et al., 1999;
10
Hellman et al., 2009).
In spite of the problems described above, earlier advances in the theory of pollen analysis (Andersen, 1970; Prentice, 1985; Sugita, 1994) have recently helped to de-velop a new framework of vegetation/land-cover reconstruction, the Landscape Re-construction Algorithm (LRA) (Sugita, 2007a, b). LRA solves the problems related with
15
the non-linear nature of pollen-vegetation relationships, and corrects for biases due to differences in 1) pollen dispersal and deposition properties between plant species, 2) landscape characteristics and species composition of vegetation, and 3) site size and type (bog or lake). The LRA consists of two separate models, REVEALS and LOVE (LOcal Vegetation Estimates), allowing vegetation abundance to be inferred from
20
pollen percentages at the regional (104–105km2area) and local (≤100 km2area)
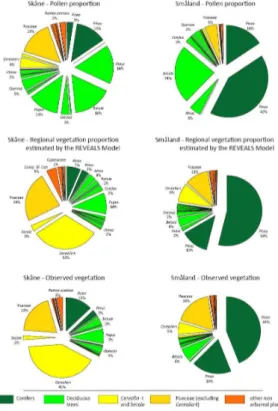
spa-tial scales, respectively. Extensive simulations support the theoretical premise of the LRA (Sugita, 1994, 2007a, b). The effectiveness of REVEALS and its two models has been empirically tested and shown to be satisfactory in southern Sweden (Hellman et al., 2008a, b) (Fig. 6), central Europe (Soepboer et al., 2010), and the upper Great
25
CPD
6, 307–346, 2010Holocene land-cover reconstructions
M.-J. Gaillard et al.
Title Page
Abstract Introduction
Conclusions References
Tables Figures
◭ ◮
◭ ◮
Back Close
Full Screen / Esc
Printer-friendly Version
Interactive Discussion
differences in pollen productivity (Bj ¨orse et al., 1996; Lindbladh et al., 2000), or 2) ap-plying the self-organized mapping method (neural networks) combined with “correction factors” (Holmqvist and Bradshaw, 2008).
The first REVEALS-based reconstructions of the Holocene vegetation in southern Sweden indicate that changes in human impact on vegetation/land-cover over the
5
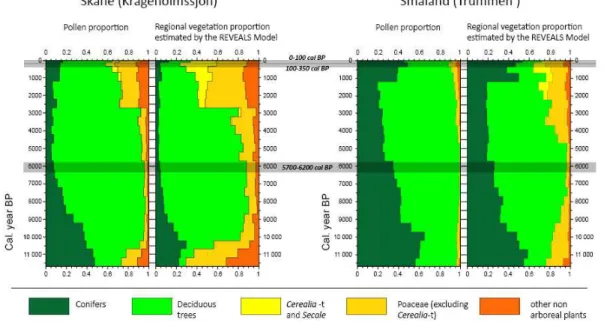
last 6000 years, as well as landscape openness during Early Holocene (11 500– 10 000 BP), were much more profound than changes in pollen percentages alone would suggest (Sugita et al., 2008) (Fig. 7). The share of unforested land through the Holocene is strongly underestimated by percentages of Non Arboreal Pollen (NAP, i.e. pollen from herbaceous plants). For instance, at the regional spatial scale, the
10
REVEALS estimates of openness represented by non-arboreal taxa during the last 3000 years reached 60–80% in the province of Sk ˚ane, and 25–40% in the province of Sm ˚aland (compared to 30–40% and 3–10% of NAP, respectively). The REVEALS re-construction of the regional vegetation of the Swiss Plateau for the past 2000 years also showed that the area of open land was underestimated by NAP percentages
(Soep-15
boer et al., 2010).
4 The LANDCLIM initiative and preliminary results
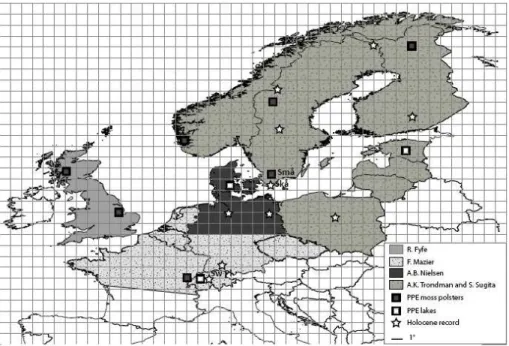
The LANDCLIM (LAND cover – CLIMate interactions in NW Europe during the Holocene) project and research network have three major aims. The first is to quantify human-induced changes in regional vegetation/land-cover in NW and W Europe N of
20
the Alps (Fig. 8) during the Holocene with the purpose to evaluate and further refine a dynamic vegetation model and a regional climate model. The second is to assess the possible effects on the climate development of two historical processes (compared with a baseline of present-day land cover), i.e. (1) climate-driven changes in vegetation, and (2) human-induced changes in land cover, e.g. via the influence of forested versus
25
CPD
6, 307–346, 2010Holocene land-cover reconstructions
M.-J. Gaillard et al.
Title Page
Abstract Introduction
Conclusions References
Tables Figures
◭ ◮
◭ ◮
Back Close
Full Screen / Esc
Printer-friendly Version
Interactive Discussion
identify areas or climate zones in which land use and vegetation changes may have had significant impacts on regional climate.
Accounting for land surface changes may be particularly important for regional cli-mate modelling, as the biophysical feedbacks operate at this scale and may be missed or underestimated at the coarse resolution of the Global Circulation Models (GCMs).
5
Dynamic Global Vegetation Models (DVMs) (Cramer et al., 2001; Prentice et al., 2007) have been coupled to GCMs to quantify vegetation – mainly carbon cycle – feedbacks on global climate (e.g. Cox et al., 2000; Friedlingstein et al., 2006). Current DVMs are necessarily highly generalized and tend to represent vegetation structure and func-tioning in abstract and rather simplified ways (e.g. Sitch et al., 2003). For
applica-10
tion at the regional scale, and to fully account for biophysical feedbacks on climate, a more detailed configuration of vegetation and processes governing its dynamics is needed (Smith et al., 2001; Wramneby et al., 2009). The LPJ (Lund Potsdam Jena) – GUESS (General Ecosystem Simulator) model (LPJ-GUESS, Smith et al., 2001) is a dynamic, process-based vegetation model optimized for application across a regional
15
grid that simulates vegetation dynamics based on climate data input. It represents land-scape and stand-scale heterogeneity and, by resolving horizontal and vertical vegeta-tion structure at these scales, more adequately accounts for the biophysical properties that influence regional climate variability.
The Rossby Centre Regional Atmospheric model version 3 (RCA3) is capable of
20
realistically simulating the European climate of the last couple of decades (Kjellstr ¨om et al., 2005; Samuelsson et al., 2010). RCA3 and its predecessors RCA1 and RCA2 have been extensively used for this kind of downscaling experiments for today’s climate and future climate change scenarios (Rummukainen et al., 1998; 2001; Jones et al., 2004; R ¨ais ¨anen et al., 2003; 2004; Kjellstr ¨om et al., 2010a). LPJ-GUESS has been
25
CPD
6, 307–346, 2010Holocene land-cover reconstructions
M.-J. Gaillard et al.
Title Page
Abstract Introduction
Conclusions References
Tables Figures
◭ ◮
◭ ◮
Back Close
Full Screen / Esc
Printer-friendly Version
Interactive Discussion
modify the future climate development, particularly in areas close to treelines and in semi-arid areas of Europe (Wramneby et al., 2009).
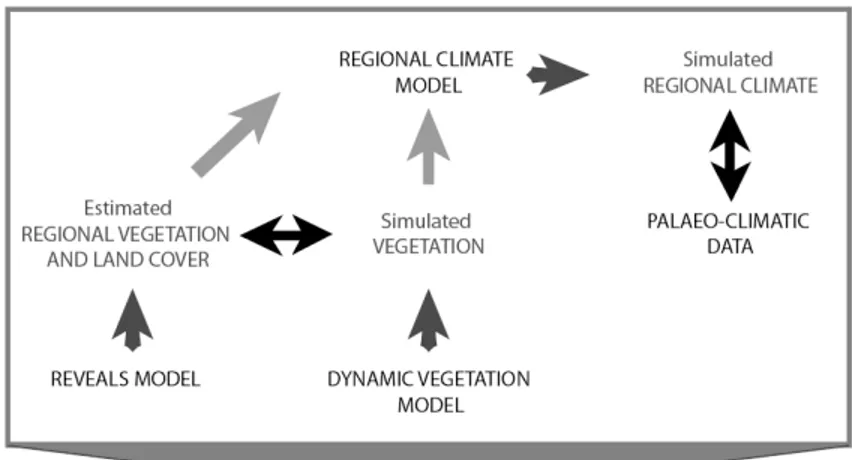
The aims of the LANDCLIM project will be achieved by applying a model-data com-parison scheme using the LPJ-GUESS, RCA3, and REVEALS models, as well as new syntheses of palaeoclimatic data (Fig. 9). The REVEALS estimates of the past cover
5
of plant functional types (PFTs) at a spatial resolution of 1◦
×1◦ will be 1) compared
with the outputs of GUESS (10 PFTs), and 2) used as an alternative to the LPJ-GUESS-simulated vegetation (3 PFTs) to run RCA3 for the recent past (0–100 cal BP) and two selected time windows of the Holocene with contrasting human-induced land-cover (100–350 cal BP and 5700–6200 cal BP). In a later stage of the project, two
10
additional time-windows will be included, 350–700 cal BP (Black Death) and 2700– 3200 cal BP (Late Bronze Age). The outputs of the RCA3 model will then be compared to the palaeoclimatic data. The REVEALS model estimates the percentage cover of species or taxa (group of species, genera, group of genera, or family). The species and taxa correspond to the pollen types that can be identified using pollen-morphological
15
characteristics. These species and taxa are ascribed to the PFTs used in the models as shown in Table 1. Moreover, we will generate time trajectories of land-cover changes for the entire Holocene in ten selected target areas of the project’s study region (Fig. 8) for comparison with long-term simulated vegetation dynamics from LPJ-GUESS. These target areas are defined by the location of very high-quality pollen records in terms of
20
chronology, pollen identification and time resolution of the pollen data.
REVEALS requires raw pollen counts, site radius, pollen productivity estimates (PPEs), and fall speed of pollen (FS) to estimate vegetation cover in percentages. Through the NordForsk POLLANDCAL network’s activities (Gaillard et al., 2008), the number of plant taxa for which PPEs and FS exist has increased in many parts of
25
CPD
6, 307–346, 2010Holocene land-cover reconstructions
M.-J. Gaillard et al.
Title Page
Abstract Introduction
Conclusions References
Tables Figures
◭ ◮
◭ ◮
Back Close
Full Screen / Esc
Printer-friendly Version
Interactive Discussion
in order to standardize the strategy and methods applied for the preparation of the pollen data and the REVEALS runs (Trondman et al., 2010). It includes instructions for both data contributors and users on 1) chronologies, 2) pollen taxa and harmoniza-tion with the PPEs available, and 3) number of pollen taxa and datasets of PPEs to use in alternative test runs. The pollen records are selected from pollen databases,
5
i.e. the European Pollen Database (EPD) (Fyfe et al., 2009), the PALYnological CZech database (PALYCZ) (Kuneˇs et al., 2009) and the ALpine PAlynological DAtaBAse (AL-PADABA). Additional published or unpublished records are obtained directly from the authors. Using the pollen records in PALYCZ and correlation tests, the effect on the RE-VEALS estimates of 1) basin type (lakes or bogs), 2) number of pollen taxa, 3) PPEs
10
dataset, and 4) number of dates per record used to establish the chronology (≥3 or≥5)
was evaluated (Mazier et al., 2010). The results showed that the REVEALS estimates are robust in terms of ranking of the PFTs’ abundance whatever alternatives for 1 to 4 above were used. The first REVEALS estimates produced are based on model runs using pollen records from both lakes and bogs, chronologies established with≥3 dates,
15
24 pollen taxa (entomophilous taxa excluded) and, for each pollen taxon, the mean of all PPEs available for that taxon in the study area (Trondman et al., 2010).
Examples of preliminary results for the Czech Republic are presented in three series of maps (Figs. 10 and 11). As expected, there are significant vegetation changes be-tween 6000 BP and 200 BP in particular forAbies(TBE 2; ca. 5–10 times larger cover
20
at 200 BP), summer-green trees (IBS and TBS; ca. 5 times larger cover at 6000 BP), grasslands (GL; ca. 5–10 times larger cover at 200 BP in many areas) and agricul-tural land (AL; 4 to 9 times larger cover at 200 BP in many areas) (Fig. 10). The maps of herbaceous PFTs (AL and GL) show significant changes in the degree of human-induced vegetation between the selected time windows, with the largest change
25
CPD
6, 307–346, 2010Holocene land-cover reconstructions
M.-J. Gaillard et al.
Title Page
Abstract Introduction
Conclusions References
Tables Figures
◭ ◮
◭ ◮
Back Close
Full Screen / Esc
Printer-friendly Version
Interactive Discussion
5 Implications and future directions
Palaeoenvironmental reconstructions are critical to provide predictive models of cli-mate and environmental changes with input data, and for model evaluation purposes. Climate models are becoming increasingly complex; they are composed of several modules, of which one shall represent a dynamic land biosphere. The latter is in turn
5
composed of a large number of “sub-models” (e.g. stomata, phenology, albedo, dy-namic land-cover, carbon flow, soil models). All the processes involved in these “sub-models” are influenced by natural and human-induced vegetation changes. Thus, the dynamic land-cover model should also account for anthropogenic land-cover change. It should be noted here that biophysical feedbacks from land-cover change were not
10
accounted for by the main IPCC climate models (2007).
The REVEALS model is proved to provide better estimates of the regional vegetation/land-cover changes, the open, the herb-dominated areas in particular, than the traditional use of pollen percentages and earlier attempts at correcting or cali-brating pollen data (e.g. Sugita, 2007a, Hellman et al., 2008a, b). Thus,
applica-15
tion of REVEALS opens up the possibility of achieving a more robust assessment of human-induced land cover at regional- to continental-spatial scale throughout the Holocene. The LANDCLIM project and NordForsk network are expected to provide valuable databases on the regional changes in vegetation/land-cover in northwestern Europe that will be useful to fine-tune LPJ-GUESS and evaluate RCA3.
20
LPJ-GUESS has been previously shown to be capable of reproducing patterns and time series of vegetation response to climate (e.g. Smith et al., 2001; Hickler et al., 2004; Miller et al., 2008). Sepp ¨a et al. (2009) compared assemblages ofPinus(pine),
Picea (spruce) and Betula (birch) inferred from Holocene pollen accumulation rates
(PARs) from two southern Finnish lakes with predictions of the biomass of these taxa
25
from LPJ-GUESS; a disagreement between the modelled and pollen-based vegetation
for Pinus after 2000 years BP was associated to a period of greater anthropogenic
CPD
6, 307–346, 2010Holocene land-cover reconstructions
M.-J. Gaillard et al.
Title Page
Abstract Introduction
Conclusions References
Tables Figures
◭ ◮
◭ ◮
Back Close
Full Screen / Esc
Printer-friendly Version
Interactive Discussion
it possible to further evaluate this assumption and the performance of LPJ-GUESS itself.
RCA3 was used earlier in palaeoclimatological contexts to simulate the north Euro-pean climate during more than 600 out of the last 1000 years (Moberg et al., 2006), for the Last Glacial Maximum (Strandberg et al., 2010), and for a cold stadial during
5
Marine Isotope Stage 3 (Kjellstr ¨om et al., 2010b). Simulations of Holocene climate for periods older than 1000 BP and fine-tuning the coupled land-cover properties in RCA3 as planned in the LANDCLIM project might contribute to further improve the robustness of the model. Moreover, RCA3 is currently applied in other parts of the world (Africa, the Arctic, South and North America), and the results show that the model is capable
10
of simulating the climate in a range of different climate zones throughout the world. This implies that the approach of the LANDCLIM project can be applied in the future to other regions than Europe.
REVEALS-based land-cover reconstructions will be informative for evaluating other hypotheses that involve land cover-climate feedbacks. Many studies have focused on
15
the effects of land-use change on global-scale fluxes of carbon from terrestrial ecosys-tems (e.g. DeFries et al., 1999; McGuire et al., 2001; Houghton, 2003; Campos et al., 2003). However, these earlier estimates never go back in time beyond AD 1700, and estimated ALCC was mostly extracted from the digital HYDE database version 2.0. The studies to date that do consider the effects of ALCC on the terrestrial carbon
bud-20
get on longer time scales, including those by Claussen et al. (2005) and Olofsson and Hickler (2008), agree in the suggestion that the magnitude of past changes in terres-trial carbon balance associated with human land-use are far too small to account for a major dampening (or enhancement) of global climate variations (e.g. the Ruddiman’s hypothesis; Ruddiman, 2003, 2005). On the other hand, a recent data-base synthesis
25
CPD
6, 307–346, 2010Holocene land-cover reconstructions
M.-J. Gaillard et al.
Title Page
Abstract Introduction
Conclusions References
Tables Figures
◭ ◮
◭ ◮
Back Close
Full Screen / Esc
Printer-friendly Version
Interactive Discussion
Age cold period (Nevle and Bird, 2008). These contrasting results emphasize the need for empirical data of past land-cover such as the REVEALS model-based reconstruc-tions, which might help to fine-tune descriptions of past land-cover and gain improved knowledge on how long-term changes in ALCC might have influenced climate. The LANDCLIM results are expected to provide crucial data to reassess ALCC estimates
5
(e.g. Olofsson and Hickler, 2008; Pongratz et al., 2008; Kaplan et al., 2009; Lemmen, 2009) and a better understanding of the land surface-atmosphere interactions at the regional spatial scale. Although biophysical exchanges operate at the local to regional scale, the feedbacks can have consequences elsewhere, through remote adjustments in temperatures, cloudiness and rainfall by means of circulation changes (Dekker et al.,
10
2007). Comparison between studies of land cover-climate feedbacks at both regional and global spatial scales will increase our understanding of climate change.
Pollen-based reconstruction of vegetation and land-cover changes needs further col-laboration for compilation of reliable land-cover databases. The REVEALS model is a useful tool for this task, in addition to the currently available methods (e.g. Williams
15
et al., 2008). Reconstruction of the regional vegetation/land cover for Norway, Swe-den, Finland, Denmark, Estonia, Britain, Poland, the Czech Republic, Switzerland and Germany is currently underway within the LANDCLIM project and network. Pollen pro-ductivity estimates (PPEs) of open-land plants and major tree taxa, important parame-ters necessary to run REVEALS, are still limited outside NW Europe (Brostr ¨om et al.,
20
2008), North America (Sugita et al., 2010) and South Africa (Duffin and Bunting, 2008); however, new studies are currently underway in Japan, China, and Africa (Camer-oun), and more to come within the Focus 4 (Past Human-Climate-Ecosystem Interac-tions; PHAROS) of the International Geosphere-Biosphere Programme – Past Global Changes (IGBP PAGES). We expect that more objective descriptions of past land-cover
25
CPD
6, 307–346, 2010Holocene land-cover reconstructions
M.-J. Gaillard et al.
Title Page
Abstract Introduction
Conclusions References
Tables Figures
◭ ◮
◭ ◮
Back Close
Full Screen / Esc
Printer-friendly Version
Interactive Discussion
Acknowledgements. The LANDCLIM (LAND cover – CLIMate interactions in NW Europe
dur-ing the Holocene) project and research network are sponsored by the Swedish Science (VR) and Nordic (NordForsk) Research Councils, respectively) and coordinated by Marie-Jos ´e Gail-lard. The two initiatives are a contribution to the IGBP-PAGES-Focus 4 PHAROS programme (http://www.pages-igbp.org/science/focus4) on human impact on environmental changes in
5
the past. Marie-Jos ´e Gaillard thanks Frank Oldfield and John Dearing for their interest in the work performed within the NordForsk POLLANDCAL and LANDCLIM networks, and their ever-lasting support through the years. The authors are also grateful to all members of the LANDCLIM network and Michelle Leydet (manager of the European Pollen Database, EPD), who contributed – and will contribute – pollen data and the information needed to apply
RE-10
VEALS, as well as Ralph Fyfe (University of Plymouth) and Anne-Birgitte Nielsen (University of G ¨ottingen) for helping with the selection of sites and running REVEALS in Britain and the Denmark-northern Germany area, respectively. Other funding sources include the Faculty of Natural Sciences and Technology of the Linnaeus University (Kalmar-V ¨axj ¨o, Sweden) for Gail-lard and Trondman, the Estonian Science Foundation (MTT3) for Sugita, the German National
15
Science Foundation (DFG priority program Interdynamik) for Lemmen, and the VR Linnaeus grant “Lund Centre for studies of Carbon Cycle and Climate Interaction, LUCCI” (grant number: VR 349-2007-8705) for Mazier.
20
CPD
6, 307–346, 2010Holocene land-cover reconstructions
M.-J. Gaillard et al.
Title Page
Abstract Introduction
Conclusions References
Tables Figures
◭ ◮
◭ ◮
Back Close
Full Screen / Esc
Printer-friendly Version
Interactive Discussion
References
Andersen, S. T.: The Relative Pollen Productivity and Pollen Representation of North European Trees, and Correction Factors for Tree Pollen Spectra, Determined by Surface Pollen Analy-ses from Forests, Geological Survey of Denmark, II Series, 96, C. A. Reitzels, Copenhagen, 96 pp., 1970.
5
Anderson, J., Bugmann, H., Dearing, J. A., and Gaillard, M.-J.: Linking palaeoenvironmental data and models to understand the past and to predict the future, Trends. Ecol. Evol., 21(12), 696–704, 2006.
Bala, G., Caldeira, K., Wickett, M., Phillips, T. J., Lobell, D. B., Delire, C., and Mirin, A.:
Com-bined climate and carbon-cycle effects of large-scale deforestation, in: Proceedings of the
10
National Academy of Sciences, USA, 104, 6550–6555, 2007.
Betts, R.: Offset of the potential carbon sink from boreal forestation by decreases in surface
albedo, Nature, 408, 187–190, 2000.
Bj ¨orse, G., Bradshaw, R. H. W., and Michelson, D. B.: Calibration of regional pollen data to construct maps of former forest types in southern Sweden, J. Paleolimnol., 16, 67–78, 1996.
15
Beug, H. J.: Leitfaden der Pollenbestimmung f ¨ur Mitteleuropa und angrenzende Gebiete, Verlag Dr. Friedrich Pfeil, M ¨unchen, 2004.
Bradshaw, R. H. W.: Modern pollen representation factors for woods in South-West England, J. Ecol., 69, 45–70, 1981.
Brostr ¨om, A., Sugita, S., and Gaillard, M.-J.: Pollen productivity estimates for the reconstruction
20
of past vegetation cover in the cultural landscape of southern Sweden, Holocene, 14(3), 368–381, 2004.
Brostr ¨om, A., Nielsen, A. B., Gaillard, M.-J., Hjelle, K., Mazier, F., Binney, H., Bunting, J., Fyfe, R., Meltsov, V., Poska, A., R ¨as ¨anen, S., Soepboer, W., von Stedingk, H., Suutari, H., and Sugita, S.: Pollen productivity estimates – the key to landscape reconstructions, Veg. Hist.
25
Archaeobot., 17, 461–478, 2008.
Brovkin, V., Claussen, M., Driesschaert, E., Fichefet, T., Kicklighter, D., Loutre, M. F., Matthews,
H. D., Ramankutty, N., Schaeffer, M., and Sokolov, A.: Biogeophysical effects of historical
land cover changes simulated by six Earth system models of intermediate complexity, Clim. Dynam., 26(6), 587–600, 2006.
CPD
6, 307–346, 2010Holocene land-cover reconstructions
M.-J. Gaillard et al.
Title Page
Abstract Introduction
Conclusions References
Tables Figures
◭ ◮
◭ ◮
Back Close
Full Screen / Esc
Printer-friendly Version
Interactive Discussion
Campos, C. P., Muylaert, M. S., and Rosa, L. P.: Historical CO2 emission and concentrations
due to land use change of croplands and pastures by country, Sci. Total. Environ., 346, 149–155, 2003.
Claussen, M., Brovkin, V., Calov, R., Ganopolski, A., and Kubatzki, C.: Did humankind prevent a holocene glaciation? Comment on Ruddiman’s hypothesis of a pre-historic anthropocene,
5
Climatic Change, 69, 409–417, 2005.
Cox, P. M., Betts, R. A., Jones, C. D., Spall, S. A., and Totterdell, I. J.: Acceleration of global warming due to carbon-cycle feedbacks in a coupled climate model, Nature, 408, 184–187, 2000.
Cox, P. M., Betts, R. A., Collins, M., Harris, P. P., Huntingford, C., and Jones, C. D.:
Amazo-10
nian forest dieback under climate-carbon cycle projections for the 21st century, Theor. Appl. Climatol., 78, 137–156, 2004.
Cramer, W., Bondeau, A., Woodward, F. I., Prentice, I. C., Betts, R. A., Brovkin, V., Cox, P. M., Fisher, V., Foley, J. A., Friend, A. D., Kucharik, C., Lomas, M. R., Ramankutty, N., Sitch, S., Smith, B., White, A., and Young-Molling, C.: Global response of terrestrial ecosystem
15
structure and function to CO2and climate change: results from six dynamic global vegetation
models, Glob. Change Biol., 7, 357–373, 2001.
Dearing, J. A.: Climate-human-environment interactions: resolving our past, Clim. Past, 2, 187–203, 2006, http://www.clim-past.net/2/187/2006/.
Denman, K. L., Brasseur, G., Chidthaisong, A., Ciais, P., Cox, P. M., Dickinson, R. E.,
Hauglus-20
taine, D., Heinze, C., Holland, E., Jacob, D., Lohmann, U., Ramachandran, S., da Silva Dias, P. L., Wofsy, S. C., and Zhang, X.: Couplings between changes in the climate system and biogeochemistry, in: Climate change 2007: The Physical Science Basis, Contribution of Working Group I to the Fourth Assessment Report of the Intergovernmental Panel on Cli-mate Change (IPCC), edited by: Solomon, S., Qin, D., Manning, M., Chen, Z., Marquis, M.,
25
Averyt, K. B., Tignor, M., and Miller, H. L., Cambridge University Press, Cambridge, UK and New York, NY, USA, 499–587, 2007.
DeFries, R. S., Field, C. B., Fung, I., Collatz, G. J., and Bounoua, L.: Combining satellite data
and biogeochemical models to estimate global effects of human-induced land cover change
on carbon emissions and primary productivity, Global. Biogeochem. Cy., 13, 803–815, 1999.
30
CPD
6, 307–346, 2010Holocene land-cover reconstructions
M.-J. Gaillard et al.
Title Page
Abstract Introduction
Conclusions References
Tables Figures
◭ ◮
◭ ◮
Back Close
Full Screen / Esc
Printer-friendly Version
Interactive Discussion
Duffin, K. and Bunting, M. J.: Relative pollen productivity and fall speed estimates for southern
African savanna taxa, Veg. Hist. Archaeobot., 17, 507–525, 2008.
Foley, J. A., Costa, M. H., Delire, C., Ramankutty, N., and Snyder, P.: Green surprise? How
terrestrial ecosystems could affect earth’s climate, Front. Ecol. Environ., 1, 38–44, 2003.
Friedlingstein, P., Cox, P., Betts, R., Bopp, L., von Bloh, W., Brovkin, V., Cadule, P., Doney,
5
S., Eby, M., Fung, I., Bala, G., John, J., Jones, C., Joos, F., Kato, T., Kawamiya, M., Knorr, W., Lindsay, K., Matthews, H. D., Raddatz, T., Rayner, P., Reick, C., Roeckner, E., Snitzler, K.-G., Schnur, R., Strassmann, K., Weaver, A. J., Yoshikawa, C., and Zeng, N.: Climate-carbon cycle feedback analysis: Results from the C4MIP model intercomparison, J. Clim., 19, 3337–3353, 2006.
10
Fyfe, R. M., de Beaulieu, J.-L., Binney, H., Bradshaw, R. H. W., Brewer, S., Le Flao, A., Finsinger, W., Gaillard, M.-J., Giesecke, T., Gil-Romera, G., Grimm, E. C., Huntley, B., Kuneˇs, P., K ¨uhl, N., Leydet, M., Lotter, A. F., Tarasov, P. E., and Tonkov, S.: The European Pollen
Database: past efforts and current activities, Veg. Hist. Archaeobot., 18(5), 417–424, 2009.
Gaillard, M.-J.: Detecting Human impact in the pollen record, in: Encyclopedia of Quaternary
15
Science, edited by: Elias, S. A., Elsevier, University of London, 2570–2595, 2007.
Gaillard, M.-J., Dutoit, T., Hjelle, K., Koff, T., and O’Connell, M.: European cultural landscapes: insights into origins and development, in: Cultural Landscapes of Europe, edited by: Krzy-winski, K., O’Connell, M., and K ¨uster, H., Aschenbeck Media, Bremen, 35–46, 2009. Gaillard, M.-J., Sugita, S., Bunting, M. J., Dearing, J. A., and Bittmann, F.: Human impact on
20
terrestrial ecosystems, pollen calibration and quantitative reconstruction of past land-cover, Veg. Hist. Archaeobot., 17, 415–418, 2008.
Hellman, S., Bunting, M. J., and Gaillard, M.-J.: Relevant Source Area of Pollen in patchy cultural landscapes and signals of anthropogenic landscape disturbance in the pollen record: A simulation approach, Rev. Palaeobot. Palyno., 153, 245–258, 2009.
25
Hellman, S., Gaillard, M.-J., Brostr ¨om, A., and Sugita, S.: The REVEALS model, a new tool to estimate past regional plant abundance from pollen data in large lakes – validation in southern Sweden, J. Quaternary Sci., 23(1), 21–42, 2008a.
Hellman, S., Gaillard, M.-J., Brostr ¨om, A., and Sugita, S.: Effects of the sampling design and
selection of parameter values on pollen-based quantitative reconstructions of regional
vege-30
CPD
6, 307–346, 2010Holocene land-cover reconstructions
M.-J. Gaillard et al.
Title Page
Abstract Introduction
Conclusions References
Tables Figures
◭ ◮
◭ ◮
Back Close
Full Screen / Esc
Printer-friendly Version
Interactive Discussion Holmqvist, B. H. and Bradshaw, R. H. W.: Classification of large pollen data sets using
unsu-pervised neural networks, Ecol. Model., in review, 2010.
Houghton, R. A.: Revised estimates of the annual net flux of carbon to the atmosphere from changes in land use and land management 1850–2000, Tellus, 55B, 378–390, 2003. Jones, C. G., Ullerstig, A., Will ´en, U., and Hansson, U.: The Rossby Centre Regional
At-5
mospheric Model (RCA): Part I: Model climatology and performance characteristics for the present climate over Europe, Ambio, 33(4–5), 199–210, 2004.
Kaplan, J., Krumhardt, K., and Zimmermann, N.: The prehistoric and preindustrial deforestation of Europe, Quaternary Sci. Rev., 28, 3016–3034, 2009.
Kjellstr ¨om, E., D ¨oscher, R., and Meier, H. E. M.: Atmospheric response to different sea surface
10
temperatures in the Baltic Sea: Coupled versus uncoupled regional climate model experi-ments, Nord. Hydrol., 36(4–5), 397–409, 2005.
Kjellstr ¨om, E., Nikulin, G., Hansson, U., Strandberg, G., and Ullerstig, A.: 21st century changes in the European climate: uncertainties derived from an ensemble of regional climate model simulations, Tellus A, submitted, 2010a.
15
Kjellstr ¨om, E., Brandefelt, J., N ¨aslund, J. O., Smith, B., Strandberg, G., Voelker, A. H. L., and Wohlfarth, B.: Simulated climate conditions in Fennoscandia during a MIS3 stadial, Boreas, in review, 2010b.
Klein Goldewijk, K.: Estimating global land use change over the past 300 years: The HYDE Database, Global Biogeochem, Cy., 15, 417–433, 2001.
20
Klein Goldewijk, K., Bouwman, A. F., and van Drecht, G.: Mapping contemporary global crop-land and grasscrop-land distributions on a 5 by 5 minute resolution, Journal of Land Use Science, 2(3), 167–190, 2007.
Klein Goldewijk, K., Beusen, A., and Janssen, P.: Long term dynamic modeling of global popu-lation and built-up area in a spatially explicit way, HYDE 3.1, The Holocene, in press, 2010.
25
Krumhardt, K. M., Lemmen, C., and Kaplan, J. O. A.: Global dataset of human population and urbanization over the Holocene, in preparation, 2010.
Krzywinski, K., O’Connell, M., and K ¨uster, H. (Eds): Cultural Landscapes of Europe, Aschen-beck Media, Bremen, 218 pp., 2009.
Kuneˇs, P., Abraham, V., Kov ´a´ık, O., Kopeck´y, M., and PALYCZ contributors: Czech Quaternary
30
CPD
6, 307–346, 2010Holocene land-cover reconstructions
M.-J. Gaillard et al.
Title Page
Abstract Introduction
Conclusions References
Tables Figures
◭ ◮
◭ ◮
Back Close
Full Screen / Esc
Printer-friendly Version
Interactive Discussion Kutzbach, J. E., Bartlein, P. J., Foley, J. A., Harrison, S. P., Hostetler, S. W., Liu, Z., Prentice,
I. C., and Webb III, T.: Potential role of vegetation feedback in the climate sensitivity of high-latitude regions: a case study at 6000 Years BP, Global Biogeochem. Cy., 10, 727–736, 1996.
Lemmen, C.: World distribution of land cover changes during Pre- and Protohistoric Times and
5
estimation of induced carbon releases, G ´eomorphologie, 2009(4), 303–312, 2009.
Lewthwaite, J. W. and Sherratt, A.: Chronological Atlas, in: Cambridge Encyclopedia of Arche-ology, edited by: Sherratt, A., Cambridge University Press, Cambridge, 437–452, 1980. Lindbladh, M., Bradshaw, R., and Holmqvist, B. H.: Pattern and process in south Swedish
forests during the last 3000-years sensed at stand and regional scales, J. Ecol., 88(1), 113–
10
128, 2000.
Meehl, G. A., Stocker, T. F., Collins, W., Friedlingstein, P., Gaye, A., Gregory, J., Kitoh, A., Knutti, R., Murphy, J., Noda., A., Raper, S., Watterson., I., Weaver, A., and Ci Zhao, Z.: Global Climate projections, in: Climate Change 2007: The Science Basis. Contribution of Working Group I to the Fourth Assessment Report of the Intergovernmental Panel on Climate
15
Change, edited by: Solomon, S., Qin, D., Manning, M., Chen, Z., Marquis, M., Averyt, K. B., Tignor, M., and Miller, H. L., Cambridge University Press, Cambridge, UK and New York, NY, USA, 747–845, 2007.
Mazier, F., Kuneˇs, P., Sugita, S., Trondman, A.-K., Brostr ¨om, A., and Gaillard, M.-J.: Pollen-inferred quantitative reconstructions of Holocene land-cover in NW Europe for the evaluation
20
of past climate-vegetation feedbacks –Evaluation of the REVEALS-based reconstruction us-ing the Czech Republic database, J. Quaternary Sci, in preparation, 2010.
McEvedy, C. and Jones, R.: Atlas of world population history, Puffin Books, Harmondsworth,
Middlesex, London, England, 368 pp., 1978.
McGuire, A. D., Sitch, S., Clein, J. S., Dargaville, R., Esser, G., Foley, J., Heimann, M., Joos,
25
F., Kaplan, J., Kicklighter, D. W., Meier, R. A., Melillo, J. M., Moore III, B., Prentice, I. C., Ramankutty, N., Reichenau, T., Schloss, A., Tian, H., Williams, L. J., and Wittenberg, U.:
Carbon balance of the terrestrial biosphere in the twentieth century: Analysis of CO2, climate
and land use effects with four process-based ecosystem models, Global Biogeochem. Cy.,
15, 183–206, 2001.
30
CPD
6, 307–346, 2010Holocene land-cover reconstructions
M.-J. Gaillard et al.
Title Page
Abstract Introduction
Conclusions References
Tables Figures
◭ ◮
◭ ◮
Back Close
Full Screen / Esc
Printer-friendly Version
Interactive Discussion
Nevle, R. J. and Bird, D. K.: Effects of syn-pandemic fire reduction and reforestation in the
tropical Americas on atmospheric CO2 during European conquest, Palaeogeogr. Paleocl.,
264, 25–38, 2008.
Olofsson, J. and Hickler, T.: Effects of human land-use on the global carbon cycle during the
last 6000 years, Veg. Hist. Archaeobot., 17(5), 605–615, 2008.
5
Pongratz, J., Reick, C., Raddatz, T., and Claussen, M.: A reconstruction of global agricul-tural areas and land cover for the last millennium, Global Biogeochem. Cy., 22, GB3018, doi:10.1029/2007GB003153, 2008.
Prentice, I. C.: Pollen representation, source area, and basin size: Toward a unified theory of pollen analysis, Quaternary Res., 23(1), 76–86, 1985.
10
Prentice, I. C.: Records of vegetation in time and space: the principles of pollen analysis, in: Vegetation history, edited by: Huntley, B. and Webb, T., Kluwer Academic Publishers, Dordrecht, Netherlands, 17–42, 1988.
Prentice, I. C., Jolly, D., and BIOME 6000 Participants: Mid-Holocene and glacial-maximum vegetation geography of the northern continents and Africa, J. Biogeogr., 27, 507–519,
15
2000.
Prentice, I. C., Bondeau, A., Cramer, W., Harrison, S. P., Hickler, T., Lucht, W., Sitch, S., Smith, B., and Sykes, M. T.: Dynamic global vegetation modelling: quantifying terrestrial ecosystem responses to large-scale environmental change, in: Terrestrial Ecosystems in a Changing World, edited by: Canadell, J. G., Pataki, D. E., and Pitelka, L. F., Springer Verlag, Berlin,
20
175–192, 2007.
Punt, W.: The Northwest European Pollen Flora I-VIII, Elsevier Scientific, Amsterdam, 1976– 2003.
R ¨ais ¨anen, J., Hansson, U., Ullerstig, A., D ¨oscher, R., Graham, L. P., Jones, C., Meier, M., Samuelsson, P., and Will ´en, U.: GCM driven simulations of recent and future climate with
25
the Rossby Centre coupled atmosphere – Baltic Sea regional climate model RCAO, Reports Meteorology and Climatology 101, Norrk ¨oping, Sweden, SMHI, 2003.
R ¨ais ¨anen, J., Hansson, U., Ullerstieg, A., D ¨oscher, R., Graham, L. P., Jones, C., Meier, H. E. M., Samuelsson, P., and Will ´en, U.: European climate in the late 21st century: regional simulations with two driving global models and two forcing scenaios, Clim. Dynam., 22, 13–
30
31, 2004.
CPD
6, 307–346, 2010Holocene land-cover reconstructions
M.-J. Gaillard et al.
Title Page
Abstract Introduction
Conclusions References
Tables Figures
◭ ◮
◭ ◮
Back Close
Full Screen / Esc
Printer-friendly Version
Interactive Discussion Ruddiman, W. F.: The Anthropogenic Greenhouse Era Began Thousands of Years Ago,
Cli-matic Change, 61, 261–293, 2003.
Ruddiman, W. F.: The early anthropogenic hypothesis a year later, Climatic Change, 69, 427– 434, 2005.
Rummukainen, M., R ¨ais ¨anen, J., Ullerstig, A., Bringfelt, B., Hansson, U., Graham, P., and
5
Will ´en, U.: RCA – Rossby Centre regional Atmospheric climate model: model description and results from the first multi-year simulation, Reports Meteorology and Climatology No. 83, Swedish Meteorological and Hydrological Institute, Norrk ¨oping, Sweden, 76 pp., 1998. Rummukainen, M., R ¨ais ¨ainen, J., Bringfelt, B., Ullerstig, A., Omstedt, A., et al.: A regional
climate model for northern Europe: model description and results from the downscaling of
10
two GCM control simulations, Clim. Dyn., 17, 339–359, 2001.
Samuelsson, P., Gollvik, S., Hansson, U., Jones, C., Kjellstr ¨om, E., Nikulin, G., Ullerstig, A., Will ´en, U., and Wyser, K.: The Rossby Centre Regional Climate Model RCA3: Model de-scription and performance, Tellus A, submitted, 2010.
Sellers, P. J., Dickinson, R. E., Randall, D. A., Betts, A. K., Hall, F. G., Berry, J. A., Collatz,
15
G. J., Denning, A. S., Mooney, H. A., Nobre, C. A., Sato, N., Field, C. B., and Henderson-Sellers, A.: Modeling the Exchange of Energy, Water, and Carbon between Continents and the Atmosphere, Science, 275, 502–509, 1997.
Sepp ¨a, H., Alenius, T., Muukonen, P., Giesecke, T., Miller, P. A., and Ojala, A. E. K.: Calibrated pollen accumulation rates as a basis for quantitative tree biomass reconstructions, Holocene,
20
19, 209–220, 2009.
Sitch, S., Smith, B., Prentice, I. C., Arneth, A., Bondeau, A., Cramer, W., Kaplan, J. O., Levis, S., Lucht, W., Sykes, M. T., Thonicke, K., and Venevsky, S.: Evaluation of ecosystem dynamics, plant geography and terrestrial carbon cycling in the LPJ dynamic global vegetation model, Glob. Change Biol. 9, 161–185, 2003.
25
Smith, B., Prentice, I. C., and Sykes, M. T.: Representation of vegetation dynamics in modelling of terrestrial ecosystems: comparing two contrasting approaches within European climate space, Global Ecol. Biogeogr., 10, 621–637, 2001.
Soepboer W., Sugita, S., and Lotter A.: Regional vegetation-cover changes on the Swiss Plateau during the past two millennia: A pollen-based reconstruction using the REVEALS
30
model, Quaternary Sci. Rev., 29(3–4), 472–483, 2010.
CPD
6, 307–346, 2010Holocene land-cover reconstructions
M.-J. Gaillard et al.
Title Page
Abstract Introduction
Conclusions References
Tables Figures
◭ ◮
◭ ◮
Back Close
Full Screen / Esc
Printer-friendly Version
Interactive Discussion Sugita, S.: Pollen representation of vegetation in quaternary sediments: theory and method in
patchy vegetation, J. Ecol., 82, 881–897, 1994.
Sugita, S.: Theory of quantitative reconstruction of vegetation. I: Pollen from large lakes RE-VEALS regional vegetation composition, Holocene, 17(2), 229–241, 2007a.
Sugita, S.: Theory of quantitative reconstruction of vegetation II: all you need is LOVE,
5
Holocene, 17(2), 243–257, 2007b.
Sugita, S., Gaillard, M.-J., and Brostr ¨om, A.: Landscape openness and pollen records: a simu-lation approach, Holocene, 9, 409–421, 1999.
Sugita, S., Gaillard, M.-J., Hellman, S., and Brostr ¨om, A.: Model-based reconstruction of veg-etation and landscape using fossil pollen, in: Layers of Perception, Kolloquien zur Vor- und
10
Fr ¨uhgeschichte Vol. 10, Bonn, Germany, 385–391, 2008.
Sugita, S., Parshall, T., Calcote, R., and Walker, K.: Testing Landscape Reconstruction Algo-rithm for spatially-explicit reconstruction of vegetation in northern Michigan and Wisconsin, Quaternary Res., in review, 2010.
Tarasov,, P., Williams, J. W., Andreev, A., Nakagawa, T.,Bezrukova, E., Herzschuh, U., Igarashi,
15
Y., M ¨uller, S.,Werner, K., and Zheng, Z.: Satellite- and pollen-based quantitative woody cover reconstructions for northern Asia: Verification and application to late Quaternary pollen data, Earth. Planet. Sc. Lett., 264(1–2), 284–298, 2007.
Trondman A.-K., Gaillard, M.-J., Mazier, F., Sugita, S., Alenius, T., Bjune, A., Kangur, M., Lat-alowa, M., and Leydet, M.: Pollen-inferred quantitative reconstructions of Holocene
land-20
cover in NW Europe for the evaluation of past climate-vegetation feedbacks – Protocol of the LANDCLIM project and the example of Sweden, Holocene, in preparation, 2010.
van der Linden, P. and Mitchell, J. F. B. (Eds.): ENSEMBLES: Climate change and its impacts:
Summary of research and results from the ENSEMBLES project, Met Office Hadley Centre,
FitzRoy Road, Exeter EX1 3PB, UK, 160 pp., 2009.
25
Vitousek, P. M., Mooney, H. A., Lubchenco, J., and Melillo, J. M.: Human domination of Earth’s ecosystems, Science, 277, 494–499, 1997.
Williams, J. W., Gonzales, L. M., and Kaplan, J. O.: Leaf area index for northern and east-ern North America at the Last Glacial Maximum: a data-model comparison, Global Ecol. Biogeogr., 17, 122–134, 2008.
30
CPD
6, 307–346, 2010Holocene land-cover reconstructions
M.-J. Gaillard et al.
Title Page
Abstract Introduction
Conclusions References
Tables Figures
◭ ◮
◭ ◮
Back Close
Full Screen / Esc
Printer-friendly Version
Interactive Discussion Wirtz, K. W., Bernhardt, K., Lohmann, G., and Lemmen, C.: Mid-Holocene regional
reorgani-zation of climate variability, Clim. Past Discuss., 5, 287–326, 2009, http://www.clim-past-discuss.net/5/287/2009/.
Wolf, A., Callaghan, T. V., and Larson, K: Future changes in vegetation and ecosystem function of the Barents Region, Climatic Change, 87, 51–73, 2008.
5
CPD
6, 307–346, 2010Holocene land-cover reconstructions
M.-J. Gaillard et al.
Title Page
Abstract Introduction
Conclusions References
Tables Figures
◭ ◮
◭ ◮
Back Close
Full Screen / Esc
Printer-friendly Version
Interactive Discussion
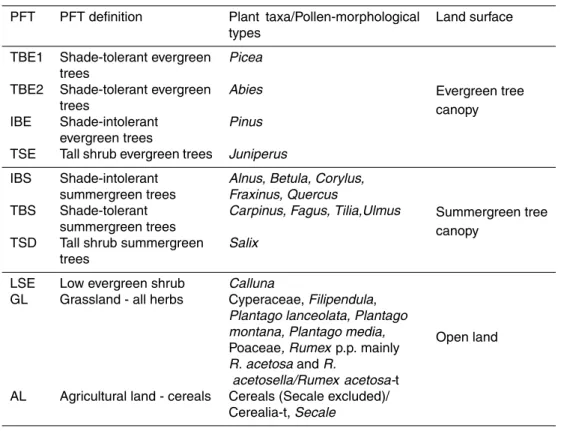
Table 1. PFTs used in the LANDCLIM project (see text for more explanations). The ten PFTs in the left column and the three land-surface types in the right column are used in the dynamic vegetation model LPJ-GUESS and the regional climate model RCA3, respectively. The PFTs are a simplification of the PFTs described in Wolf et al. (2008). The corresponding plant taxa for which REVEALS reconstructions are performed in the project are indicated in the middle column. These plant taxa have characteristic pollen-morphological types; when the latter corresponds to a botanical taxon, it has the same name; if not, it is indicated by the extension “–t”. t=type. Rumex acetosa-t includes many species ofRumex(see Punt et al., 1976–2003 for more details); Cerealia-type includes pollen grains of cereals ≥37 µm includingTriticum-t.,Avena-t.,Hordeum-t. according to Beug (2004). Each of these types include several cereal species and some species of wild grasses (see Beug, 2004 for more details).
PFT PFT definition Plant taxa/Pollen-morphological types
Land surface
TBE1 Shade-tolerant evergreen trees
Picea
Evergreen tree TBE2 Shade-tolerant evergreen
trees
Abies
canopy IBE Shade-intolerant
evergreen trees
Pinus
TSE Tall shrub evergreen trees Juniperus
IBS Shade-intolerant summergreen trees
Alnus, Betula, Corylus, Fraxinus, Quercus
Summergreen tree TBS Shade-tolerant
summergreen trees
Carpinus, Fagus, Tilia,Ulmus
canopy TSD Tall shrub summergreen
trees
Salix
LSE Low evergreen shrub Calluna
Open land GL Grassland - all herbs Cyperaceae,Filipendula,
Plantago lanceolata, Plantago montana, Plantago media,
Poaceae, Rumexp.p. mainly
R. acetosaandR.
acetosella/Rumex acetosa-t AL Agricultural land - cereals Cereals (Secale excluded)/
CPD
6, 307–346, 2010Holocene land-cover reconstructions
M.-J. Gaillard et al.
Title Page
Abstract Introduction
Conclusions References
Tables Figures
◭ ◮
◭ ◮
Back Close
Full Screen / Esc
Printer-friendly Version
Interactive Discussion
Fig. 1. Decrease in mean global temperature over the Northern Hemisphere due to the biophysical feedback (increased albedo) of an estimated decrease in forest cover between
AD 1000 and 2000 as simulated by six different climate models (see details on the climate
models in Brovkin et al., 2006). Land-use changes were based on HYDE (History Database of the Global Environment) version 2.0 for the period AD 1700–2000, and on a constant rate of decrease in forest cover between 1000 and 1700 (from Brovkin et al., 2006; modified).
CPD
6, 307–346, 2010Holocene land-cover reconstructions
M.-J. Gaillard et al.
Title Page
Abstract Introduction
Conclusions References
Tables Figures
◭ ◮
◭ ◮
Back Close
Full Screen / Esc
Printer-friendly Version
Interactive Discussion
Fig. 2. Reconstructions of the spatial extent of permanent and non-permanent agriculture for seven time slices of the Holocene (modified from Olofsson and Hickler, 2008). The
reconstruc-tions are based on archeological maps of the spread of different societal forms, (HYDE [History
Database of the Global Environment] version 2.0) for the last 300 years, global changes in population, and an estimate of land suitability (see text for more information).
CPD
6, 307–346, 2010Holocene land-cover reconstructions
M.-J. Gaillard et al.
Title Page
Abstract Introduction
Conclusions References
Tables Figures
◭ ◮
◭ ◮
Back Close
Full Screen / Esc
Printer-friendly Version
Interactive Discussion 0o 30oE 60oE 90oE 120oE
40oS 20oS 0o 20oN 40oN 60oN
GluesCropfraction
5000 BC
0o 30oE 60oE 90oE 120oE S
S N N N
GluesCropfraction
2000 BC
0 3 6 9 12 15
%
CPD
6, 307–346, 2010Holocene land-cover reconstructions
M.-J. Gaillard et al.
Title Page
Abstract Introduction
Conclusions References
Tables Figures
◭ ◮
◭ ◮
Back Close
Full Screen / Esc
Printer-friendly Version
Interactive Discussion
857
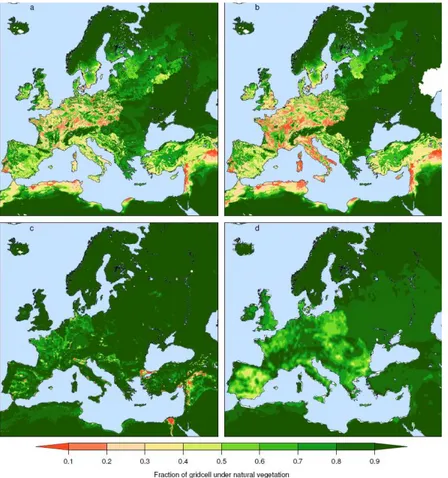
Fig. 4.Anthropogenic land use in Europe and surrounding areas at AD 800 simulated by four
different modelling approaches:(a)the Kaplan et al. (2009) standard scenario;(b)the Kaplan
et al. (2009) technology scenario;(c) the HYDE 3.1 database (Klein Goldewijk et al., 2010);
(d), the Pongratz et al. (2008) maximum scenario.
CPD
6, 307–346, 2010Holocene land-cover reconstructions
M.-J. Gaillard et al.
Title Page
Abstract Introduction
Conclusions References
Tables Figures
◭ ◮
◭ ◮
Back Close
Full Screen / Esc
Printer-friendly Version
Interactive Discussion 860
Fig. 5. Global anthropogenic land use at AD 1 simulated by three different approaches: (a),
based on Kaplan et al. (2009);(b), from HYDE 3.1 (Klein Goldewijk et al., 2010); and(c), from