Cortical Network Models of Firing Rates in
the Resting and Active States Predict BOLD
Responses
Maxwell R. Bennett1,2*, Les Farnell2,3, William G. Gibson2,3, Jim Lagopoulos1
1The Brain and Mind Research Institute, University of Sydney, Sydney, NSW, Australia,2The Centre for Mathematical Biology, University of Sydney, Sydney, NSW, Australia,3The School of Mathematics and Statistics, University of Sydney, Sydney, NSW, Australia
Abstract
Measurements of blood oxygenation level dependent (BOLD) signals have produced some surprising observations. One is that their amplitude is proportional to the entire activity in a region of interest and not just the fluctuations in this activity. Another is that during sleep and anesthesia the average BOLD correlations between regions of interest decline as the activ-ity declines. Mechanistic explanations of these phenomena are described here using a cor-tical network model consisting of modules with excitatory and inhibitory neurons, taken as regions of cortical interest, each receiving excitatory inputs from outside the network, taken as subcortical driving inputs in addition to extrinsic (intermodular) connections, such as pro-vided by associational fibers. The model shows that the standard deviation of the firing rate is proportional to the mean frequency of the firing when the extrinsic connections are decreased, so that the mean BOLD signal is proportional to both as is observed experimen-tally. The model also shows that if these extrinsic connections are decreased or the fre-quency of firing reaching the network from the subcortical driving inputs is decreased, or both decline, there is a decrease in the mean firing rate in the modules accompanied by decreases in the mean BOLD correlations between the modules, consistent with the observed changes during NREM sleep and under anesthesia. Finally, the model explains why a transient increase in the BOLD signal in a cortical area, due to a transient subcortical input, gives rises to responses throughout the cortex as observed, with these responses mediated by the extrinsic (intermodular) connections.
Introduction
The cortical metabolic rate of glucose oxidation (CMRglc(ox)) gives a good measure of the
aver-age synaptic and firing activity in a region of cortex [1], although it is unclear that this can be used as a surrogate for the resting-state blood oxygenation level dependent (BOLD) signal mea-sured with fMRI, as is often taken to be the case [2,3]. This is because the fMRI signal provides a measure of the fluctuations about the average firing rate in a region of cortex, not the absolute
OPEN ACCESS
Citation:Bennett MR, Farnell L, Gibson WG, Lagopoulos J (2015) Cortical Network Models of Firing Rates in the Resting and Active States Predict BOLD Responses. PLoS ONE 10(12): e0144796. doi:10.1371/journal.pone.0144796
Editor:Lawrence M Ward, University of British Columbia, CANADA
Received:July 21, 2015
Accepted:November 24, 2015
Published:December 14, 2015
Copyright:© 2015 Bennett et al. This is an open access article distributed under the terms of the Creative Commons Attribution License, which permits unrestricted use, distribution, and reproduction in any medium, provided the original author and source are credited.
Data Availability Statement:All relevant data is contained within the paper.
Funding:The authors received no funding for this work.
size of the frequency [4]. Nevertheless, it has been shown that the average amplitude of the rest-ing-state CMRglc(ox)in a cortical area is proportional to the average resting-state BOLD there
[3], in studies in which the global signal has not been regressed out. This observation implies that fluctuations in the firing rate in a region of interest are proportional to the average firing rate. We have found that this is so in our cortical model, thus providing the opportunity to determine how it might arise.
Correlations of BOLD signals between brain areas of subjects in the resting-state have been taken to characterize resting-state functional networks [5], with the correlations probably mediated in many cases by synapses formed by associational fiber axons [6,7]. During sleep and anesthesia some of these correlations are lost, possibly due to changes in synaptic transmis-sion mediated by these fibers or, as shown here, to changes in the input to the cortex from sub-cortical regions [8,9]. As there is concomitantly a significant decrease in CMRglc(ox)and hence
the average firing rate in these areas [1], the question arises as to whether the decrease in CMRglc(ox)is due to a loss in average firing rate contingent on the loss of correlations mediated
by synapses formed by the associational fibers or to the input firing from subcortical regions? The cortical model presented here shows quantitatively how the decline in either the efficacy of the associational fiber synapses and/or the subcortical input changes the firing rates in cortical regions.
Given that the associational fibers connect widely separated cortical regions it might be anticipated that if a region receives a transient input from subcortical regions, such as the thala-mus, this will be widely distributed in some form to other regions across the cortex, and this has been shown to be the case [10]. Our cortical model shows that different shaped transient BOLD signals occur in different modules following a transient box-car BOLD signal intro-duced into one module, and that these transients are the same as those observed across the cor-tex [10].
Large scale networks of cortico-cortical anatomical connectivity have been used to analyze resting-state cortical activity [11–14] although phenomenological models of lower complexity are very useful in order to reveal important mechanisms responsible for the dynamics of corti-cal activity [11]. We have used such phenomenological models [15], described in the Methods and illustrated inFig 1, in order to illuminate the mechanisms relating BOLD activity to the underlying firing rate in the different experiments outlined above.
Materials and Methods
Definitions
‘Associational fiber connections’are extrinsic to the modules: axons making synaptic connec-tions between one part of the cortex and another, considered as regions of interest (ROI).
‘Correlation of the BOLD signals’: correlation between the time course of BOLD signals in one ROI with that in another ROI.
‘Global signal’: the average BOLD signal across all ROI. ‘Structural connection’: a synapse.
‘Synaptic efficacy’: the probability of synaptic transmission.
Cortical models
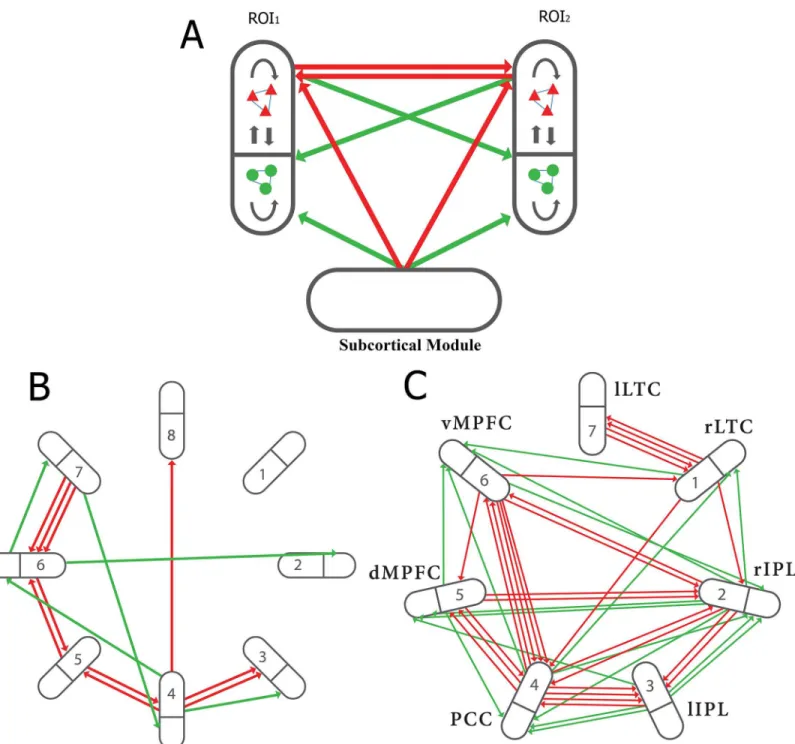
Fig 1. Shown are two modules (regions of interest, ROI1and ROI2), represented by ellipses containing pools of excitatory neurons (red triangles)
and inhibitory neurons (green circles), synaptically connected within and between pools (black arrows).The extrinsic (associational) axons between ROI1and ROI2originate and end on single neurons and are either excitatory to excitatory (red arrows) or excitatory to inhibitory (green arrows). The subcortical inputs are also excitatory; computationally, this input is represented by a Poisson train of firings, the strength and frequency of which can be varied. (B), extrinsic (intermodular, associational) connections in an 8 modular network (NI). The bold line within each module indicates separation of excitatory and inhibitory neurons within the module with all extrinsic fibers between the modules forming excitatory synapses, primarily on excitatory neurons within the modules but not exclusively so. (C), extrinsic (intermodular, associational) connections in a 7 modular network (NII). The connectivity due to the associational axons follows the criteria described in A above. NII can be taken to represent the Default Mode Network (DMN). In this case the modules may be identified as follows: 1, right lateral temporal cortex; 2, right inferior parietal lobule; 3, left inferior parietal lobule; 4, posterior cingulate cortex; 5, dorsal medial prefrontal cortex; 6, ventral medial prefrontal cortex; 7, left lateral temporal cortex. The number and diversity of the associational fibers were chosen so as to reflect the reported weight of such connections between the modules of the DMN (see [49], their Fig 8 and associated Table; also Fig 4A and 4C in [50]. (After Fig 1 in (15) with permission.)
neuron as an integrate-and-fire unit that sums inputs and generates an output firing when a threshold is reached (for details of the model, see (6). The ratio of excitatory to inhibitory connections to the excitatory neurons is 0.36. The inhibitory connections on the soma are very powerful in determining the initiation of firing and propagation from the soma, so we settled for an inhibitory to excitatory ratio of 0.36 on average. The strengths of these connec-tions provided an excitatory to inhibitory ratio of strengths of 0.33 which may be compared with that reported in the literature of 0.5 [17] to 1.0 [18]. It should be noted that no attempt has been made in this work to reproduce the wide range of intermodular neuronal types and their connectivity that might lead to more appropriate patterns of firing than that observed in the present and previous modeling studies [6,15]. The overall extent of intramodular con-nections, their absolute strengths and the total number of neurons per module were selected, given the above restrictions, so that the firing rates of isolated modules were neither continu-ous nor collapsed to zero.
The neurons in the network also receive an external background input of uncorrelated Pois-son firing trains, like those that cortical neurons receive from subcortical regions such as the intralaminar nuclei of the thalamus, together with intermodular excitatory synaptic connec-tions (compare with the network in [12]; see also [6]. The firing rate was transformed to BOLD signals using the model in [19] as used in [20] (see below). This model is currently used in all theoretical exercises involving determinations of the BOLD signal in relation to firings [12,21], and there is good experimental evidence indicating a close correlation between these (see for example [22]).
The patterns of firing in the cortex are very irregular [23–25], with some showing bursts fol-lowed by relatively silent periods of about 0.5s [26] and this is observed in the present simula-tions. The patterns of firing are determined by the intrinsic properties of modular networks. Both the amplitude and frequency of the BOLD signals arising from the patterns of network firings, following application of the Friston equations [19], is similar to that identified experi-mentally (see Fig 2B in [27]) and in other cortical network simulations (see Fig 6 in [21]) in the literature.
Single modules and systems of modules
The formalism for the network in a single isolated module, follows that of [6,15], which in turn was based on [28] and [29]. The time evolution of the network is initiated by trains of independent but identically distributed Poisson inputs applied to each neuron. The complete system of modules consists of identical modules that are interconnected by a limited number of synaptic connections originating from single excitatory neurons and ending on either excit-atory or inhibitory neurons, both connected neurons being randomly selected from the appro-priate pool. For Network I with 8 modules the intermodal connections were generated randomly (Fig 1B), whereas for Network II with 7 modules the connections are based on data as given at the end of the legend toFig 1(Fig 1C). Simulation runs were generally of 300s dura-tion, using a time step of 0.01ms and data sampling every 100ms. In the cases where extra stim-ulation was applied to a module, this was turned on at 25ms and then alternated 20s on and 20s off until the end of the run.
BOLD signal
changes in regional blood flow. The equations are, for a single neural region (module)
_
s¼z κs γðf 1Þ
_
f¼s
τν_ ¼f ν1=α
τq_ ¼f½1 ð1 ρÞ
1=f
=ρ qν1=α=ν
wheres_¼ds=dt, etc. The input to these equations isz, a measure of neuronal activity taken as proportional to the neuronalfiring rate.sis a vasodilatory signal related to the blood inflow,f. νis the blood volume,qthe deoxyhemoglobin content andρthe resting oxygen extraction frac-tion. The BOLD signal is given by
y¼V0½7%ð1 qÞ þ2ð1 q=νÞ þ ð2% 0:2Þð1 νÞ
whereV0= 0.02 is the resting blood volume fraction. The other parameters have valuesκ= 0.65, γ= 0.41,τ= 0.98,α= 0.32,ρ= 0.34. A full discussion of these equations, their derivation and jus-tification, can be found in Friston et al., [19,30]. In our modeling the neuronal activity,z, that is the input to these equations, is obtained by multiplying the neuronfiring rate (in Hz) by 0.01.
Sampling was carried out every 100ms over the 300s time series, with 50 samples averaged in general giving a bin of 5s and therefore 60 points on which to calculate the standard devia-tion (S.D.). This bin size was chosen as appropriate given the time course of a BOLD signal. In the case of the BOLD signal this S.D. gives the total BOLD fluctuations over the duration of simulation specified of the total signal, without prior regression of any global variation across the modules. Here the S.D. provides a summary of variability or power over all frequencies, particularly those in the low frequency range (i.e., above a period of five seconds).
Results
Cortical networks
Our networks consist of different numbers of modules, with each containing a hundred neurons, 75% excitatory and 25% inhibitory, having different extents of synaptic connections. Associational fiber connections occur between the modules with their own synaptic weights (for more details of this connectivity seeMethods). Synaptic connections of neurons within any module may also orig-inate from subcortical sources completely external to the network. In addition, another input to the network may make synaptic connections in relation to the synapses formed by the intermodu-lar associational fiber connections whose efficacy they modify; these may originate for instance from subcortical regions such as the intralaminar thalamus. In order to simplify this network for computational purposes, the inputs external to the networks have been grouped and the synaptic efficacy of the intermodular associational synaptic connections changed according to requirements rather than arising from the intrinsic workings of the subcortical module inFig 1A.
the rest on inhibitory neurons (Fig 1B). In contrast to NI, NII (Fig 1C) consists of 7 modules, all of which receive 2 to 8 associational fibers forming synapses onto excitatory neurons and from 0 to 2 associational fiber synapses onto inhibitory neurons. NI and NII have been chosen from a large number of modular networks we have investigated, as they best illustrate princi-ples that emerge from this study of small networks.
Changes in the extrinsic (intermodular, associational) synaptic
connections lead to changes in BOLD signals in modules throughout the
network that are proportional to the firing rate in the modules
BOLD signals that measure fluctuations in the resting-state firing rate in a region of cortex have to be reconciled with the observation that the BOLD is also proportional to the average firing rate or CMRglc(ox)[3]. The S.D. of the firing rate in any module in NI and NII (Fig 1) is found to
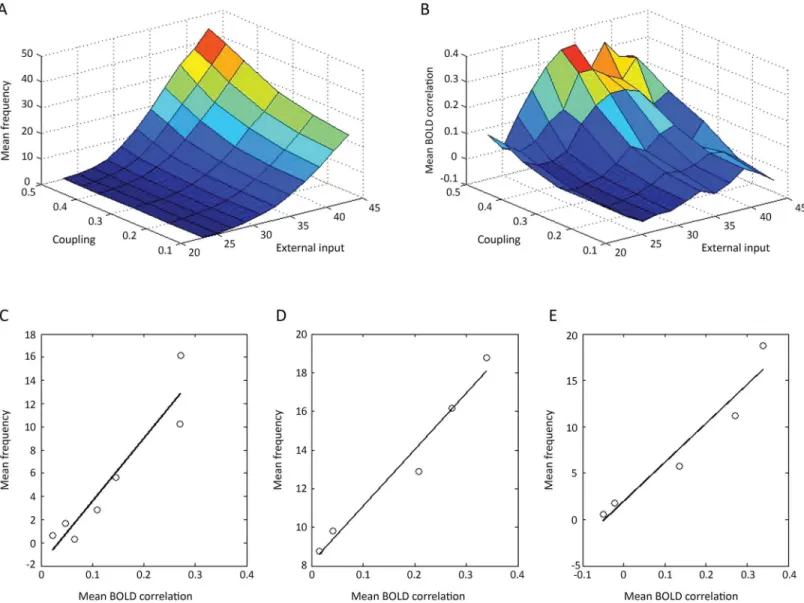
be highly correlated with the firing rate fluctuations (Fig 2A). This is true of both NI (correlation coefficient 0.99) and NII (correlation coefficient 0.98), independent of the extent of extrinsic (associational) synaptic connectivity between the modules in each of the networks. As the experi-mentally measured BOLD signal is taken to be proportional to the fluctuations in the firing rate, for example fast synchronous activity in the high frequency range [33] or particular patterns of bursting or transitions between up and down states, it was necessary to confirm that this is the case in the networks under consideration.Fig 2Bshows that it is approximately the case, with a correlation coefficient of 0.82 relating BOLD amplitude, computed over 60 five second windows, to the S.D. of the firing rate for NII modules. However, as the S.D. is linearly related to the firing rate in these networks (Fig 2A) it follows fromFig 2Bthat the BOLD amplitude should be line-arly related to the firing rate, and this is shown to be the case (Fig 2C) with correlation coefficient 0.66. This implies that the BOLD signal as normally determined provides a relative measure not only of the firing rate fluctuations but also of the average firing rate, as has been shown experi-mentally to be the case (Fig 2D). The gradient of the regression lines relating experimentally determined BOLD amplitude to CMRglc(ox)is 0.04 (Fig 2D), compared with the theoretical
gradi-ent of 0.06 (Fig 2C). These relations are likely due to the nature of the on-going bursts of firing activity in the modules (examples of which are shown in the Supplementary Information in [15]. In this case, the observed relations between the mean and S.D. of firing activity arises as a conse-quence of this pattern of activity. The S.D. provides a summary of variability or power over all frequencies, particularly those in the low frequency range (i.e., above a period of five seconds). The dependence of the BOLD amplitude on firing rate can be scaled down to much lower mean frequencies, as it is likely, although uncertain, that the firing rate in humans are substan-tially less than 10Hz. This scaling down of the frequency to much lower firing rates is accompa-nied by a scaling down of the S.D. of the frequencies (Fig 3A and 3B). The results ofFig 3were obtained by changing the firing input to the network, taken to originate from subcortical areas, and not by varying the extrinsic (associational) synaptic connectivity as for the results inFig 2. Thus the linear relation between the BOLD signal on the one hand and both the S.D. and firing rate on the other is not dependent on how these are varied by modifying the network, at least not for the range of values given in the cases considered.
Loss of BOLD correlations between modules, mediated by the extrinsic
(intermodular, associational) connections, is achievable with a decrease
of firing rate within modules
Movement (NREM) sleep as well as following anesthesia [15]. The loss of correlated activity between certain regions of the cortex in sleep and anesthesia is accompanied by CMRglc(ox)
decreases of about 40% in these regions [1], implying a 40% decrease in firing rate in these regions, given the strong linear relation between firing rate and CMRglc(ox)[1]. The question
arises as to whether there is a causal relation between the loss of BOLD correlations between regions and the decrease in firing rate in these regions?
The mean firing rate in the modules following changes in the average coupling strength between the modules or changes in the frequency from the subcortical input are given inFig 4A. The mean BOLD correlation changes, for changes in coupling or external input frequency, are given inFig 4B. These results allow graphs to be drawn for the relation between mean fre-quency and mean BOLD correlations for the situation where these parameters change as a
variety of different extrinsic (intermodular) connection weights. (B), correlation between the amplitude of the RMS BOLD signals and the S.D. of the frequency of firing rates giving rise to the BOLD signals for NII in the resting state. The BOLD evaluations and the S.D.s of the frequencies were determined for NII as for the networks in (A); correlation coefficient 0.82. (C), correlation between the amplitude of the RMS BOLD signals and the mean frequency of firing rates giving rise to the BOLD signals for NII in the resting state. The BOLD evaluations and the firing rate frequencies were determined as for the networks in (A). The gradient of the regression line is 0.06 with correlation coefficient 0.66. (D), correlation between the experimental‘resting state fMRI amplitude’(BOLD amplitude) and the CMRglc(ox)in the resting state in different brain regions of humans.The gradient of the regression line is 0.04, with correlation coefficient 0.98. Values are from Table 1 in [3].
doi:10.1371/journal.pone.0144796.g002
Fig 3. The BOLD amplitude is linearly related to both the mean firing rates and their S.D. down to frequencies in the range of those observed in the cortex of primates.Dependence of the BOLD amplitude on the S.D. of the firing rate (A) and of the mean firing rate (B) when this was reduced by
decreasing the subcortical input to the modules until the mean frequency was less than 1.25Hz while keeping the extrinsic (intermodular) connection weights constant. The linear relation between the BOLD amplitude on the one hand and both the mean firing rate (B) and the S.D. of this (A) on the other is maintained as the frequency is reduced.
consequence of changes in the subcortical input frequency (Fig 4C) or changes in the coupling strength (Fig 4D). The linear gradient of the former is much steeper than that of the latter (54Hz compared with 29Hz), so that much greater changes in the mean firing rate are associ-ated with changes in the mean BOLD correlation following a change in the subcortical input, than with a change in the coupling strength. In the model a 35% decrease in the firing rate, of the kind observed in some parts of the cortex during NREM sleep, can be obtained together with changes in mean BOLD correlations comparable to those observed [9], with a change in the subcortical input. For example, a 35% drop in the firing rate in the modules accompanies a 28% drop in the BOLD correlations following a drop in the subcortical frequency. This may be
Fig 4. The relation between the mean firing rate in modules of NII (Fig 1C) and the mean BOLD correlations between the modules as either the coupling strength between modules or their subcortical input frequency are changed or both are changed at the same time.The changes in average firing rate (A), and the average BOLD correlations between modules (B), are shown for changes in the subcortical input frequency and coupling strength. The changes in the average firing rate versus changes in BOLD correlations when these are altered by changing only (C) the subcortical input frequency (25 Hz to 35 Hz) at constant connection strength (0.45) or (D) the connection strength (0.2 to 0.5) at a constant input frequency (35 Hz) are given by the graphs. The gradient in C is 54 Hz and that in D is 29 Hz (linear regression lines drawn, with in (C) y = 54x–1.9 and in (D) y = 29x + 8). In E the changes in the average firing rate versus changes in BOLD correlations are given when these are altered by changing both the subcortical input frequency and the coupling strength simultaneously, a linear relation between these being assumed. The gradient of the line in E is 41 Hz (y = 41x + 1).
compared with the observed changes in the average correlations in the sensorimotor network from the awake state to deep NREM sleep of 25% (Fig 1A in [34]). On the other hand, changes in the coupling strength required to produce an average 35% reduction in firing rate in the modules are associated with very large percentage changes in mean BOLD correlation, of the order of 70%, that are not observed ([9]; [34]). While this argues for changes in the subcortical input frequency input providing the most likely basis for the changes in firing rate and BOLD correlations observed under a variety of experimental conditions, such as during NREM sleep, it certainly does not preclude a judicious mixture of both changes in extrinsic (associational) fiber coupling and subcortical input frequency. We have therefore looked at cases in which both the subcortical input and the coupling strength are changed simultaneously.Fig 4Egives the relation between the firing rate and the BOLD correlations for the case when the subcortical input frequency and coupling strength are linearly related, so that the coupling goes from strengths of 0.2 to 0.5 as the subcortical input frequency goes from 25Hz to 35 Hz. In this case, as anticipated, the gradient relating frequency to BOLD correlations is intermediate, 41Hz, to that of the other two gradients (compareFig 4EwithFig 4C and 4D).
Extrinsic (intermodular, associational) connections mediate transient
changes in BOLD signals throughout the network following a transient
change introduced into a single module
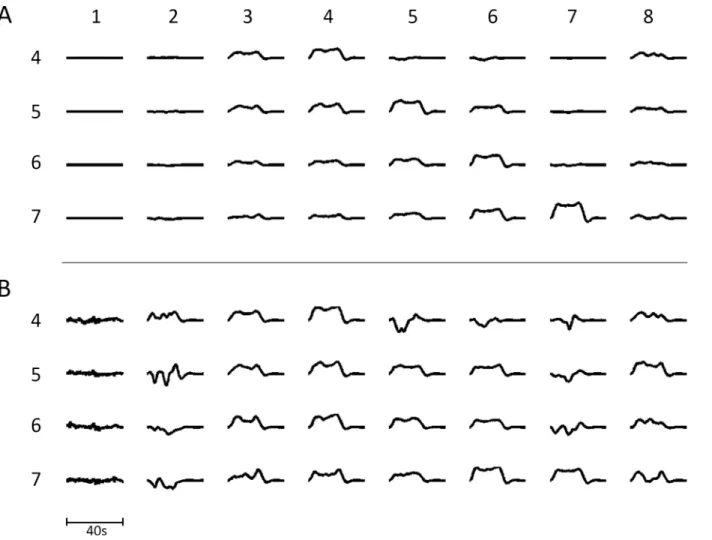
We determined if the modules responded to transient increases in firing input from an external source, representing subcortical inputs. To this end, each of the modules in NI was given in turn an extra transient average input for 20s and the BOLD response in each of the modules throughout the network measured (seeFig 5A). Following transient increases in modules 4, 5, 6 and 7, respectively, BOLD transients could be observed, mostly of the boxcar shape, in mod-ules 4, 5 and 6. However, responses in all the modmod-ules throughout the network could be identi-fied with sufficient amplification (Fig 5B). Many of these modules gave BOLD responses that had very different shapes to the boxcar variety: for example those in modules 2 and 7, which receive extrinsic (associational) synaptic connections that primarily synapse on inhibitory neu-rons within the modules. The distribution of the BOLD transient shapes and sizes is very simi-lar to that observed experimentally where responses with the shapes given inFig 5Bare identified over widely spaced regions of the cortex after suitable averaging to improve the sig-nal-to-noise ratio [10].
Discussion
BOLD signals are proportional to both the mean and S.D. of the firing
rate in the resting state
The subcortical input to each neuron in the network of modules gives rise to bursts of firings in the modules (see Supplementary Information in [15]), that have similar characteristics to those of‘up-states’recorded in neocortex [35,36]. Indeed it is known that a spontaneous up-state in one module can initiate bursts in other modules [37,38]. This average frequency increases with an increase in the frequency of the subcortical input for each module, whether or not it is embedded in a network of modules [15]. As a consequence of this pattern of activity the stan-dard deviation of the firing rate is proportional to the average firing rate (seeFig 2A). This arises as follows: let the firing rate within a burst bebHz and letℓs be the length of the burst.
To a good approximation, we can takebandℓto be constants. Ifpis the probability of a burst
that the overallfiring rateXb/nis also binomially distributed with mean µ =pbHz and stan-dard deviations¼mpffiffiffiffiffiffiffiffiffiffiffiffiffiffiffiffiffiffiffiffiffiffiffiffiffiffið1 pÞ=ðpnÞHz. Note that as well as showing that the standard
devia-tionσis proportional to thefiring rate µ, this also shows thatσdecreases as the inverse of the square root of the length of the time windownℓs used in analyzing the simulation data. In the
present work sixty windows of 5 s were used in the calculations.
Loss of average resting-state firing rate over modules during sleep and
anesthesia associated with loss of BOLD
During NREM sleep there is a fall in BOLD correlations between many areas of cortex although there are some increases in others [39,40]. The greatest decline, of over 70%, occurs between the medial prefrontal cortex and the posterior cingulate cortex and also between the medial prefrontal cortex and the right inferior parietal lobule (see Table 2 in [41] and also [42]). This reflects the fact that NREM sleep is accompanied by fewer long-range effective associational connections with increased‘cliqueness’of local connections (that is there is a clustering of local ‘sub-modules’) [39,40,43]. Given the loss of these BOLD correlations there should be a
Fig 5. (A) The transient BOLD signal in each module in NI (columns numbered 1 to 8) following successive 20s increases in the subcortical input to modules 4 to 7 (rows numbered 4 to 7), causing increased firing in these modules. The input was simulated by increasing the subcortical input for 20s periods. (B) gives the same results as in (A) except that individual transients are amplified sufficiently to observe them in each of the 8 modules.This figure should be compared with that of Fig 4C in [10] in which similar experimental transients were observed over the cortex in a simple psychological test.
significant decrease in firing rate in individual modules according to our model, reflected by a decrease in CMRglc(ox)in the modules, and this is observed [1]. This global drop in firing rate,
accompanied by a decrease in BOLD correlations, can be most easily accommodated in the present model by a decrease in the firing rate of subcortical inputs to the modules rather than by changes in the connective strength between them, although both might be involved with the former having a much greater impact on the changes in firing rate in the modules and the asso-ciated changes in BOLD correlations. Furthermore the possibility of an increase in the sponta-neous down-states in the individual modules, caused by local changes in the efficacies of the intrinsic intramodular synapses during NREM sleep or anesthesia, cannot be discounted.
It is of considerable interest that during quiet wakefulness transcranial magnetic stimulation (TMS) of the premotor area leads to an initial electrical response there, followed by a sequence of waves that propagate to other areas of the cortex with which the premotor area has long associational connections. This is in contrast to NREM sleep when the electrical response at the premotor site of stimulation is strong but does not propagate to other sites at all [41,42]. These observations are consistent with the idea that the principal decrease in firing rate and BOLD correlations under these conditions is due to a decrease in the efficacy of associational synaptic connections that block the propagation of the cortical waves [44].
Propofol anesthesia also reduces BOLD correlations [45,46]. For example, the BOLD corre-lations of the medial prefrontal cortex are reduced from 0.6 to 0.1 and those of the posterior cingulate cortex from 0.6 to 0.3 under propofol. This is in contrast to the auditory and visual resting-state networks where the BOLD correlations are minimally altered [8,45,46]. These decreases in BOLD correlations are accompanied by decreases in CMRglc(ox)of about 50% to
60% in different areas of cortex [47], as expected from the relation between decreases in the fir-ing rate in different modules and their loss of BOLD correlations (see Fig4A and 4B).
Another interesting aspect of the effects of changing the resting-state activity in sensory areas with an anesthetic is that a transient input from the thalamus gives rise to a more spatially confined BOLD change in sensory cortex, although the BOLD signal is much enhanced in amplitude [48]. This is to be expected from the model if an effect of the anesthetic is to decrease the associational fiber connectivity, for in this case some cortical areas (or modules) are isolated from others giving then a spatially confined BOLD signal. Furthermore, since the area (or module), as a consequence of being isolated, has a low level of resting-state firing activity then it will give rise to a much larger BOLD signal in response to a given transient subcortical (tha-lamic) signal (Fig 4 in [15]).
Author Contributions
Conceived and designed the experiments: MB LF WG JL. Performed the experiments: MB LF WG. Analyzed the data: MB LF WG. Contributed reagents/materials/analysis tools: MB LF WG JL. Wrote the paper: MB LF WG JL.
References
1. Hyder F, Rothman DL, Bennett MR. Cortical energy demands of signaling and nonsignaling compo-nents in brain are conserved across mammalian species and activity levels. Proc Natl Acad Sci U S A. 2013; 110(9):3549–54. doi:10.1073/pnas.1214912110Epub 2013 Jan 14. PMID:23319606
2. Colonnese MT, Phillips MA, Constantine-Paton M, Kaila K, Jasanoff A. Development of hemodynamic responses and functional connectivity in rat somatosensory cortex. Nat Neurosci. 2008; 11(1):72–9. Epub 2007 Nov 25. PMID:18037883
3. Tomasi D, Wang GJ, Volkow ND. Energetic cost of brain functional connectivity. Proc Natl Acad Sci U S A. 2013; 110(33):13642–7. doi:10.1073/pnas.1303346110Epub 2013 Jul 29. PMID:23898179
5. Biswal BB, Van Kylen J, Hyde JS. Simultaneous assessment of flow and BOLD signals in resting-state functional connectivity maps. NMR Biomed. 1997; 10(4–5):165–70. PMID:9430343
6. Bennett MR, Farnell L, Gibson WG. Fiber pathway pathology, synapse loss and decline of cortical func-tion in schizophrenia. PLoS One. 2013; 8(4):e60518. doi:10.1371/journal.pone.0060518Print 2013. PMID:23593232
7. Bowman FD, Zhang L, Derado G, Chen S. Determining functional connectivity using fMRI data with dif-fusion-based anatomical weighting. Neuroimage. 2012; 62(3):1769–79. doi:10.016/j.neuroimage. 2012.05.032Epub May 24. PMID:22634220
8. Guldenmund P, Demertzi A, Boveroux P, Boly M, Vanhaudenhuyse A, Bruno MA, et al. Thalamus, brainstem and salience network connectivity changes during propofol-induced sedation and uncon-sciousness. Brain Connect. 2013; 3(3):273–85. Epub 2013/04/04. doi:10.1089/brain.2012.0117PMID: 23547875.
9. Horovitz SG, Braun AR, Carr WS, Picchioni D, Balkin TJ, Fukunaga M, et al. Decoupling of the brain's default mode network during deep sleep. Proc Natl Acad Sci U S A. 2009; 106(27):11376–81. doi:10. 1073/pnas.0901435106Epub 2009 Jun 19. PMID:19549821
10. Gonzalez-Castillo J, Saad ZS, Handwerker DA, Inati SJ, Brenowitz N, Bandettini PA. Whole-brain, time-locked activation with simple tasks revealed using massive averaging and model-free analysis. Proc Natl Acad Sci U S A. 2012; 109(14):5487–92. doi:10.1073/pnas.1121049109Epub 2012 Mar 19. PMID:22431587
11. Cabral J, Hugues E, Sporns O, Deco G. Role of local network oscillations in resting-state functional connectivity. Neuroimage. 2011; 57(1):130–9. doi:10.1016/j.neuroimage.2011.04.010Epub Apr 12. PMID:21511044
12. Deco G, Hagmann P, Hudetz AG, Tononi G. Modeling resting-state functional networks when the cor-tex falls asleep: local and global changes. Cereb Corcor-tex. 2014; 24(12):3180–94. doi:10.1093/cercor/ bht176Epub 2013 Jul 10. PMID:23845770
13. Honey CJ, Sporns O, Cammoun L, Gigandet X, Thiran JP, Meuli R, et al. Predicting human resting-state functional connectivity from structural connectivity. Proc Natl Acad Sci U S A. 2009; 106(6):2035– 40. doi:10.1073/pnas.0811168106Epub 2009 Feb 2. PMID:19188601
14. Zuo XN, Ehmke R, Mennes M, Imperati D, Castellanos FX, Sporns O, et al. Network centrality in the human functional connectome. Cereb Cortex. 2012; 22(8):1862–75. doi:10.093/cercor/bhr269Epub 2011 Oct 2. PMID:21968567
15. Bennett MR, Farnell L, Gibson WG, Lagopoulos J. Cortical network models of impulse firing in the rest-ing and active states predict cortical energetics. Proc Natl Acad Sci U S A. 2015; 112(13):4134–9. doi: 10.1073/pnas.1411513112Epub 2015 Mar 16. PMID:25775588
16. Fitzpatrick D, Lund JS, Schmechel DE, Towles AC. Distribution of GABAergic neurons and axon termi-nals in the macaque striate cortex. J Comp Neurol. 1987; 264(1):73–91. PMID:3680625
17. Thomson AM, West DC, Wang Y, Bannister AP. Synaptic connections and small circuits involving excitatory and inhibitory neurons in layers 2–5 of adult rat and cat neocortex: triple intracellular record-ings and biocytin labelling in vitro. Cereb Cortex. 2002; 12(9):936–53. PMID:12183393
18. Dantzker JL, Callaway EM. Laminar sources of synaptic input to cortical inhibitory interneurons and pyramidal neurons. Nat Neurosci. 2000; 3(7):701–7. PMID:10862703
19. Friston KJ, Harrison L, Penny W. Dynamic causal modelling. Neuroimage. 2003; 19(4):1273–302. PMID:12948688
20. Honey CJ, Kotter R, Breakspear M, Sporns O. Network structure of cerebral cortex shapes functional connectivity on multiple time scales. Proc Natl Acad Sci U S A. 2007; 104(24):10240–5. Epub 2007 Jun 4. PMID:17548818
21. Deco G, Jirsa VK. Ongoing cortical activity at rest: criticality, multistability, and ghost attractors. J Neu-rosci. 2012; 32(10):3366–75. doi:10.1523/JNEUROSCI.2523-11.012PMID:22399758
22. Pan WJ, Thompson GJ, Magnuson ME, Jaeger D, Keilholz S. Infraslow LFP correlates to resting-state fMRI BOLD signals. Neuroimage. 2013; 74:288–97. doi:10.1016/j.neuroimage.2013.02.035Epub Feb 26. PMID:23481462
23. Connors BW, Gutnick MJ. Intrinsic firing patterns of diverse neocortical neurons. Trends Neurosci. 1990; 13(3):99–104. PMID:1691879
24. Gray CM, McCormick DA. Chattering cells: superficial pyramidal neurons contributing to the generation of synchronous oscillations in the visual cortex. Science. 1996; 274(5284):109–13. PMID:8810245
25. Softky WR, Koch C. The highly irregular firing of cortical cells is inconsistent with temporal integration of random EPSPs. J Neurosci. 1993; 13(1):334–50. PMID:8423479
27. Fox MD, Raichle ME. Spontaneous fluctuations in brain activity observed with functional magnetic reso-nance imaging. Nat Rev Neurosci. 2007; 8(9):700–11. PMID:17704812
28. Tao L, Shelley M, McLaughlin D, Shapley R. An egalitarian network model for the emergence of simple and complex cells in visual cortex. Proc Natl Acad Sci U S A. 2004; 101(1):366–71. Epub 2003 Dec 26. PMID:14695891
29. Tao L, Cai D, McLaughlin DW, Shelley MJ, Shapley R. Orientation selectivity in visual cortex by fluctua-tion-controlled criticality. Proc Natl Acad Sci U S A. 2006; 103(34):12911–6. Epub 2006 Aug 11. PMID: 16905648
30. Friston KJ, Mechelli A, Turner R, Price CJ. Nonlinear responses in fMRI: the Balloon model, Volterra kernels, and other hemodynamics. Neuroimage. 2000; 12(4):466–77. PMID:10988040
31. Buxton RB, Wong EC, Frank LR. Dynamics of blood flow and oxygenation changes during brain activa-tion: the balloon model. Magn Reson Med. 1998; 39(6):855–64. PMID:9621908
32. Mandeville JB, Marota JJ, Ayata C, Zaharchuk G, Moskowitz MA, Rosen BR, et al. Evidence of a cere-brovascular postarteriole windkessel with delayed compliance. J Cereb Blood Flow Metab. 1999; 19 (6):679–89. PMID:10366199
33. Chawla D, Lumer ED, Friston KJ. The relationship between synchronization among neuronal popula-tions and their mean activity levels. Neural Comput. 1999; 11(6):1389–411. PMID:10423500
34. Wu CW, Liu PY, Tsai PJ, Wu YC, Hung CS, Tsai YC, et al. Variations in connectivity in the sensorimotor and default-mode networks during the first nocturnal sleep cycle. Brain Connect. 2012; 2(4):177–90. Epub 2012 Aug 29. PMID:22817652
35. Luczak A, Bartho P, Harris KD. Spontaneous events outline the realm of possible sensory responses in neocortical populations. Neuron. 2009; 62(3):413–25. doi:10.1016/j.neuron.2009.03.014PMID: 19447096
36. Sakata S, Harris KD. Laminar structure of spontaneous and sensory-evoked population activity in audi-tory cortex. Neuron. 2009; 64(3):404–18. doi:10.1016/j.neuron.2009.09.020PMID:19914188
37. Litwin-Kumar A, Doiron B. Slow dynamics and high variability in balanced cortical networks with clus-tered connections. Nat Neurosci. 2012; 15(11):1498–505. doi:10.038/nn.3220Epub 2012 Sep 23. PMID:23001062
38. McDonnell MD, Ward LM. Small modifications to network topology can induce stochastic bistable spik-ing dynamics in a balanced cortical model. PLoS One. 2014; 9(4):e88254. doi:10.1371/journal.pone. 0088254eCollection 2014. PMID:24743633
39. Boly M, Perlbarg V, Marrelec G, Schabus M, Laureys S, Doyon J, et al. Hierarchical clustering of brain activity during human nonrapid eye movement sleep. Proc Natl Acad Sci U S A. 2012; 109(15):5856– 61. doi:10.1073/pnas.1111133109Epub 2012 Mar 26. PMID:22451917
40. Spoormaker VI, Gleiser PM, Czisch M. Frontoparietal Connectivity and Hierarchical Structure of the Brain's Functional Network during Sleep. Front Neurol. 2012; 3:80. doi:10.3389/fneur.2012.00080 eCollection 2012. PMID:22629253
41. Massimini M, Ferrarelli F, Esser SK, Riedner BA, Huber R, Murphy M, et al. Triggering sleep slow waves by transcranial magnetic stimulation. Proc Natl Acad Sci U S A. 2007; 104(20):8496–501. Epub 2007 May 4. PMID:17483481
42. Massimini M, Ferrarelli F, Huber R, Esser SK, Singh H, Tononi G. Breakdown of cortical effective con-nectivity during sleep. Science. 2005; 309(5744):2228–32. PMID:16195466
43. Spoormaker VI, Schroter MS, Gleiser PM, Andrade KC, Dresler M, Wehrle R, et al. Development of a large-scale functional brain network during human non-rapid eye movement sleep. J Neurosci. 2010; 30(34):11379–87. doi:10.1523/JNEUROSCI.2015-10.2010PMID:20739559
44. Ferrarelli F, Massimini M, Sarasso S, Casali A, Riedner BA, Angelini G, et al. Breakdown in cortical effective connectivity during midazolam-induced loss of consciousness. Proc Natl Acad Sci U S A. 2010; 107(6):2681–6. doi:10.1073/pnas.0913008107Epub 2010 Jan 25. PMID:20133802
45. Boveroux P, Vanhaudenhuyse A, Bruno MA, Noirhomme Q, Lauwick S, Luxen A, et al. Breakdown of within- and between-network resting state functional magnetic resonance imaging connectivity during propofol-induced loss of consciousness. Anesthesiology. 2010; 113(5):1038–53. doi:10.97/ALN. 0b013e3181f697f5PMID:20885292
46. Fiset P, Paus T, Daloze T, Plourde G, Meuret P, Bonhomme V, et al. Brain mechanisms of propofol-induced loss of consciousness in humans: a positron emission tomographic study. J Neurosci. 1999; 19(13):5506–13. PMID:10377359
48. Maandag NJ, Coman D, Sanganahalli BG, Herman P, Smith AJ, Blumenfeld H, et al. Energetics of neu-ronal signaling and fMRI activity. Proc Natl Acad Sci U S A. 2007; 104(51):20546–51. Epub 2007 Dec 13. PMID:18079290
49. Buckner RL, Andrews-Hanna JR, Schacter DL. The brain's default network: anatomy, function, and rel-evance to disease. Ann N Y Acad Sci. 2008; 1124:1–38. doi:10.1196/annals.440.011PMID:18400922