Concurrent Growth Rate and Transcript Analyses Reveal
Essential Gene Stringency in
Escherichia coli
Shan Goh1,2, Jaroslaw M. Boberek2, Nobutaka Nakashima3, Jem Stach4, Liam Good1,2*
1Department of Cell and Molecular Biology, Karolinska Institute, Stockholm, Sweden,2Department of Pathology and Infectious Diseases, Royal Veterinary College, University of London, London, United Kingdom,3Research Institute of Genome-based biofactory, Toyohira-Ku, Sapporo, Japan,4School of Biology, University of Newcastle, Newcastle upon Tyne, United Kingdom
Abstract
Background:Genes essential for bacterial growth are of particular scientific interest. Many putative essential genes have been identified or predicted in several species, however, little is known about gene expression requirement stringency, which may be an important aspect of bacterial physiology and likely a determining factor in drug target development.
Methodology/Principal Findings:Working from the premise that essential genes differ in absolute requirement for growth, we describe silencing of putative essential genes inE. colito obtain a titration of declining growth rates and transcript levels by using antisense peptide nucleic acids (PNA) and expressed antisense RNA. The relationship between mRNA decline and growth rate decline reflects the degree of essentiality, or stringency, of an essential gene, which is here defined by the minimum transcript level for a 50% reduction in growth rate (MTL50). When applied to four growth essential genes, both
RNA silencing methods resulted in MTL50 values that reveal acpP as the most stringently required of the four genes
examined, with ftsZ the next most stringently required. The established antibacterial targets murA and fabIwere less stringently required.
Conclusions:RNA silencing can reveal stringent requirements for gene expression with respect to growth. This method may be used to validate existing essential genes and to quantify drug target requirement.
Citation:Goh S, Boberek JM, Nakashima N, Stach J, Good L (2009) Concurrent Growth Rate and Transcript Analyses Reveal Essential Gene Stringency in
Escherichia coli. PLoS ONE 4(6): e6061. doi:10.1371/journal.pone.0006061
Editor:Laurent Re´nia, BMSI-A*STAR, Singapore
ReceivedNovember 3, 2008;AcceptedJune 2, 2009;PublishedJune 26, 2009
Copyright:ß2009 Goh et al. This is an open-access article distributed under the terms of the Creative Commons Attribution License, which permits unrestricted use, distribution, and reproduction in any medium, provided the original author and source are credited.
Funding:The Swedish Institute for a Guest Scholarship for SG, Bloomsbury Colleges for a scholarship to JMB, the Swedish Research Council, University of London Central Research Fund, and the Sasakawa Foundation. The funders had no role in study design, data collection and analysis, decision to publish, or preparation of the manuscript.
Competing Interests:The authors have declared that no competing interests exist.
* E-mail: [email protected]
Introduction
Progress in antimicrobial discovery has been slow during recent decades [1] despite large-scale efforts to identify genes essential for growth in conserved pathways ofEscherichia coli[2] andStaphylococcus aureus [3]. The drug discovery process involves essential gene identification through various methods such as chromosomal deletions [2] and experimentally reduced genomes [4], followed by studies of gene product interactions through tandem affinity purification [5] and/or mathematical models [6]. Potential drug targets are then subjected to high-throughput screening for inhibitors, which often fail at the cellular level in ‘‘hit-to-lead’’ stages of development due to several factors [7], such as gene function redundancy [8]. Also, for certain essential genes we suspect that there may be a low degree of gene expression requirement for bacterial viability. Despite evidence for differential requirement in growth essential genes [9], and initial efforts at scoring essentiality [2,10], there has not been a quantitative method to determine the expression requirement for essential genes so that only stringently required targets are considered further for drug development. This study focuses on measuring differences between suspected essential genes in terms of their degree of requirement for cell viability, referred to here as stringency, inE. coli.
We hypothesize that growth essential genes differ in require-ment stringencies, and that these differences can be revealed by measuring the relationships between specific mRNA decreases and bacterial growth rate decline. The aim of this study is to measure the growth stringency requirement E. coli genes using antisense gene silencing, so as to evaluate degree of essentiality for cell viability. Two antisense gene control strategies for bacteria are used - synthetic antisense peptide nucleic acids (PNAs) and plasmid expression of antisense RNA sequences. Both methods are capable of modulating essential genesin situinE. coli[11,12] andS. aureus
[13,14], and certain antisense agents can inhibit Mycobacteria [15,16]. Therefore, RNA silencing using specific antisense sequences provides an approach to measure gene requirement stringency.
Four genes,acpP,fabI,ftsZandmurAwere selected for this study for the following reasons: (a) each gene has been shown experimentally to be essential for growth in E. coli
[2,4,17,18,19,20], (b) they have been studied as antimicrobial targets [21,22,23], (c) the gene products have different cellular functions and (d) each gene can be silenced potentially without downstream effects [24,25]. Interactions between FabI and its specific inhibitor, triclosan, are well understood [26]. The fabI
elongation [17]. Another well-studied drug target is UDP-N-acetylglucosamine enolpyruvyl transferase (encoded for bymurA), which catalyzes the synthesis of peptidoglycan from N-acetylglu-cosamine acid and phosphoenoylpyruvate [10,18,27]. MurA is specifically inhibited by phosphomycin [28], and the mechanism of inhibition is well understood [29]. The protein function of FtsZ has also been studied in detail, and FtsZ is the focus of much assay development to discover effective inhibitors [30]. The ftsZ gene encodes a tubulin-like protein that polymerizes to form a Z-ring as a scaffold for cell division [31]. ACP or acyl carrier protein is encoded by acpP. ACP is an interesting drug target because, although it has been shown to be central to bacterial fatty acid biosynthesis [32,33], specific protein inhibitors have not yet been discovered. Nevertheless, acpP was shown to be an effective antisense target for treatment of bacterial infectionsin vivo[34,35] and the gene product can be inhibited [36].
In principle, the extent to which partial mRNA inhibition limits growth should reflect how stringently required the targeted mRNA is for bacterial viability. The specificities of antisense PNA and expressed antisense RNA silencing of the four selected target genes were assessed by conducting rescue experiments, where over-expression of the four target genes in different strains comple-mented the effects of the cognate silencers. To titrate down essential gene expression and obtain measured responses inE. coli, growth, we used gene specific antisense PNA and IPTG-induced expression of antisense sequences. This concept enables quantita-tive analyses of mRNA silencing and growth reduction, which are not possible using knockout approaches. We show that the essential genes differed in mRNA inhibition to growth inhibition profiles, demonstrating that the relationship between transcript levels and growth rate reflects the requirement stringencies of essential genes.
Results
Specificity of antisense RNA PNA and expressed antisense RNA
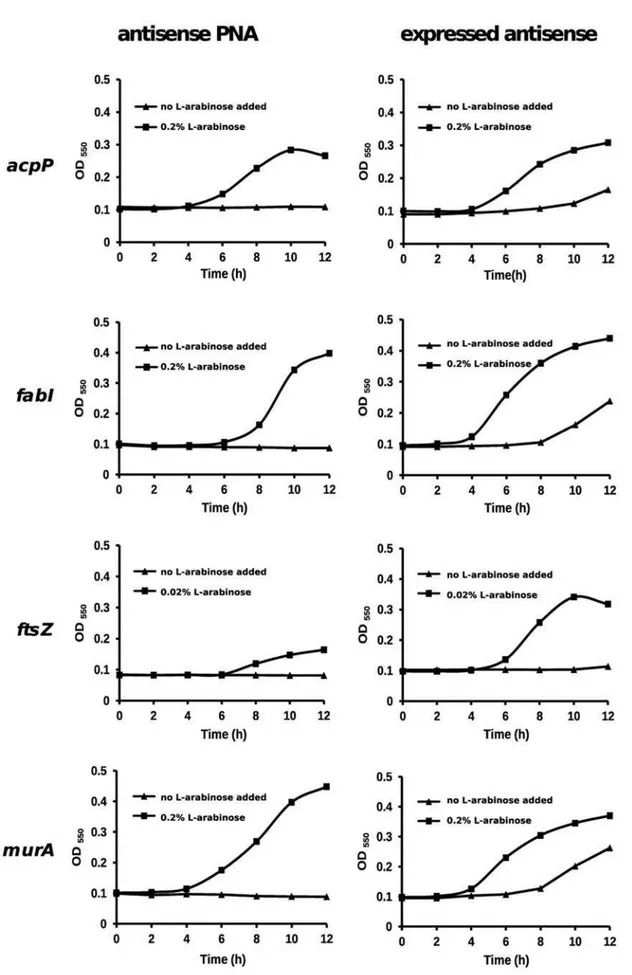
To silence the four selected target genes using the two different silencing methods, we first needed to design, test and validate several new silencers. Fortunately, we were able to use previously developed silencers foracpPandfabI, and we used similar design guidelines for the additional silencers needed for this study. We found that all eight silencers are able to inhibitE. coligrowth. Also, both PNA and expressed antisense RNA silencers displayed gene and sequence selective effects. Nevertheless, to ensure that all silence mainly the target gene, we carried out a set of rescue experiments where the RNA silencers were used under conditions that inhibited growth and we tested whether growth could be rescued by over-expression of the target gene open reading frame (ORF) from a plasmid. This transcomplementation strategy provides a more strict control of specificity relative to controls that involve sense, scrambled or irrelevant sequences, because it takes into account all transcript sequences present in the bacterial cell and the effector sequences remain unchanged. We designed antisense PNA specific foracpP(Ec108),fabI(Ec107),ftsZ(Ec326), and murA (Ec330) using optimal parameters for gene silencing [37,38] (Table 1). To test PNA specificity, we constructed four DH5astrains containing either acpP, fabI, pBAD-ftsZ or pBAD-murA. Each strain was grown in the presence of antisense PNA specific to the target gene cloned into pBAD, and either with or without the addition of L-arabinose for target gene over-expression. Without L-arabinose, strains did not grow but upon induction by L-arabinose, were resistant to the growth inhibitory effects of the PNA (Figure 1). To test specificity of
antisense expressed from plasmids, we constructed another four DH5a strains containing either pBAD-acpP+pHNA,
pBAD-fabI+pHN682, pBAD-ftsZ+pHNZ or pBAD-murA+pHNM. Each strain was grown in the presence of IPTG for induction of expressed antisense, and either with or without the addition of arabinose to induce target gene over-expression. Without L-arabinose, growth of strains was inhibited, and L-arabinose addition complemented gene silencing and allowed strains to grow in the presence of expressed antisense (Figure 1). The results from the rescue experiments demonstrate that the eight silencers display gene selective growth inhibition.
Titration of essential gene expression and its effect of growth rate
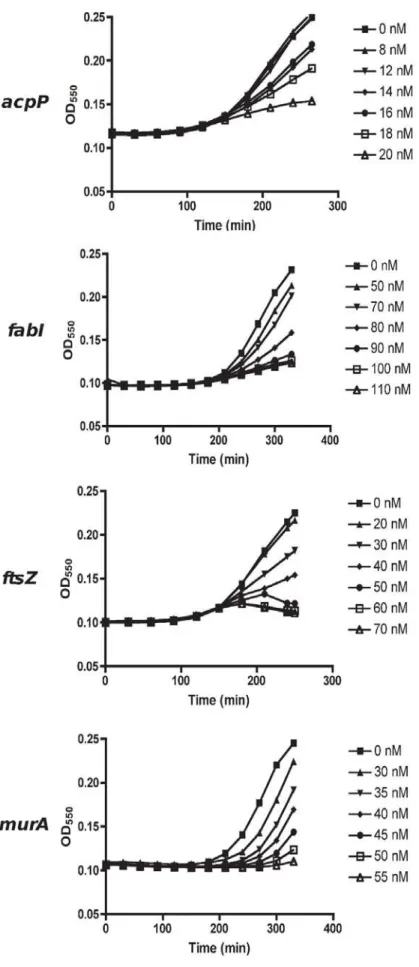
To test the hypothesis that essential genes are differentially required to maintain a similar level of growth, we titrated down the growth rate ofE. coliusing either antisense PNA or expressed antisense and determined mRNA levels of the targeted essential gene. To enable parallel analyses of multiple genes in this study, we used RT-PCR to quantify mRNA levels and assume it as a proxy to protein measure in bacteria [39]. For PNA-mediated antisense effects, we used the hyper-permeableE. colistrain AS19 to obtain efficient uptake [40]. Six doses of each antisense PNA were selected in order to achieve a titration inE. coligrowth rate reduction. Hence, the dose range of each antisense PNA was unique, resulting in growth inhibition in a dose dependent manner (Figure 2). For expressed antisense, plasmids were transformed into TOP10E. colicells (Table 2) and antisense RNA expression was induced using IPTG at concentrations that provided a titration of decreasing growth rates (not shown).
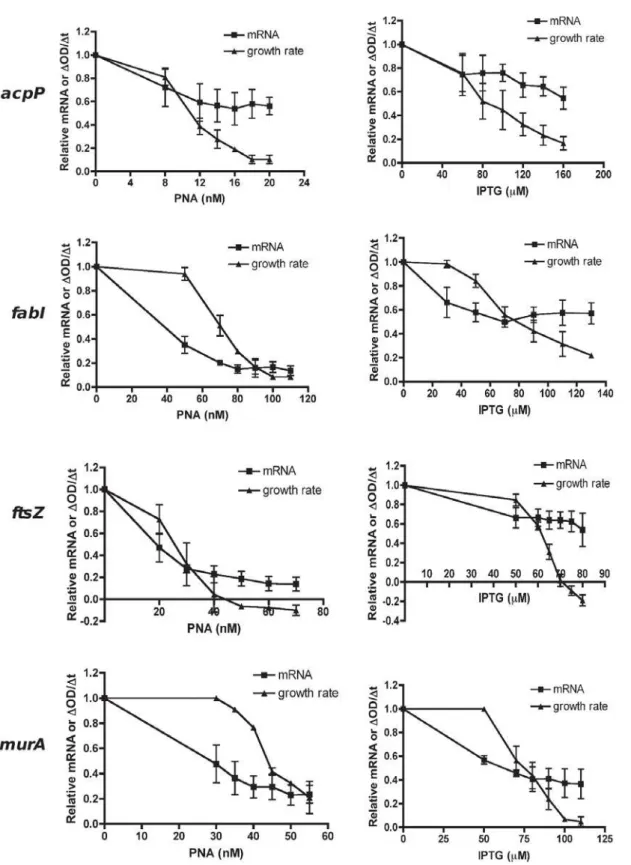
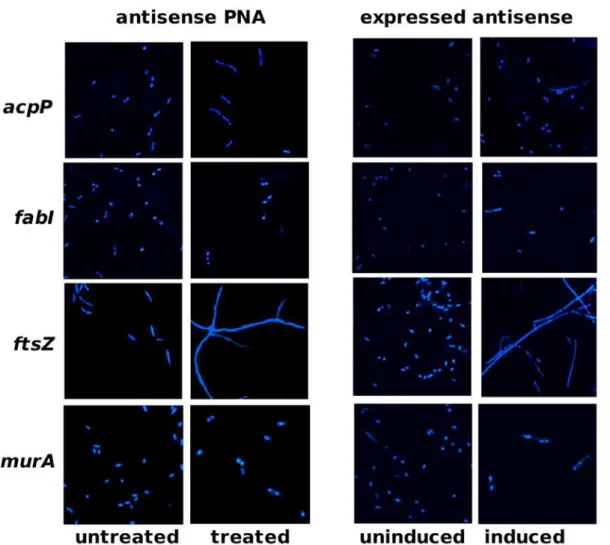
Both antisense PNA and expressed antisense specifically silenced mRNA of essential genes acpP, fabI, ftsZ or murA, as determined by analyses of transcript levels over an appropriate range of inhibitory but not lethal doses (Figure 3). Decreases in essential gene transcripts corresponded to decreases in bacterial growth rates (PNA data: R2foracpP,fabI,ftsZ,murA= 0.87, 0.63, 0.89, 0.45), although the response was non-linear. It should be noted that the growth profiles observed forftsZ-inhibited cultures, which displayed a rise and then a fall in culture turbidity, were consistent with a cell-division effect observed previously, where cells elongate without dividing [41,42]. Phenotypic effects offtsZ -inhibited cultures were confirmed by microscopy, revealing extremely elongated cells compared to untreated cells and cells treated with other PNAs. Cell phenotypes for antisense-expressing cells were similar to that of antisense PNA-treated cells (Figure 4).
Essential gene stringencies and minimum level transcript 50 as a measure
The relationship between the decrease in mRNA and growth rate determined by both silencing methods indicates that the requirement for the four essential genes is unequal, with some genes more stringently required than others. Indeed, expressing relative growth rate as a function of relative mRNA level (Figure 5) showed that the minimum level of mRNA needed for 50% cell viability is in the orderacpP.ftsZ.murA.fabIby antisense PNA. That is, a large number of acpPtranscripts (approximately 0.65 relative value or 65% of a normal cell) is required to maintain 50% cell viability, compared toftsZ(38%),murA(30%) andfabI(20%) transcripts. In other words, a small decrease inacpPmRNA led to a large decrease in bacterial growth rates, while decreases inftsZ
Figure 1. Transcomplementation of antisense PNA and expressed antisense RNA effects on growth by target gene over-expression.
Essential gene over-expression was induced by L-arabinose at indicated concentrations. PNAs were added to a final concentration of 4mM. Concentrations of IPTG used for induction ofacpP-,fabI-,ftsZ- andmurA-antisense expression were 200mM, 1 mM, 100mM and 75 mM, respectively. doi:10.1371/journal.pone.0006061.g001
acpP.ftsZ.fabI.murA by expressed antisense (Figure 5), which differs from the PNA data in that murA is the least stringently required essential gene for growth rather thanfabI.
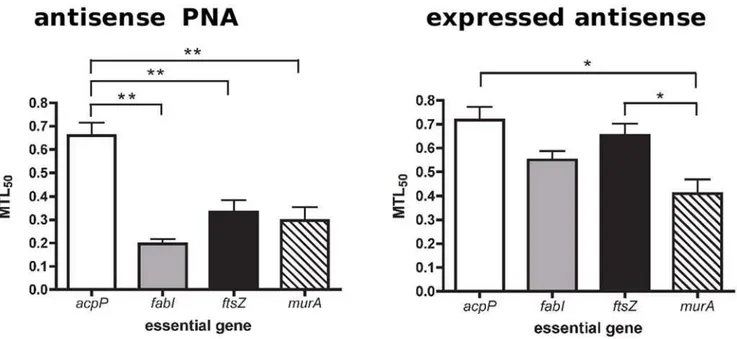
Based on the above data, we propose minimum transcript level 50 (MTL50) as a measure of stringent requirement, somewhat similar to the IC50measure of enzyme inhibition. MTL50values directly reflect the relationship between the level of a particular mRNA and growth rate decline, thus indicating how stringently required an essential gene is for growth. By plotting the values of relative growth rate against relative mRNA level for each gene on the same graph, we are able to estimate the value of relative mRNA (MTL50) at 50% growth rate (Figure 5). We observed that a shift to the right indicates greater stringency as the minimum level of transcript needed to sustain 50% cell viability increases. Hence, a high MTL50value indicates high gene stringency. This is because the value indicates the minimum required level of transcript for viability, not the minimum inhibition level of transcript, and hence differs from IC50 in this respect. Compar-isons of the MTL50values, determined by the two different gene-silencing methods, are shown in Figure 6. In general, MTL50 values were higher in the expressed antisense cultures compared to antisense PNA treated cultures. Both methods found that the most stringently required essential gene was acpP, followed by ftsZ. Antisense PNA silencing showed fabI to be the least stringent, whereas expressed antisense silencing foundmurAwas significantly less stringently required, relative to the other four essential genes examined (Figures 5 and 6).
Discussion
Cell growth and mRNA profiles following expressed antisense RNA silencing differed somewhat from those following antisense PNA silencing, possibly reflecting different mechanisms of silencing. Nevertheless, the data reject the null hypothesis of equal stringent requirement for growth essential genes and support our premise that essential genes differ in their level of requirement for growth. Indeed, both RNA silencing methods indicate significant differences in gene stringency and reveal acpP as the most stringently required essential gene, followed by ftsZ, out of the four that were studied. As the MTL50 value of each gene is calculated relative to appropriate unsilenced controls, differences in basal expression of the different essential genes will not affect the stringency ranking.
The stringency ranking ofmurAandfabIdiffered between PNA-treated cells and antisense-expressing cells, probably because of differences between PNA and RNA chemistry, size differences between the two types of silencers and subtle differences in the mechanisms of gene silencing. For example, antisense PNAs act directly through steric hindrance of translation initiation and may indirectly trigger decay of repressed transcripts, whereas antisense RNAs may act both by steric hindrance and by direct activation of
dsRNA-mediated cleavage at the target site. Ideally, protein quantification should be carried out in parallel with RT-PCR, however, biochemical assays to confirm antisense inhibition of
acpP,fabI,ftsZandmurAwere not carried out due to the technical difficulties involved in harvesting sufficient culture biomass and quantitative protein assays are lacking for many genes of interest. Current methods are limited to the use of antibodies [33,43] or intracellular peptide expression [44]. Nevertheless, correlation between mRNA and protein levels in bacteria has been demonstrated for some genes [25,39,45,46,47], suggesting that the MTL values reported here provide a useful measure of gene requirement.
Four genes were compared in this study and only acpP does not encode for an enzyme. However, the finding of acpP being more critically required thanftsZ, fabI and murA is not entirely surprising. ACP is known to interact with a large number of proteins in the fatty acid biosynthesis pathway [5] and reduction in levels of active ACP results in cell toxicity [33,36]. In addition, ACP interacts with proteins not involved in lipid synthesis [48]. Therefore, ACP is needed in large quantities and a slight decrease in ACP levels may be amplified through its interacting partners, leading to widespread physiological effects. Indeed,acpPtranscripts and protein products are abundant inE. coli [49,50]. FtsZ was recently found to have GTPase activity [51], however, it interacts with at least four proteins and is a component of the complex divisome [52]. From the point of view of gene product regulation, FtsZ concentrations dictate the initiation of cell division through interaction with FtsA and FtsQ [53]. In contrast, FabI and MurA interact with fewer proteins [5] possibly because they catalyze specific reactions. Also, FabI is the catalytic end point in fatty acid elongation and is subject to feedback inhibition by acyl-ACP in the fatty acid elongation cycle [54], and MurA is the catalytic starting point in peptidoglycan assembly [27] and may be regulated through feedback inhibition by UDP-N-acetylmuramic acid, a down-stream product in the pathway [55]. Hence, it can be argued that changes in ACP or FtsZ levels are less tolerated than changes in FabI and MurA levels.
Specific control of single gene expression within a bacterial operon remains a challenge due to the polycistronic nature of transcripts. Indeed, antisense PNAs targeting genes of the lac
operon have polar effects on transcript stability and translation [39]. To avoid this problem, we selected genes that are less likely to be affected: fabI and murA are predicted by RegulonDB (regulondb.ccg.unam.mx) and EcoCyc (http://ecocyc.org/) to be individually transcribed,ftsZ, which is at the 39end of an operon [24], andacpP, which is transcribed either alone or withfabF[25], a non-essential gene involved in thermal regulation of fatty acid biosynthesis [56]. We note that the potency of theacpP-specific PNA may be due to inhibition offabFexpression as well, although this seems unlikely, as it has been reported that tandem mutation Table 1.Properties of PNA used in this study.
PNA Sequence Target Target location* and length Reference/source
Ec107 (KFF)3K-eg1-cccatagctt fabI 25 to+5 (10 nt.) [11]
Ec108 (KFF)3K-eg1-ctcatactct acpP 25 to+5 (10 nt.) [57]
Ec326 (KFF)3K-eg1-tcaaacatag ftsZ 22 to+8 (10 nt.) This study
Ec330 (KFF)3K-eg-1-tttagtttgt murA 29 to+1 (10 nt.) This study
Figure 2. Dose dependent growth inhibition of antisense PNA-treated AS19 cells.Overnight AS19 cultures were sub-cultured in fresh media containing different PNA doses for each gene, and its growth monitored by turbidity. Six doses were chosen for each PNA, so as to obtain a titration in growth inhibition. Growth profiles terminated when all cultures were harvested atDOD550,0.1 of the untreated culture, for transcript analyses. doi:10.1371/journal.pone.0006061.g002
in another gene (fabB) is needed for growth inhibition [56], and anti-acpPeffects are rescued by plasmidacpP transcomplementa-tion [37].
In summary, our results show essential genes are differentially required and their requirement level appears to reflect the extent of predicted protein-protein interactions. Both PNA and expressed antisense gene silencing methods gave similar results, despite having different inhibitory mechanisms. Therefore RNA silencing can be used to confirm and quantify essential gene requirement and serve as a molecular pre-screen, before investing in a search for specific inhibitors. It may also provide a useful tool for identifying reference genes for quantitative transcript profiling.
Materials and Methods
Bacteria and growth conditions for specificity testing of antisense agents
E. coli strain DH5a (Invitrogen) was transformed with
recombinant plasmids pBAD-fabI, pBAD-acpP, pBAD-ftsZ and pBAD-murA (Table 2 and below) and clones were used for testing the specificity of gene silencing either by PNA treatment or antisense expression. OvernightE. colicultures were standardized by OD550 readings to approximately 2610
4
cfu/ml. To test the specificity of antisense PNA, clones were grown in Mueller-Hinton broth (MHB; Oxoid) supplemented with ampicillin (100mg/ml)
and 4mM of gene-specific antisense PNA in aqueous solution,
either with or without 0.02–0.2% L-arabinose (Sigma) for induction of essential gene over-expression. Concentrations of L-arabinose were optimized for each clone.
To test expressed antisense specificity, clones containing both essential gene over-expressing plasmid and antisense-expressing plasmid (see below) were grown in MHB supplemented with ampicillin (100mg/ml) plus chloramphenicol (30mg/ml) and 0.1–
75 mM IPTG (for induction of expressed antisense), either with or without 0.02–0.2% L-arabinose for induction of essential gene over-expression. Concentrations of IPTG and L-arabinose were optimized for each clone. Bacterial cultures were grown in a Bio-Tek PowerWave X340 spectrophotometer at 37uC with agitation every 5 min in 200ml volumes in a 96-well plate. Growth was monitored by OD550readings every 5 min. Each experiment was performed in triplicate.
Plasmids and strains used for testing specificity of antisense agents
The ORFs of the four essential genes were cloned into the multiple cloning site (MCS) of pBAD/HisA vector (Invitrogen), allowing gene over-expression from the L-arabinose-inducible promoter. Sequences were amplified from K12 genomic DNA using primers acpP-OF/R, ftsZ-OF/R, murA-OF/R and fabI-OF/R, specific for acpP, ftsZ, murA and fabI, respectively (Table S1). Amplicons were digested withNcoIandXhoI(Fermentas) and cloned into the pBAD/HisA vector containing similarly digested ends. Recombinant plasmids were transformed intoE. coliDH5a
cells and selected on LB plates supplemented with ampicillin (100mg/ml). Clones were then used for testing specificity of the
PNA treatment. For testing specificity of the expressed antisense, clones containing either pBAD-fabI, pBAD-acpP, pBAD-ftsZ or pBAD-murA were further transformed with respective antisense-carrying plasmid, i.e. pHN682, pHNA, pHNZ or pHNM (Table 2 and below), and selected on LB plates supplemented with ampicillin (100mg/ml) and chloramphenicol (30mg/ml).
Bacteria, growth conditions, PNA treatment and antisense expression for gene silencing
E. colistrain AS19 with a hyper-permeable phenotype was used in PNA treatments (total of 6 doses; Table 1) [40]. AS19 cultures in Mueller-Hinton broth (DIFCO) used for PNA (Panagene, Korea) treatments were prepared as described previously [57], and PNA concentrations (0–110 nM) were optimized for a titration in growth inhibition. TOP10 E. coli (Invitrogen) was used in transformation reactions of plasmids expressing antisense sequenc-es (Table 2). Antisense exprsequenc-ession was induced by various concentrations of IPTG (total of 6 doses) added to LB supplemented with chloramphenicol (30mg/ml; Sigma). Over-night cultures of antisense-expressing clones were standardized by OD550 readings to approximately 26105cfu/ml for IPTG induction. For antisense PNA treatment and IPTG induction, 20ml of the appropriate PNA or IPTG concentration in aqueous solution was deposited into each well of a 96 well plate before the addition ofE. coli in liquid culture to a final volume of 200ml. Bacterial cultures were then grown in a VERSAmax spectropho-tometer at 37uC with agitation for 5 s every 5 min. Growth was monitored by OD550readings every 5 min and all cultures were harvested when the untreated control increased in turbidity of Table 2.Plasmids used in this study.
Plasmid Relevant characteristic Purpose
Antisense target location* and length
Reference/ source
pBAD/HisA Arabinose inducible promoter (PBAD), AmpR Inducible expression of essential genes n.a. Invitrogen
pBAD-fabI fabIORF Inducible over-expression offabI n.a This study
pBAD-acpP acpPORF Inducible over-expression ofacpP n.a. This study
pBAD-ftsZ ftsZORF Inducible over-expression offtsZ n.a This study
pBAD-murA murAORF Inducible over-expression ofmurA n.a. This study
pHN678 IPTG inducible promoter (Ptrc), paired-termini flanking MCS, CamR
Stabilized antisense expression vector n.a. [12]
pHN682 fabIantisense insert Inducible expression offabIantisense 274 to+86 offabI(160 nt.) [12]
pHNA acpPantisense insert Inducible expression ofacpPantisense 242 to+85 ofacpP(127 nt.) This study
pHNZ ftsZantisense insert Inducible expression offtsZantisense 253 to+76 offtsZ(129 nt.) This study
pHNM murAantisense insert Inducible expression ofmurAantisense 254 to+76 ofmurA(130 nt.) This study
Figure 3. Gene silencing inE. colito obtain a titration of declining growth rates and transcript levels by antisense PNA and expressed antisense.E. coliAS19 was treated with PNA doses, while TOP10 clones containing antisense-expressing plasmids were induced with various IPTG concentrations as shown in Figure 2, so as to obtain growth inhibition in a dose-dependent manner. Total RNA fromE. colicultures was harvested at the time when the control culture increased in OD550by 0.1. RNA was used for cDNA synthesis and quantitative real-time PCR to determine mRNA levels by
normalization to a reference generpoA, and then calculated relative to the unsilenced (untreated) control. Growth rates were determined by OD550
readings over time. The relationship between mRNA and growth rate decline indicated growth requirement stringency of each gene. doi:10.1371/journal.pone.0006061.g003
Figure 4. Effect of gene silencers on cell morphology.Cells were stained with DAPI before fluorescent microscopy. Left panel: AS19 untreated or treated with antisense PNA Ec108 (20 nM) targetingacpP, Ec107 (80 nM) targetingfabI, Ec326 (70 nM) targetingftsZor Ec330 (55 nM) targeting
murA. Gross elongation of cells was observed only in cultures treated withftsZ-specific PNA, Ec326. Right panel: TOP10 clones uninduced or induced with IPTG for antisense RNA expression. Concentrations of IPTG used for induction ofacpP-,fabI-,ftsZ- andmurA-antisense expression were 160mM, 130mM, 80mM and 80mM, respectively. Cells expressingftsZ-antisense were grossly elongated compared to other cells.
doi:10.1371/journal.pone.0006061.g004
Figure 5. Determining the MTL50value of each gene.For each gene, mean relative mRNA and growth rate values from Figure 3 were transformed so that mean relative mRNA values were plotted against corresponding mean values of relative growth rates to obtain a curve. The curve of each gene allows an estimation of a transcript value (on the x-axis) at a growth reduction of 50% (y = 0.5), that is, the MTL50value of the gene of
interest. The MTL50value reveals stringency of an essential gene for growth.
,0.1. Wells containing the same treatment were pooled at harvest and cells were pelleted for RNA extraction. Growth rate was calculated asDOD/Dt.
Design of antisense PNA for gene silencing
Antisense PNA specific for acpP (Ec108), fabI (Ec107), ftsZ
(Ec326) andmurA(Ec330) were designed using optimal parameters for gene silencing [37,38] (Table 1). Briefly, these parameters are: 9–12 mer PNA of an antisense sequence targeting the region of
210 to+10 around the start codon and conjugated to a cell wall-permeating peptide (KFF)3K. Candidate antisense sequences within the stated start codon region were checked for sequence uniqueness in similar regions using an E. coli database (http:// genolist.pasteur.fr/Colibri/) before testing antisense inhibition of growth and gene expression, as described above and below.
Plasmid expressing antisense for gene silencing
Antisense sequences were chosen based on length, location (120– 160 nt around the start codon to include promoter and coding regions) [12] and for minimal secondary structures, which were predicted by RNAfold (http://www.tbi.univie.ac.at/RNA/RNA-fold.html). Antisense sequences were cloned into the MCS of pHN678, which is flanked by a 38 bp paired-termini to stabilize antisense RNA inserts [12]. Antisense sequences of essential genes were amplified from K12 genomic DNA with primers acpP-XF1/R2, ftsZ-XF5/R5 and murA-XF/R specific for acpP, ftsZand murA, respectively (Table S1). Amplicons were then digested withNcoI and
XhoI and cloned into pHN678 with similarly digested ends. Recombinant plasmids were transformed in TOP10 cells and selected on LB supplemented with chloramphenicol (30mg/ml). The fabI
antisense expressing plasmid pHN682 has been described [12].
Fluorescence microscopy
E. coliAS19 cultures were either left untreated or treated with sub-inhibitory (dose 3) and inhibitory (dose 6) concentrations of
PNA and then viewed by fluorescence microscopy. Similarly,E. coliTOP10 cultures either left uninduced or induced with IPTG for moderate (dose 3) or high expression (dose 6) of antisense sequences were viewed microscopically. Cells were grown and harvested as described above, where 1 ml of cells were pooled and pelleted. Cells were washed once in an equal volume of 16PBS, suspended in 100ml of 16PBS, and stained with DAPI (1mM) for 5 min. Cells were viewed at 10006magnification in a Leica DMRA2 microscope and images were captured and processed using Openlab software version 3.1.4.
RNA extraction, reverse transcription and qPCR
Extraction of RNA from bacterial cells, followed by DNase I treatment were carried out using the RiboPure Bacteria Kit (Ambion) according to the manufacturer’s protocol. RNA (200–500 ng) was converted to cDNA in a 25ml reaction
consisting of 16RT reaction buffer, 5.5 mM MgCl2, 0.5 mM of each dNTP, 2.5mM random hexamers, 0.4 U/ml RNase inhibitor, and 1.25 U/ml MultiScribe Reverse Transcriptase (Applied Biosystems). Each 25ml of PCR reaction contained 12.5ml of SYBR Green PCR buffer (Eurogentec), 100 nM of each primer (Biomers) and 5ml of cDNA. Relative qPCR was carried out with primers acpP-F/R, fabI-F/R, ftsZ-F/R, murA-F/R specific for acpP, fabI, ftsZ and murA, respectively, as the target gene, and primers rpoA-F/R specific for rpoA as the reference gene (Table S1). Target and reference primer pairs were validated for amplification efficiencies for real time data analyses, either by the 2-DDCT method [58] for primers with similar efficiencies, or the 2DCT (target)/2DCT (reference) method for primers with different efficiencies [59] for relative qPCR. Quantitation of acpP, fabI, ftsZ and murA mRNA was normalized against rpoA mRNA and calculated relative to the untreated sample. Mean values with error bars, representing standard deviation from three experimental replicates, were plotted against PNA or IPTG doses.
Figure 6. Analysis of essential gene MTL50values.Three curves from triplicate experiments of each gene were plotted so as to obtain three MTL50values for statistical analyses. Significant difference (** = p,0.01, * = p,0.05) in MTL50between genes was determined by a one-way ANOVA
and Tukey HSD Test. Antisense PNA silencing (left panel) showed MTL50ofacpPto be significantly greater than the other three genes. Expressed
antisense RNA silencing (right panel) showed MTL50ofacpPandftsZwas significantly greater than that ofmurAonly.
doi:10.1371/journal.pone.0006061.g006
MTL50calculation
For each gene, data points fromDOD/Dt per PNA or IPTG
concentration (Figure 2) were plotted against relative mRNA per PNA or IPTG concentration (Figure 2) on a new graph. This results in a curve of relativeDOD/Dt against relative mRNA for
each gene, from which the MTL50is estimated. The x-axis value where the curve intersects y = 0.5 (for 50% reduction in growth) gives the MTL50 value. As each experiment was carried out in triplicate, each gene had three curves from PNA treatment and three curves from expressed antisense experiments. For simplicity, only mean data resulting in an average curve for each gene is shown in Figure 3. Triplicate MTL50 values, estimated from triplicate curves, were used for statistical analysis in Figure 6.
Statistical analysis
Statistical analyses of R2 for correlation, mean6SD and ANOVA were carried out using Excel. Tukey HSD Test for post-ANOVA comparisons was calculated at http://faculty.vassar. edu/lowry/hsd.html
Supporting Information
Table S1 Primers used in this study.
Found at: doi:10.1371/journal.pone.0006061.s001 (0.06 MB DOC)
Acknowledgments
We thank the Swedish Institute for a Guest Scholarship to SG, Bloomsbury Colleges for a scholarship to JMB and the Swedish Research Council, the University of London Central Research Fund, and the Sasakawa Foundation for support. We also thank Rikard Dryselius, Mark Schreiber, Abbas Nikravesh, and Omid Faradani for help and comments.
Author Contributions
Conceived and designed the experiments: LG. Performed the experiments: SG. Analyzed the data: SG LG. Wrote the paper: SG LG. Carried out cloning of fabI, ftsZ and murA over-expressing strains and all antisense RNA rescue experiments: JMB. Carried out cloning of acpP over-expressing strain: NN. Helped design and supervise rescue experiments: JS.
References
1. Vergidis PI, Falagas ME (2008) Multidrug-resistant Gram-negative bacterial infections: the emerging threat and potential novel treatment options. Curr Opin Investig Drugs 9: 176–183.
2. Baba T, Ara T, Hasegawa M, Takai Y, Okumura Y, et al. (2006) Construction of Escherichia coli K-12 in-frame, single-gene knockout mutants: the Keio collection. Mol Syst Biol 2: 2006 0008.
3. Forsyth RA, Haselbeck RJ, Ohlsen KL, Yamamoto RT, Xu H, et al. (2002) A genome-wide strategy for the identification of essential genes inStaphylococcus aureus. Mol Microbiol 43: 1387–1400.
4. Yu BJ, Sung BH, Koob MD, Lee CH, Lee JH, et al. (2002) Minimization of the Escherichia coli genome using a Tn5-targeted Cre/loxP excision system. Nat Biotechnol 20: 1018–1023.
5. Butland G, Peregrin-Alvarez JM, Li J, Yang W, Yang X, et al. (2005) Interaction network containing conserved and essential protein complexes inEscherichia coli. Nature 433: 531–537.
6. Yellaboina S, Goyal K, Mande SC (2007) Inferring genome-wide functional linkages inE. coliby combining improved genome context methods: comparison with high-throughput experimental data. Genome Res 17: 527–535. 7. Cheng AC, Coleman RG, Smyth KT, Cao Q, Soulard P, et al. (2007)
Structure-based maximal affinity model predicts small-molecule druggability. Nat Biotechnol 25: 71–75.
8. Myllykallio H, Leduc D, Filee J, Liebl U (2003) Life without dihydrofolate reductase FolA. Trends Microbiol 11: 220–223.
9. Badarinarayana V, Estep PW 3rd, Shendure J, Edwards J, Tavazoie S, et al. (2001) Selection analyses of insertional mutants using subgenic-resolution arrays. Nat Biotechnol 19: 1060–1065.
10. Herring CD, Blattner FR (2004) Conditional lethal amber mutations in essential Escherichia coligenes. J Bacteriol 186: 2673–2681.
11. Dryselius R, Nekhotiaeva N, Good L (2005) Antimicrobial synergy between mRNA- and protein-level inhibitors. J Antimicrob Chemother 56: 97–103. 12. Nakashima N, Tamura T, Good L (2006) Paired termini stabilize antisense
RNAs and enhance conditional gene silencing inEscherichia coli. Nucleic Acids Res 34: e138.
13. Nekhotiaeva N, Awasthi SK, Nielsen PE, Good L (2004) Inhibition of Staphylococcus aureusgene expression and growth using antisense peptide nucleic acids. Mol Ther 10: 652–659.
14. Pragman AA, Ji Y, Schlievert PM (2007) Repression ofStaphylococcus aureusSrrAB using inducible antisensesrrAalters growth and virulence factor transcript levels. Biochemistry 46: 314–321.
15. Kulyte A, Nekhotiaeva N, Awasthi SK, Good L (2005) Inhibition of Mycobacterium smegmatis gene expression and growth using antisense peptide nucleic acids. J Mol Microbiol Biotechnol 9: 101–109.
16. Harth G, Zamecnik PC, Tabatadze D, Pierson K, Horwitz MA (2007) Hairpin extensions enhance the efficacy of mycolyl transferase-specific antisense oligonucleotides targetingMycobacterium tuberculosis. Proc Natl Acad Sci U S A 104: 7199–7204.
17. Heath RJ, Rock CO (1995) Enoyl-acyl carrier protein reductase (FabI) plays a determinant role in completing cycles of fatty acid elongation inEscherichia coli. J Biol Chem 270: 26538–26542.
18. Brown ED, Vivas EI, Walsh CT, Kolter R (1995) MurA (MurZ), the enzyme that catalyzes the first committed step in peptidoglycan biosynthesis, is essential inEscherichia coli. J Bacteriol 177: 4194–4197.
19. Addinall SG, Small E, Whitaker D, Sturrock S, Donachie WD, et al. (2005) New temperature-sensitive alleles offtsZinEscherichia coli. J Bacteriol 187: 358–365.
20. De Lay NR, Cronan JE (2006) Gene-specific random mutagenesis ofEscherichia coli in vivo: isolation of temperature-sensitive mutations in the acyl carrier protein of fatty acid synthesis. J Bacteriol 188: 287–296.
21. Eschenburg S, Priestman MA, Abdul-Latif FA, Delachaume C, Fassy F, et al. (2005) A novel inhibitor that suspends the induced fit mechanism of UDP-N-acetylglucosamine enolpyruvyl transferase (MurA). J Biol Chem 280: 14070–14075.
22. Jaiswal R, Beuria TK, Mohan R, Mahajan SK, Panda D (2007) Totarol inhibits bacterial cytokinesis by perturbing the assembly dynamics of FtsZ. Biochemistry 46: 4211–4220.
23. Tasdemir D, Topaloglu B, Perozzo R, Brun R, O’Neill R, et al. (2007) Marine natural products from the Turkish spongeAgelas oroidesthat inhibit the enoyl reductases fromPlasmodium falciparum, Mycobacterium tuberculosisandEscherichia coli. Bioorg Med Chem 15: 6834–6845.
24. Flardh K, Garrido T, Vicente M (1997) Contribution of individual promoters in theddlB-ftsZregion to the transcription of the essential cell-division geneftsZin Escherichia coli. Mol Microbiol 24: 927–936.
25. Zhang Y, Cronan JE Jr (1996) Polar allele duplication for transcriptional analysis of consecutive essential genes: application to a cluster ofEscherichia colifatty acid biosynthetic genes. J Bacteriol 178: 3614–3620.
26. Heath RJ, Rubin JR, Holland DR, Zhang E, Snow ME, et al. (1999) Mechanism of triclosan inhibition of bacterial fatty acid synthesis. J Biol Chem 274: 11110–11114.
27. Marquardt JL, Siegele DA, Kolter R, Walsh CT (1992) Cloning and sequencing ofEscherichia coli murZand purification of its product, a UDP-N-acetylglucosa-mine enolpyruvyl transferase. J Bacteriol 174: 5748–5752.
28. Marquardt JL, Brown ED, Lane WS, Haley TM, Ichikawa Y, et al. (1994) Kinetics, stoichiometry, and identification of the reactive thiolate in the inactivation of UDP-GlcNAc enolpyruvoyl transferase by the antibiotic fosfomycin. Biochemistry 33: 10646–10651.
29. Schonbrunn E, Eschenburg S, Krekel F, Luger K, Amrhein N (2000) Role of the loop containing residue 115 in the induced-fit mechanism of the bacterial cell wall biosynthetic enzyme MurA. Biochemistry 39: 2164–2173.
30. Tsao DH, Sutherland AG, Jennings LD, Li Y, Rush TS 3rd, et al. (2006) Discovery of novel inhibitors of the ZipA/FtsZ complex by NMR fragment screening coupled with structure-based design. Bioorg Med Chem 14: 7953–7961.
31. Bi EF, Lutkenhaus J (1991) FtsZ ring structure associated with division in Escherichia coli. Nature 354: 161–164.
32. Majerus PW, Alberts AW, Vagelos PR (1964) The acyl carrier protein of fatty acid synthesis: purification, physical properties, and substrate binding site. Proc Natl Acad Sci U S A 51: 1231–1238.
33. Jackowski S, Rock CO (1983) Ratio of active to inactive forms of acyl carrier protein inEscherichia coli. J Biol Chem 258: 15186–15191.
34. Tan XX, Actor JK, Chen Y (2005) Peptide nucleic acid antisense oligomer as a therapeutic strategy against bacterial infection: proof of principle using mouse intraperitoneal infection. Antimicrob Agents Chemother 49: 3203–3207. 35. Tilley LD, Mellbye BL, Puckett SE, Iversen PL, Geller BL (2007) Antisense
peptide-phosphorodiamidate morpholino oligomer conjugate: dose-response in mice infected withEscherichia coli. J Antimicrob Chemother 59: 66–73. 36. Zhang YM, Frank MW, Virga KG, Lee RE, Rock CO, et al. (2004) Acyl carrier
protein is a cellular target for the antibacterial action of the pantothenamide class of pantothenate antimetabolites. J Biol Chem 279: 50969–50975. 37. Good L, Awasthi SK, Dryselius R, Larsson O, Nielsen PE (2001) Bactericidal
38. Dryselius R, Aswasti SK, Rajarao GK, Nielsen PE, Good L (2003) The translation start codon region is sensitive to antisense PNA inhibition in Escherichia coli. Oligonucleotides 13: 427–433.
39. Dryselius R, Nikravesh A, Kulyte A, Goh S, Good L (2006) Variable coordination of cotranscribed genes in Escherichia coli following antisense repression. BMC Microbiol 6: 97.
40. Good L, Nielsen PE (1998) Antisense inhibition of gene expression in bacteria by PNA targeted to mRNA. Nat Biotechnol 16: 355–358.
41. Varma A, Young KD (2004) FtsZ collaborates with penicillin binding proteins to generate bacterial cell shape inEscherichia coli. J Bacteriol 186: 6768–6774. 42. Goehring NW, Petrovska I, Boyd D, Beckwith J (2007) Mutants, suppressors,
and wrinkled colonies: mutant alleles of the cell division geneftsQpoint to functional domains in FtsQ and a role for domain 1C of FtsA in divisome assembly. J Bacteriol 189: 633–645.
43. Voskuil JL, Westerbeek CA, Wu C, Kolk AH, Nanninga N (1994) Epitope mapping ofEscherichia colicell division protein FtsZ with monoclonal antibodies. J Bacteriol 176: 1886–1893.
44. Benson RE, Gottlin EB, Christensen DJ, Hamilton PT (2003) Intracellular expression of peptide fusions for demonstration of protein essentiality in bacteria. Antimicrob Agents Chemother 47: 2875–2881.
45. McCormick JR, Zengel JM, Lindahl L (1994) Correlation of translation efficiency with the decay oflacZmRNA in Escherichia coli. J Mol Biol 239: 608–622.
46. Nie L, Wu G, Zhang W (2006) Correlation of mRNA expression and protein abundance affected by multiple sequence features related to translational efficiency in Desulfovibrio vulgaris: a quantitative analysis. Genetics 174: 2229–2243.
47. Cox RA (2007) A scheme for the analysis of microarray measurements based on a quantitative theoretical framework for bacterial cell growth: application to studies ofMycobacterium tuberculosis. Microbiology 153: 3337–3349.
48. Gully D, Moinier D, Loiseau L, Bouveret E (2003) New partners of acyl carrier protein detected inEscherichia coliby tandem affinity purification. FEBS Lett 548: 90–96.
49. Powell GL, Elovson J, Vagelos PR (1969) Acyl carrier protein. XII. Synthesis and turnover of the prosthetic group of acyl carrier proteinin vivo. J Biol Chem 244: 5616–5624.
50. Zhang Y, Cronan JE Jr (1998) Transcriptional analysis of essential genes of the Escherichia colifatty acid biosynthesis gene cluster by functional replacement with the analogousSalmonella typhimuriumgene cluster. J Bacteriol 180: 3295–3303. 51. Mendieta J, Rico AI, Lopez-Vinas E, Vicente M, Mingorance J, et al. (2009)
Structural and functional model for ionic (K(+)/Na(+)) and pH dependence of GTPase activity and polymerization of FtsZ, the prokaryotic ortholog of tubulin. J Mol Biol (epub ahead of print).
52. Harry E, Monahan L, Thompson L (2006) Bacterial cell division: the mechanism and its precison. Int Rev Cytol 253: 27–94.
53. Palacios P, Vicente M, Sanchez M (1996) Dependency ofEscherichia coli cell-division size, and independency of nucleoid segregation on the mode and level of ftsZexpression. Mol Microbiol 20: 1093–1098.
54. Heath RJ, Rock CO (1996) Regulation of fatty acid elongation and initiation by acyl-acyl carrier protein inEscherichia coli. J Biol Chem 271: 1833–1836. 55. Mizyed S, Oddone A, Byczynski B, Hughes DW, Berti PJ (2005)
UDP-N-acetylmuramic acid (UDP-MurNAc) is a potent inhibitor of MurA (enolpyruvyl-UDP-GlcNAc synthase). Biochemistry 44: 4011–4017.
56. Garwin JL, Klages AL, Cronan JE Jr (1980) Beta-ketoacyl-acyl carrier protein synthase II ofEscherichia coli. Evidence for function in the thermal regulation of fatty acid synthesis. J Biol Chem 255: 3263–3265.
57. Nikravesh A, Dryselius R, Faridani OR, Goh S, Sadeghizadeh M, et al. (2007) Antisense PNA accumulates inEscherichia coliand mediates a long post-antibiotic effect. Mol Ther 15: 1537–1542.
58. Livak KJ, Schmittgen TD (2001) Analysis of relative gene expression data using real-time quantitative PCR and the 2(-Delta Delta C(T)) Method. Methods 25: 402–408.
59. Pfaffl MW (2001) A new mathematical model for relative quantification in real-time RT-PCR. Nucleic Acids Res 29: 2002–2007.