PANOECONOMICUS, 2011, 5, Special Issue, pp. 675-692
Received: 15 September 2011; Accepted: 5 November 2011.
UDC 338.23:336.74(72) DOI: 10.2298/PAN1105675C Original scientific paper
Carlos A. Carrasco Department of Applied Economics V, University of the Basque Country, Spain
Jesús Ferreiro Department of Applied Economics V, University of the Basque Country, Spain
This work was supported by the Basque Government (Consolidated Research Group GIC10/153) and the Vice-Rectorate for Research at the University of the Basque Country. An earlier version of the paper was presented at the 8th International Conference Developments in Economic Theory (Bilbao, Spain, June 29 to July 1, 2011). We thank the comments of the participants at that comments and those of an anonymous referee. The usual disclaimer applies.
Inflation Targeting and Economic
Performance: The Case of Mexico
Summary: In the paper we analyze the impact of Inflation Targeting (IT) in Mexico. The objective is to evaluate the impact of the implementation of infla-tion targeting and full-fledged inflainfla-tion targeting (FFIT) on the level and the variability of the inflation and the output in the Mexican economy. We conclude that inflation rates had been reduced in Mexico before the introduction of IT and FFIT. In our opinion, the structural reforms, including the Banxico reforms, are the main determinants of the decrease in inflation and its variability. The main impact of IT would have been the lock-in of inflation expectations around a low rate of inflation.
Key words:Inflation, Mexico, Inflation targeting.
JEL: E31, E52, E58, N16.
676 Carlos A. Carrasco and Jesús Ferreiro
targeters (Laurence Ball and Niamh Sheridan 2005), in particular the countries with pegged exchange rate regimes (Atish R. Ghosh and Jonathan D. Ostry 2009).
A number of papers argue that the performance of inflation targeters in terms of the price level stability is not significantly different from that achieved by coun-tries with other monetary strategies (Alvaro Angeriz and Arestis 2007a, 2007b, 2008; John McDermott and Peter McMenamin 2008; Carlos Capistrán and Manuel Ramos-Francia 2009). For these studies, the low and stable inflation rates registered during the “Great Moderation” are explained by a combination of international factors, like the process of globalization and the stronger immersion in the world economy of de-veloping countries like China and India (IMF 2005; Angeriz and Arestis 2008). At most, IT would have contributed to anchor expectations around a low inflation rate achieved before IT implementation (Refet S. Gürkaynak, Andrew T. Levin, and Eric T. Swanson 2006; Gürkaynak et al. 2007; Capistrán and Ramos-Francia 2010). Moreover, non-targeters recently have also seen their inflation expectations anchored at lower levels than in the past. Efrem Castelnuovo, Sergio Nicolerri-Altimari, and Diego Rodriguez-Palenzuela (2003), Ball and Sheridan (2005), and Angeriz and Ar-estis (2008) argue that the lock-in effect is similar in both groups of economies. In the words of the current Governor of the Bank of England (Mervyn King 2009): “In-flation targeting is a necessary but not sufficient condition for stability in the econ-omy as a whole.”
In addition, other authors argue that IT effects on inflation would not be ex-plained by the own strategy but by some of their features, like transparency and ac-countability, the increased autonomy granted to the central banks, and the restrictions to finance public budgets (Marco Arnone et al. 2007; Carl E. Walsh 2007; Alex Cuk-ierman 2008). IT effectiveness would be a function of a set of preconditions: institu-tional independence, a well-developed technical infrastructure, economic structure and a healthy financial system (IMF 2005). In this sense, although some authors ar-gue that the success do not depend on these preconditions, they also arar-gue that suc-cess depends on the policy-makers’ commitment and ability to apply institutional reforms once the IT has been implemented (Nicoletta Batini and Douglas Laxton 2007). In sum, the better performance of price stability would be the result of the existence of these preconditions and/or the existence of a proper political-institutional framework and not of the implementation of IT.
677
Inflation Targeting and Economic Performance: The Case of Mexico
impact of IT on inflation significantly diminishes (Freedman and Douglas Laxton 2009). Thus, for example, although Gonçalves and Salles (2008) argue that the im-plementation of IT had a significant effect on inflation in developing countries, it would only explain between 17.5% and 22.2% of the total inflation decrease in 13 developing economies that implemented this strategy. In a paper that studies the im-pact on inflation of the independence of central banks, Luis I. Jácome and Francisco Vazquez (2008) conclude that the impact of structural reforms is 10 times higher than the impact of the central bank independence.
Brito and Bystedt (2010) conclude, analyzing 46 developing countries, that the impact of IT on inflation is limited and not significant. Moreover, IT has a negative effect on output growth, thus doubting the effectiveness of this monetary strategy. Focusing on the Mexican case, some papers (Luis M. Galindo and Jaime Ros 2006, 2008; Victor M. Cuevas Ahumada 2008; Carlos A. Ibarra 2008; Eduardo Loria 2009; Guadalupe Mantey de Anguiano 2009) argue that the implementation of IT in Mex-ico may have negatively affected economic growth through its impact on the appre-ciation of the real exchange rate (Arestis 2009). Nelson H. Barbosa-Filho (2008) and Gerald Epstein and Erinc Yeldan (2008) reach a similar conclusion for Brazil and for a sample of developed and developing economies, respectively. Actually, defenders of IT emphasize the key role played by the exchange rate in IT emerging market economies (Mishkin 2000), and, in a recent paper, Osvaldo Kacef and Rafael López-Monti (2010) show that in some Latin American targeters, concerns about the real exchange rate have led central banks to intervene in the currency markets.
The above analysis shows that the conclusions about the impact of IT are not conclusive and generalized. This leads to the need for particular studies on concrete cases to assess the IT effectiveness in each country. The aim of this paper is to ana-lyze whether the implementation of IT in Mexico had a significant effect on inflation, or whether the inflation performance of this country is mainly related to other factors, such as increased Central Bank autonomy or the structural reforms. Full-Fledged Inflation Targeting1 in Mexico was preceded by a change in the monetary strategy, firstly by the reform in 1993 of Banco de Mexico’s Act increasing its autonomy, and, secondly, by adopting IT in 1999 as its monetary strategy.
The analysis of the Mexican case can shed light on the debates on the reasons of the generalized disinflation process registered in advanced and emerging and de-veloping economies, and on the role placed by IT in this process.
Moreover, the analysis contributes to distinguish the impact of the implemen-tation in 2001 of FFIT from the effects of the earlier implemenimplemen-tation of IT in 1999. By proceeding this way, we can asses the impact generated by the change in the strategy of monetary policy. With the implementation of the FFIT in 2001, Banxico set the inflation target on 3% (with a margin of ±1%). Thus, we can know whether
1
678 Carlos A. Carrasco and Jesús Ferreiro
the effects of IT in Mexico come from the permanent setting of an inflation target or from the institutional (central bank independence) and policy (inflation as priority objective of monetary policy) framework conforming the IT monetary strategy.
Our objective is to test whether the implementation of IT (in 1999) and/or FFIT (in 2001) have influenced inflation performance in Mexico.
The paper structures as follows. First, we make a short description of the main features of the implementation of the inflation targeting in Mexico. Second, we model inflation outcomes in Mexico following the methodology proposed by George E. P. Box and Gwilym Jenkins (1976) for univariate series and Box and George C. Tiao (1975) for intervention analysis, which allows to analyze the impact of the im-plementation of IT and FFIT monetary strategies. Third section compares the infla-tion performance in Mexico and the United States, both in terms of the levels and variability of inflation rates. We also check whether IT has affected the performance in terms of the Mexican economic growth. The final section summarizes and con-cludes. The evidence shows that the introduction of FFIT occurred in a context of stabilized inflation and the key change came from the changes in Banco de Mexico’s laws with IT serving as nominal anchor once inflation was reduced.
1. The Implementation of Inflation Targeting Monetary
Strategy in Mexico
Recent Mexican economic history can be classified into two periods according to the growth strategy implemented. The first period corresponds to the implementation of the “imports substitution industrialization”, which started with the administration of the President Lázaro Cárdenas in 1936 and ended at the beginning of the 1980s with the debt crisis and the private bank expropriation. In this strategy, the public sector was at the core of the whole economic process, driving the economic development and growth process. This growth strategy finished in the early eighties with the fall of international oil prices and the debt crisis. Forced by the debt crisis and the con-traction of the credit, Mexico adopted a new exports-led growth strategy.
Gov-679
Inflation Targeting and Economic Performance: The Case of Mexico
ernors for eight years. The term of the Governor will start on the first of January of the fourth year of the President of the Republic’s term. The terms of the Deputy Gov-ernors will be staggered, with one starting every other year on the first of January of the first, third and fifth years of the President’s term. The individuals occupying these posts may be appointed members of the Board of Governors for more than one term.” In addition, like in article 28 of Mexican Constitution, it was also approved that the President of Mexico made the appointment of the members, but that this ap-pointment had to be ratified by the Mexican Senate.
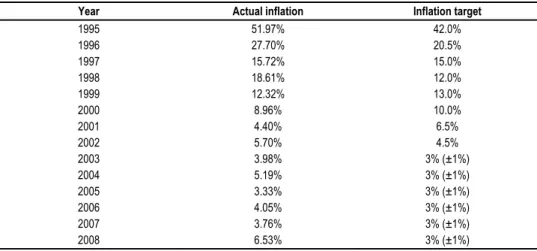
Table 1 Inflation Outcomes and Targets (1995-2008)
Year Actual inflation Inflation target
1995 51.97% 42.0% 1996 27.70% 20.5% 1997 15.72% 15.0% 1998 18.61% 12.0% 1999 12.32% 13.0% 2000 8.96% 10.0% 2001 4.40% 6.5% 2002 5.70% 4.5%
2003 3.98% 3% (±1%)
2004 5.19% 3% (±1%)
2005 3.33% 3% (±1%)
2006 4.05% 3% (±1%)
2007 3.76% 3% (±1%)
2008 6.53% 3% (±1%)
Source: Banco de México and Banco de Información Económica, INEGI, Mexico (1995-2008).
The independence of the Banco of Mexico and the priority given to price sta-bility as the main objective of the monetary policy paved the way for a later imple-mentation of the inflation targeting, which took place in 1999. FFIT monetary strat-egy was adopted two years later in 2001. Whilst in 1999 and 2000 the Banco of Mex-ico set the inflation targets on an annual basis, the implementation of the FFIT made that the Banco of Mexico set the target of inflation rate at 3% (within a range of ±1%). In the transition to this long-term objective, the Banco of Mexico also set the targets for the years 2001 (6.5%) and 2002 (4.5%). Table 1 shows the evolution since 1995 of the inflation rates and the inflation targets.
2. Modelling Inflation Performance in Mexico
In this section we will use monthly data of inflation since 1993:01 to 2009:09 to evaluate the introduction of IT and FFIT. The use of monthly data allows a more pre-cise analysis of the impact of the implementation of IT and FFIT on Mexican infla-tion. Moreover, by using monthly data we can know better the impact of inflation of the peso crisis happened in early 1995.
680 Carlos A. Carrasco and Jesús Ferreiro
inflation rates that have a cyclical nature related to the business cycle. Since we are using monthly date of inflation we should also use monthly data of GDP. Since these data are not available, we have substituted GDP values by one proxy that measures on a monthly basis the level of economic activity: the General Index of Economic Activity (IGAE).
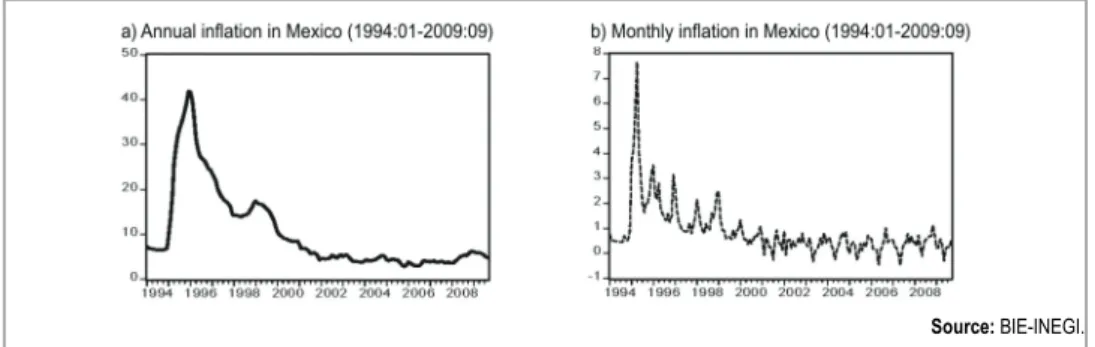
Figure 1 shows the series of annual and monthly (Figure 1a and 1b, respec-tively) inflation rates in Mexico. The highest figures are registered during the 1995 crisis. Since then, we observe a strong disinflationary process during the period 1996-2000. The figures of monthly inflation show that the instability after the crisis boils down to the end of 1998, the beginning of the transition to FFIT. Since the im-plementation of FFIT in 2001 the inflation rates stabilize around a low rate close to the target of inflation.
Source: BIE-INEGI.
Figure 1 Annual and Monthly Inflation in Mexico (1994:01-2009:09)
Figure 2a presents an upward trend of Consumer Price Index (INPC). Figure 2b shows the logarithms of the INPC, also showing an increasing trend (logarithms are used henceforth).
Source: BIE-INEGI.
Figure 2 Evolution of the Consumer Price Index
Aug-681
Inflation Targeting and Economic Performance: The Case of Mexico
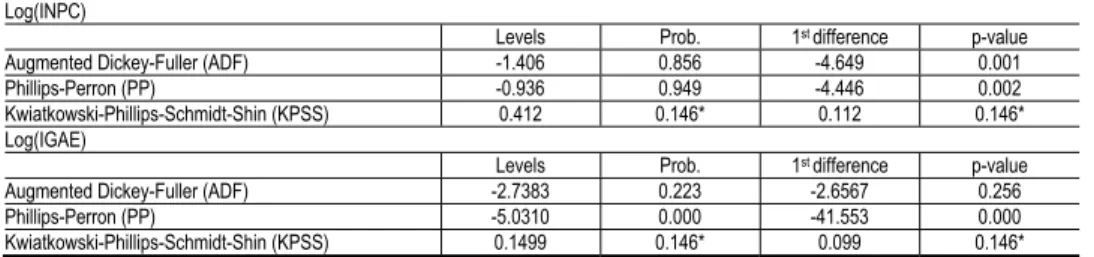
mented Dickey-Fuller (ADF), Phillips-Perron (PP) and Kwiatkowski-Phillips-Schmidt-Shin (KPSS). ADF and PP have as null hypothesis the presence of unit root while KPSS has as null hypothesis that the tested series is stationary. Results of these tests are summarized in Table 2.
Table 2 Testing Unit Root in Log(INPC) and Log(IGAE) (1993:01- 2009:09)
Log(INPC)
Levels Prob. 1st difference p-value
Augmented Dickey-Fuller (ADF) -1.406 0.856 -4.649 0.001
Phillips-Perron (PP) -0.936 0.949 -4.446 0.002
Kwiatkowski-Phillips-Schmidt-Shin (KPSS) 0.412 0.146* 0.112 0.146*
Log(IGAE)
Levels Prob. 1st difference p-value
Augmented Dickey-Fuller (ADF) -2.7383 0.223 -2.6567 0.256
Phillips-Perron (PP) -5.0310 0.000 -41.553 0.000
Kwiatkowski-Phillips-Schmidt-Shin (KPSS) 0.1499 0.146* 0.099 0.146*
Notes: * asymptotic critical values for the KPSS test at 5% level.
Source: Authors’ calculations.
For Log(INPC) the ADF and PP tests do not reject the null hypothesis of unit root at levels, and KPSS test does reject the null hypothesis of a stationary series. The tests applied to first level differences indicate the absence of unit root, that is, Log(INPC) is integrated of first order [Log(INPC)~I(1)]. In the case of Log(IGAE), the ADF and PP tests reach opposite results: ADF for levels and for first differences indicates the existence of unit root, but the PP tests show the absence of unit root. In this case, and with the aim to use IGAE as control variable, we use the KPSS tests and the correlograms to know the order of the series. According to both proofs, Log(IGAE) is integrated of order 1, that is, Log(IGAE)~I(1).
Once we know that Log(INPC)~I(1) and Log(IGAE)~I(1), it is possible to ob-serve the AC and PAC for the Log(INPC) and propose an ARIMA model: Log(INPC)~(1,1,0)(12,0,0)S with d(Log(IGAE),1) as control variable.
We estimate the parameters considering:
Log(INPC)~ARIMA(1,1,0)(12,0,0)s (1)
During the period observed, the Mexican economy experienced a strong crisis in 1995. Because of the Tequila crisis, we introduce a dummy variable (D1) to con-trol the impact of this crisis:
Otherwise D
~ 0
05 : 1995 01 : 1995 ~ 1
1 (2)
We also use two types of impulse dummies (D2 and D3), as intervention analysis, looking for the effect of the introduction of IT (D2) and FFIT (D3):
Otherwise D
~ 0
12 : 1998 ~ 1
682 Carlos A. Carrasco and Jesús Ferreiro Otherwise D ~ 0 01 : 2001 ~ 1 3 (4)
In sum, we estimate the following model:
t t s t t t s L L Z INPC Log ) 1 ( ) 1 )( 1 ( ) ( 12 2 1 1 0 (5)
Where Zt is a vector of exogenous variables including s
Log
(
IGAE
)
t1 0
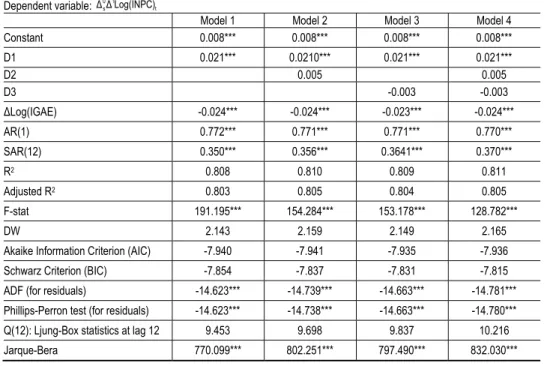
,D1, D2 and D3. Therefore, our model assumes that the Mexican inflation depends on the level of economic activity (proxied by IGAE), and that this relationship has been influenced by the shock of the Tequila crisis and by changes in the monetary policy strategy (proxied by the implementation of the IT and FFIT strategies). The results are presented in Table 3.
Table 3 Results of the Estimation (1993:01-2009:09)
Dependent variable: t
1 0
sΔLog(INPC)
Δ
Model 1 Model 2 Model 3 Model 4
Constant 0.008*** 0.008*** 0.008*** 0.008***
D1 0.021*** 0.0210*** 0.021*** 0.021***
D2 0.005 0.005
D3 -0.003 -0.003
ΔLog(IGAE) -0.024*** -0.024*** -0.023*** -0.024***
AR(1) 0.772*** 0.771*** 0.771*** 0.770***
SAR(12) 0.350*** 0.356*** 0.3641*** 0.370***
R2 0.808 0.810 0.809 0.811
Adjusted R2 0.803 0.805 0.804 0.805
F-stat 191.195*** 154.284*** 153.178*** 128.782***
DW 2.143 2.159 2.149 2.165
Akaike Information Criterion (AIC) -7.940 -7.941 -7.935 -7.936
Schwarz Criterion (BIC) -7.854 -7.837 -7.831 -7.815
ADF (for residuals) -14.623*** -14.739*** -14.663*** -14.781***
Phillips-Perron test (for residuals) -14.623*** -14.738*** -14.663*** -14.780***
Q(12): Ljung-Box statistics at lag 12 9.453 9.698 9.837 10.216
Jarque-Bera 770.099*** 802.251*** 797.490*** 832.030***
Notes: *** null hypothesis rejected at 1%; ** null hypothesis rejected at 5%; * null hypothesis rejected at 10%.
Source: Authors’ calculations.
Coefficients D1, AR (1), SAR (12) and
0s
1Log
(
IGAE
)
tautocorre-683
Inflation Targeting and Economic Performance: The Case of Mexico
lation. The residuals of all the models do not present unit root according to ADF and PP tests. The Jarque-Bera normality test rejects the null hypothesis of normality in residuals. In a recent paper, Miguel A. Díaz Carreño and Reyna Vergara González (2009) find that normality is presented in the inflation rate in the period 2000-2007: they show the presence of a normal distribution on the Mexican rate of inflation dur-ing the period 2000-07, finddur-ing that in this period inflation would converge to a rate within a range (4.1%-5.6%) higher than the inflation target set by the Banco of Mex-ico. Nonetheless, the shocks of the debt crisis, via the inflationary impact of the peso devaluation, and the adjustment policy in 1980s and the tequila crisis in 1990s affect the behavior of the trend before the referred period2.
In sum, the above analysis shows that the introduction of IT and FFIT did not significantly affected the inflation performance in Mexico. However, although we cannot argue that the introduction of IT affected inflation performance, since 2000 the inflation rates have remained at unprecedented low level below or close to the upper limit of the target range (i.e., 4%). Therefore, the above conclusion does not deny the possibility that IT has anchored the inflation expectations close to the infla-tion target.
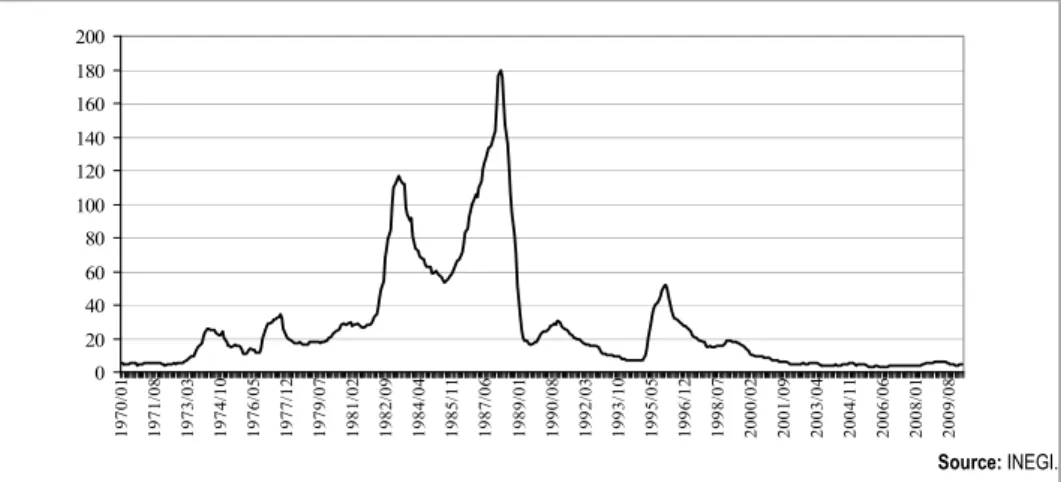
Source: INEGI.
Figure 3 Annual Rates of Inflation 1970:1-2010:3
As argued in the first section, one of the advantages of IT would be that, by anchoring inflation expectations around the inflation target, the volatility of inflation would fall. As Figure 3 shows, since 2000 Mexico has recorded an unparalleled pe-riod of low (below 10%) and stable inflation. Thus, during the pepe-riod 1970:1-1999:12 the average annual inflation rate was 35.03%, with a standard deviation of 35.38. However, in the period 2000.1-2010:3, the average annual inflation rate fell to 5.21% with a standard deviation of 1.73: inflation is not only lower but also signifi-cantly more stable than in the past.
2
Moreover, even when the JB does reject the null hypothesis of normality, according to Greta M. Ljung and George E. P. Box (1978, p. 302): “Circumstances occur where this assumption is not true (normality
in the residuals)… Results by Anderson and Walker (1964) show that the asymptotic normality of the rk’s
does not require normality of the at’s only that var(at) is finite.”
684 Carlos A. Carrasco and Jesús Ferreiro
As we have done for the level of inflation rates, in the next section we will analyze if the introduction of IT and FFIT explain the higher inflation stability regis-tered in the last decade in Mexico. This is a relevant matter, since, in many respects, the effectiveness of the IT monetary strategy should be evaluated in terms not of its ability to reduce inflation rates to low levels, but, mainly, in terms of its ability to stabilize inflation once that low inflations rates have been achieved. Actually, Mish-kin (2000) and Paul R. Masson, Miguel Savastano, and Sunil Sharma (1997) argue that in the case of emerging and developing economies with a record of high inflation rates, IT is an effective monetary strategy only when a successful disinflation has happened before the implementation of the IT. If we accept this hypothesis, IT and FFIT in Mexico should be evaluated not in terms of their capacity to reduce inflation rates but in terms of their capacity to keep and stabilize inflation performance at a low rate.
3. Has the Implementation of IT Stabilized Mexican Inflation?
In this section, the objective is to analyze whether the implementation of the inflation targeting strategy has helped to stabilize the Mexican inflation. With this aim, we will apply a number of statistical tests to the inflation performance in Mexico. We will also compare the performance of inflation in Mexico with that of the United States (USA), the Mexico’s main trading partner.
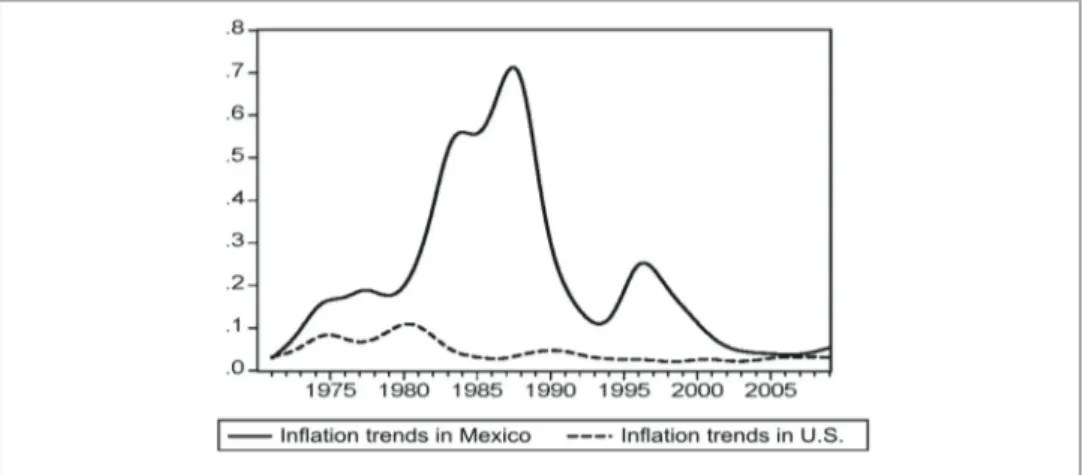
To make this analysis, we have extracted inflation trends using a Hodrick-Prescott filter. Figure 4 shows the trends in annual inflation rates in Mexico and the United States during the period 1970:01 to 2009:01. Since the early 1970s until the late nineties, the inflation trend in Mexico has been much higher than that observed in United States. However, since 2000 a clear convergence in Mexican inflation trend to that of the USA is detected.
Source: BIE-INEGI (2010); U.S. Bureau of Labor Statistics (2010).
685
Inflation Targeting and Economic Performance: The Case of Mexico
Table 4 divides the whole period analyzed into 5 sub-periods (1970:02-1980:12, 1981:01-1990:12, 1991:01-1998:12, 1999:01-2009:01, 1970:02-2009:01), and gives the mean and standard deviation of monthly inflation rates of United States and Mexico. Tests of equality of means (ANOVA F-statistic) and variances (F-test) are also used. The period 1999:01-2009:1 shows the behavior of inflation in both economies during the working of IT in Mexico.
Average inflation in Mexico is higher and statistically different in all periods. The variance is different in the periods 1970:02-1980:12, 1981:01-1990:12, 1991:01-1998:12 and in 1970:02-2009:01 (for the full sample). However, in the period under the IT strategy (1999:01-2009:01) not only the standard deviation of Mexican infla-tion is lower than in the USA, but also the F-test does not reject the null hypothesis of equal variances. Therefore, in that period the volatility of Mexican inflation during the IT period is statistically similar to that registered in the USA economy. As data show, the sizes of the standard deviation and the mean are directly related. Coeffi-cient of variation (standard deviation divided by the mean) helps to offset this bias. Since 1999 the coefficients of variation of Mexican and USA inflation are 0.830 and 2.095, respectively, thus showing a more stable behaviour of Mexican inflation (al-though at a higher level than in the USA). This outcome would support the argument that IT has helped to reduce the inflation volatility in Mexico.
Table 4 Tests of Mean and Variance Equality of the Monthly Inflation in Mexico and United States (1970:02-2009:01)
1970:02-1980:12
Mean Standard deviation
ANOVA
F- statistic Prob. F-Test Prob.
Mexico 0.013 0.010
49.418 0.000 7.031 0.000
USA 0.006 0.004
1981:01-1990:12
Mean Standard deviation
ANOVA
F- statistic Prob. F-Test Prob.
Mexico 0.042 0.026
248.902 0.000 83.227 0.000
USA 0.004 0.003
1991:01-1998:12
Mean Standard deviation
ANOVA
F- statistic Prob. F-Test Prob.
Mexico 0.015 0.012
110.561 0.000 59.692 0.000
USA 0.002 0.001
1999:01-2009:01
Mean Standard deviation
ANOVA
F- statistic Prob. F-Test Prob.
Mexico 0.005 0.004
23.650 0.000 1.280 0.178
USA 0.002 0.004
1970:02-2009:01
Mean Standard deviation
ANOVA
F- statistic Prob. F-Test Prob.
Mexico 0.018 0.021
227.567 0.000 30.666 0.000
USA 0.004 0.004
686 Carlos A. Carrasco and Jesús Ferreiro
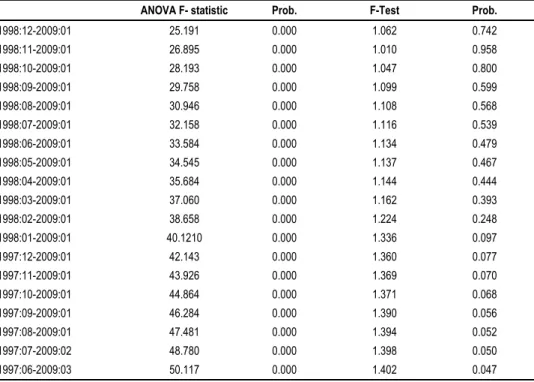
However, the more stable performance of inflation in Mexico during the IT period may be due to a previous convergence in the Mexican and USA inflation vola-tility. To find the date when the null hypotheses of equality of means and/or variance are/is not rejected, we have applied the mean and variance equality tests in an itera-tive way to the monthly inflation rates in Mexico and the USA. Table 5 shows the results. The null hypothesis of equality of means is rejected for all the periods tested but null hypothesis of equality of variance is not rejected since July 1997 onwards. This date is well before the introduction of IT in 1999. Therefore, the volatility of Mexican inflation rates fell before the IT implementation. This conclusion agrees with the papers by Angeriz and Arestis (2007a, 2007b, 2008), and McDermott and McMenamin (2008), which conclude that inflation level and volatility is reduced before IT in some assessed countries (IT Lite countries, UK, OCDE and some Latin American countries, respectively).
To summarize, our results show that the reduction both in the level and the volatility of Mexican inflation was achieved before the introduction of the inflation targeting monetary strategy. Although IT is not the main determinant of the im-provement in the inflation performance in Mexico, this does not mean that it has not had any impact on inflation. The data show the long lasting of the current phase of low and stable inflation. IT may well have contributed to lock-in these results by an-choring the expectations to this new environment of low inflation. Nonetheless, test-ing this hypothesis is beyond the scope of this paper.
Table 5 Convergence in Variability in Mexican and U.S. Inflation
ANOVA F- statistic Prob. F-Test Prob.
1998:12-2009:01 25.191 0.000 1.062 0.742
1998:11-2009:01 26.895 0.000 1.010 0.958
1998:10-2009:01 28.193 0.000 1.047 0.800
1998:09-2009:01 29.758 0.000 1.099 0.599
1998:08-2009:01 30.946 0.000 1.108 0.568
1998:07-2009:01 32.158 0.000 1.116 0.539
1998:06-2009:01 33.584 0.000 1.134 0.479
1998:05-2009:01 34.545 0.000 1.137 0.467
1998:04-2009:01 35.684 0.000 1.144 0.444
1998:03-2009:01 37.060 0.000 1.162 0.393
1998:02-2009:01 38.658 0.000 1.224 0.248
1998:01-2009:01 40.1210 0.000 1.336 0.097
1997:12-2009:01 42.143 0.000 1.360 0.077
1997:11-2009:01 43.926 0.000 1.369 0.070
1997:10-2009:01 44.864 0.000 1.371 0.068
1997:09-2009:01 46.284 0.000 1.390 0.056
1997:08-2009:01 47.481 0.000 1.394 0.052
1997:07-2009:02 48.780 0.000 1.398 0.050
1997:06-2009:03 50.117 0.000 1.402 0.047
687
Inflation Targeting and Economic Performance: The Case of Mexico
4. Has the Implementation of IT Affected the Mexican Economic
Growth?
Defenders of the IT monetary strategy argue that IT contributes to a better macro-economic performance in terms of price and output stability. By anchoring inflation expectations to the inflation target, the output stabilizes around its potential level, that is, the stability of inflation rates also leads to the stability of the output, reducing the volatility of the output gap. By itself, in this framework, inflation targeting does not affect the path of economic growth. However, if, like IT defenders argue, high and volatile inflation rates have a negative impact on output, the better inflation per-formance may have a positive impact on the economic activity, raising the rates of economic growth and reducing their volatility.
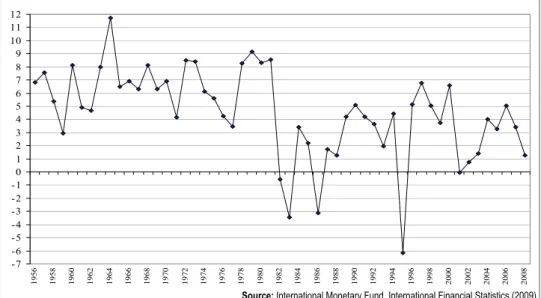
Source: International Monetary Fund, International Financial Statistics (2009).
Figure 5 Annual Rate of Growth of Mexican GDP (%)
Figure 5 shows the annual rates of economic growth in Mexico during the last six decades. The only clear conclusion we can get from the observation of these data is that since 1980 the economic growth is lower than in the sixties and the seventies, but it is difficult to say anything about the behavior in the more recent decades, and, consequently, about the impact of IT on the Mexican output.
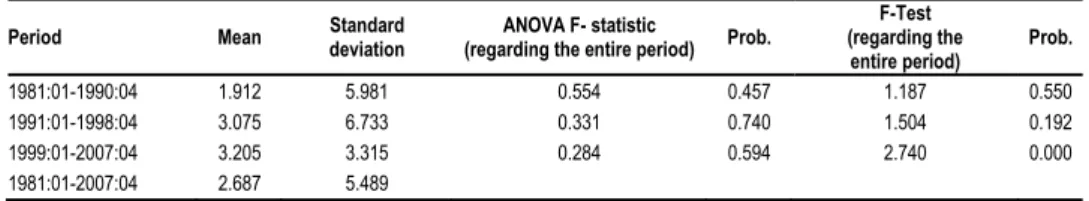
To analyze whether IT and FFIT have affected the output growth and its vola-tility we have analyzed the economic growth in Mexico in the period 1981-2007 us-ing statistical tests of equality of means and variances. We have used annualized data of quarterly GDP growth dates, splitting the whole period in 3 sub-periods, with the last sub-period (1999-2007) collecting the data corresponding to the implementation of the IT. Table 6 shows the results of this analysis.
688 Carlos A. Carrasco and Jesús Ferreiro
Table 6 Tests of Mean and Variance Equality on Mexican GDP (1981-2007)
Period Mean Standard deviation
ANOVA F- statistic
(regarding the entire period) Prob.
F-Test (regarding the entire period)
Prob.
1981:01-1990:04 1.912 5.981 0.554 0.457 1.187 0.550
1991:01-1998:04 3.075 6.733 0.331 0.740 1.504 0.192
1999:01-2007:04 3.205 3.315 0.284 0.594 2.740 0.000
1981:01-2007:04 2.687 5.489
Source: Our calculations based on Centro de Estudios de las Finanzas Públicas, Cámara de Diputados, México.
As Table 6 shows, the assumption of equal variances over the full period is not rejected during the periods 1981:01-1990:04 and 1991:01-1998:04, but it is rejected for the period 1999:01-2007:04. During the period 1999-2007 the volatility of the Mexican output was significantly lower than in the preceding years. Therefore, in this period there is a relationship between the low volatilities of output and inflation and the implementation of the IT, a conclusion in line with the postulates of this monetary strategy. In the case of the figures of the rates of economic growth, how-ever, the hypothesis of equality of means is not rejected in any sub-period, involving that the lower inflation rates and higher price stability has not significantly affected the rates of economic growth.
Therefore, the better inflation performance has not led to a better economic growth outcome. That is, IT may have contributed to stabilize inflation at low rates, but it has not led to higher economic growth. Although the object of this paper is not to explain this outcome, we want to point out that it could be related to the behavior of the Mexican peso exchange rate and its relationship with the monetary policy3. The reason is that the impact of the changes in the exchange rate of the Mexican peso on economic activity is not symmetric. Thus, when monetary policy relaxes and the Mexican interest rate fall, leading to a depreciation of the exchange rate of the peso the positive effects on economic growth are limited, smaller than those registered in other economies like Brazil (Cuevas Ahumada 2009). The reason would be that the main determinant of Mexican exports is not their price but the USA demand of Mexican exports. But when Banxico raises the interest rates the appreciation of the peso has a negative impact on Mexican net exports (Galindo and Ros 2006, 2008).
5. Summary and Conclusions
After the debt crisis in 1982, Mexico started a process of adjustments and reforms that led to implement an export-led growth strategy. A key institutional and policy element of this strategy was the reform of the Banco de Mexico that increased the autonomy of the institution, the setting of an inflation target and the freedom to choose the policy tools. After the loss of credibility due to the Tequila crisis in 1995, and following the worldwide trends in monetary policy and central banking, Banxico decided to adopt inflation targeting as its monetary strategy.
According to our findings, both the level and volatility of inflation had begun to fall before the introduction of IT and Full-Fledged Inflation Targeting. Moreover,
3
689
Inflation Targeting and Economic Performance: The Case of Mexico
since 1997, again before the implementation of IT, a convergence process of Mexi-can inflation to USA inflation is also detected. Regarding the impact of IT and FFIT on economic activity, during the targeting period there is no significant change in the rates of economic growth, although we detect a lower volatility of the economic growth; in sum, the economic growth has not been affected, although it is more sta-ble than in the past.
690 Carlos A. Carrasco and Jesús Ferreiro
References
Angeriz, Álvaro, and Philip Arestis. 2007a. “Assessing the Performance of ‘Inflation Targeting Lite’ Countries.” The World Economy, 30(11): 1621-1645.
Angeriz, Álvaro, and Philip Arestis. 2007b. “Monetary Policy in the UK.” Cambridge Journal of Economics, 31(6): 863-884.
Angeriz, Álvaro, and Philip Arestis. 2008. “Assessing Inflation Targeting Through Intervention Analysis.” Oxford Economic Papers, 60(2): 293-317.
Arestis, Philip. 2009. “The New Consensus in Macroeconomics.” In Macroeconomic Theory and Macroeconomic Pedagogy, ed. Giuseppe Fontana and Mark Setterfield, 100-117. Basingstoke: Palgrave Macmillan.
Arnone, Marco, Bernard J. Laurens, Jean-François Segalotto, and Martin Sommer.
2007. “Central Bank Autonomy: Lessons from Global Tends.” International Monetary Fund Working Paper WP/07/88.
Ball, Laurence, and Niamh Sheridan. 2005. “Does Inflation Targeting Matter?” In The Inflation-Targeting Debate, ed. Ben S. Bernanke and Michael Woodford, 249-282. Chicago: University of Chicago Press.
Barbosa-Filho, Nelson H. 2008. “Inflation Targeting in Brazil: 1999-2006.” International Review of Applied Economics, 22(2): 187-200.
Batini, Nicoletta, and Douglas Laxton. 2007. “Under What Conditions Can Inflation Targeting Be Adopted? The Experience of Emerging Markets.” In Monetary Policy under Inflation Targeting: An Introduction, ed. Frederic S. Mishkin and Klaus Schmidt-Hebbel, 467-506. Santiago: Banco Central de Chile.
Bernanke, Ben S., Thomas Laubach, Frederic Mishkin, and Adam S. Posen. 1999. Inflation Targeting. Lessons from the International Experience. Princeton: Princeton University Press.
Box, George E. P., and George C. Tiao. 1975. “Intervention Analysis with Application to Economic and Environmental Problems.” Journal of the American Statistical Association, 70(1): 70-79.
Box, George E. P., and Gwilym M. Jenkins. 1976. Time Series Analysis: Forecasting and Control. San Francisco: Holden Day.
Brito, Ricardo D., and Brianne Bystedt. 2010. “Inflation Targeting in Emerging Economies: Panel Evidence.” Journal of Development Economics, 91(2): 198-210.
Broto, Carmen. 2008. “Inflation Targeting in Latin America: Empirical Analysis Using GARCH Models.” Documentos de Trabajo Banco de España 0826.
Capistrán, Carlos, and Manuel Ramos-Francia. 2009. “Inflation Dynamics in Latin America.” Contemporary Economic Policy, 27(3): 349-362.
Capistrán, Carlos, and Manuel Ramos-Francia. 2010. “Does Inflation Targeting Affect the Dispersion of Inflation Expectations?” Journal of Money, Credit and Banking, 42(1): 113-134.
Carare, Alina, and Mark R. Stone. 2009. “Inflation Targeting Regimes.” International Monetary Fund Working Paper WP/03/9.
691
Inflation Targeting and Economic Performance: The Case of Mexico
Evaluation of its Monetary Policy Strategy, ed. Otmar Issing, 43-66. Frankfurt: European Central Bank.
Cuevas Ahumada, Victor M. 2008. “Inflación, Crecimiento y Política Macroeconómica en Brasil y México: Una Investigación Empírica.” EconoQuantum, 4(2): 35-78.
Cukierman, Alex. 2008. “Central Bank Independence and Monetary Policymaking Institutions. Past, Present and Future.” European Journal of Political Economy, 24(4): 722-736.
De Carvalho Filho, Irineu E. 2010. “Inflation Targeting at the Crisis: An Empirical Assessment.” International Monetary Fund Working Paper WP/10/45.
Díaz Carreño, Miguel A., and Reyna Vergara González. 2009. “La tasa de inflación en México, 2000-2007.” Investigación Económica, 48(269): 13-35.
Epstein, Gerald, and Enriç Yeldan. 2008. “Inflation Targeting, Employment Creation and Economic Development: Assessing the Impacts and Policy Alternatives.”
International Review of Applied Economics, 22(2): 131-144.
Frankel, Jeffrey A. 2009. “What’s In and Out in Global Money.” Finance & Development, 46(3): 13-17.
Freedman, Charles, and Douglas Laxton. 2009. “Why Inflation Targeting.” International Monetary Fund Working Paper WP/09/86.
Freedman, Charles, and Inci Ötke-Robe. 2009. “Country Experiences with the Introduction and Implementation of Inflation Targeting.” International Monetary Fund Working Paper WP/09/161.
Galindo, Luis M., and Jaime Ros. 2006. “Banco de Mexico: Política Monetaria de Metas de Inflación.” Economia UNAM, 3(9): 82-88.
Galindo, Luis M., and Jaime Ros. 2008. “Alternatives to Inflation Targeting in Mexico.” International Review of Applied Economics, 22(2): 201-214.
Ghosh, Atish R., and Jonathan D. Ostry. 2009. “Choosing an Exchange Rate Regime.” Finance & Development, 46(4): 38-40.
Gonçalves, Carlos E. S., and Joao M. Salles. 2008. “Inflation Targeting in Emerging Economies: What do the Data Say?” Journal of Development Economics, 85(1-2): 312-318.
Gürkaynak, Refet S., Andrew T. Levin, and Eric T. Swanson. 2006. “Does Inflation Targeting Anchor Long-Run Inflation Expectations? Evidence from Long-Term Bond Yields in the U.S., U.K., and Sweden.” Federal Reserve Bank of San Francisco Working Paper 2006-09.
Gürkaynak, Refet S., Andrew T. Levin, Andrew N. Marder, and Eric T. Swanson. 2007. “Inflation Targeting and the Anchoring of Inflation Expectations in the Western Hemisphere.” Federal Reserve Bank of San Francisco Economic Review 2007.
Ibarra, Carlos A. 2008. “Disinflation and Real Currency Appreciation in Chile and Mexico: The Role of Monetary Policy.” Investigación Económica, 67(266): 67-94.
International Monetary Fund - IMF. 2005. World Economic Outlook. Washington D.C.: International Monetary Fund.
Jácome, Luis I., and Francisco Vázquez. 2008. “Is There any Link Between Legal Central Bank Independence and Inflation? Evidence from Latin America and the
692 Carlos A. Carrasco and Jesús Ferreiro
Kacef, Osvaldo, and Rafael López-Monti. 2010. “Latin America, from Boom to Crisis: Macroeconomic Policy Challenges.” CEPAL Review, 100: 41-67.
King, Mervyn. 2009. Speech at the Lord Mayor’s Banquet for Bankers and Merchants of the City of London at the Mansion House.
http://www.bankofengland.co.uk/publications/speeches/2009/speech394.pdf.
Ljung, Greta M., and George E. P. Box. 1978. “On a Measure of Lack of Fit in Time Series Models.” Biometrika, 65(2): 297-303.
Loría, Eduardo. 2009. “Sobre el Lento Crecimiento Económico de México. Una Explicación Estructural.” Investigación Económica, 68(270): 37-68.
Mantey de Anguiano, Guadalupe. 2009. “Intervención Esterilizada en el Mercado de Cambios en un Régimen de Metas de Inflación: La Experiencia de México.” Investigación Económica, 68: 47-78.
Masson, Paul R., Miguel Savastano, and Sunil Sharma. 1997. “The Scope for Inflation Targeting in Developing Countries.” International Monetary Fund Working Paper WP/97/130.
McDermott, John, and Peter McMenamin. 2008. “Assessing Inflation Targeting in Latin America with a DSGE Model.” Central Bank of Chile Working Paper 469.
Mishkin, Frederic S. 2000. “Inflation Targeting in Emerging Market Economies.” American Economic Review, 90(2): 105-109.
Mishkin, Frederic S., and Klauss Schmidt-Hebbel. 2007. “Does Inflation Targeting Make a Difference.” In Monetary Policy under Inflation Targeting: An Introduction, ed. Frederic. S. Mishkin and Klauss Schmidt-Hebbel, 291-372. Santiago de Chile: Banco Central de Chile.
Roger, Scott. 2009. “Inflation Targeting at 20: Achievements and Challenges.” International Monetary Fund Working Paper WP/09/236.
Schmidt-Hebbel, Klauss, and Alejandro Werner. 2002. “Inflation Targeting in Brazil, Chile and Mexico: Performance, Credibility, and the Exchange Rate.” Central Bank of Chile Working Paper 171.
Stiglitz, Joseph E. 2008. “The Failure of Inflation Targeting.” http://www.project-syndicate.org/commentary/stiglitz99/English.
Stone, Mark R., and Ashok J. Bhundia. 2004. “A New Taxonomy of Monetary Regimes.” International Monetary Fund Working Paper WP/04/191.
Stone, Mark, Scott Roger, Seiichi Shimizu, Anna Nordstrom, Turgut Kişinbay, and Jorge Restrepo. 2009. “The Role of the Exchange Rate in Inflation-Targeting Emerging Economies.” International Monetary Fund Occasional Paper 267.