BGD
12, 8199–8234, 2015BLPs from riverine non-labile DOC
V. Kasurinen et al.
Title Page
Abstract Introduction
Conclusions References
Tables Figures
◭ ◮
◭ ◮
Back Close
Full Screen / Esc
Printer-friendly Version Interactive Discussion
Discussion
P
a
per
|
Discussion
P
a
per
|
Discussion
P
a
per
|
Discussion
P
a
per
|
Biogeosciences Discuss., 12, 8199–8234, 2015 www.biogeosciences-discuss.net/12/8199/2015/ doi:10.5194/bgd-12-8199-2015
© Author(s) 2015. CC Attribution 3.0 License.
This discussion paper is/has been under review for the journal Biogeosciences (BG). Please refer to the corresponding final paper in BG if available.
Biologically labile photoproducts from
riverine non-labile dissolved organic
carbon in the coastal waters
V. Kasurinen1,2, H. Aarnos3, and A. Vähätalo4
1
University of Helsinki, Department of Forest Sciences, P.O. Box 27, Helsinki, Finland
2
Norwegian University of Science and Technology, 7491 Trondheim, Norway
3
University of Helsinki, Department of Environmental Sciences, P.O. Box 65, 00014 Helsinki, Finland
4
University of Jyväskylä, Department of Bio and Environmental Sciences, P.O. Box 35, 40014, Jyväskylä, Finland
Received: 28 April 2015 – Accepted: 30 April 2015 – Published: 2 June 2015
Correspondence to: V. Kasurinen ([email protected])
Published by Copernicus Publications on behalf of the European Geosciences Union.
BGD
12, 8199–8234, 2015BLPs from riverine non-labile DOC
V. Kasurinen et al.
Title Page
Abstract Introduction
Conclusions References
Tables Figures
◭ ◮
◭ ◮
Back Close
Full Screen / Esc
Printer-friendly Version Interactive Discussion
Discussion
P
a
per
|
Discussion
P
a
per
|
Discussion
P
a
per
|
Discussion
P
a
per
|
Abstract
In order to assess the production of biologically labile photoproducts (BLPs) from non-labile riverine dissolved organic carbon (DOC), we collected water samples from ten major rivers, removed labile DOC and mixed the residual non-labile DOC with arti-ficial seawater for microbial and photochemical experiments. Bacteria grew on
non-5
labile DOC with a growth efficiency of 11.5 % (mean; range from 3.6 to 15.3 %). Sim-ulated solar radiation transformed a part of non-labile DOC into BLPs, which stimu-lated bacterial respiration and production, but did not change bacterial growth efficiency (BGE) compared to the non-irradiated dark controls. In the irradiated water samples, the amount of BLPs stimulating bacterial production depended on the
photochemi-10
cal bleaching of chromophoric dissolved organic matter (CDOM). The apparent quan-tum yields for BLPs supporting bacterial production ranged from 9.5 to 76 (mean 39) (µmol C mol photons−1) at 330 nm. The corresponding values for BLPs supporting bac-terial respiration ranged from 57 to 1204 (mean 320) (µmol C mol photons−1). Accord-ing to the calculations based on spectral apparent quantum yields and local solar
radi-15
ation, the annual production of BLPs ranged from 21 (St. Lawrence) to 584 (Yangtze) mmol C m−2yr−1 in the plumes of the examined rivers. Complete photobleaching of riverine CDOM in the coastal ocean was estimated to produce 10.7 Mt C BLPs yr−1 from the rivers examined in this study and globally 38 Mt yr−1 (15 % of riverine DOC flux from all rivers), which support 4.1 Mt yr−1of bacterial production and 33.9 Mt yr−1
20
bacterial respiration.
1 Introduction
Rivers transport 246 Mt C yr−1 of dissolved organic carbon to the ocean Cai (2011). A part (19±16 %) (Søndergaard and Middelboe, 1995) of this terrestrial DOC is bio-logically labile and quickly consumed by heterotrophic bacteria in the coastal waters
25
BGD
12, 8199–8234, 2015BLPs from riverine non-labile DOC
V. Kasurinen et al.
Title Page
Abstract Introduction
Conclusions References
Tables Figures
◭ ◮
◭ ◮
Back Close
Full Screen / Esc
Printer-friendly Version Interactive Discussion
Discussion
P
a
per
|
Discussion
P
a
per
|
Discussion
P
a
per
|
Discussion
P
a
per
|
(81±16 %) of terrestrial DOC (tDOC) is biologically non-labile (Søndergaard and
Mid-delboe, 1995). In the coastal waters, the primary sinks for non-labile DOC are slow microbial metabolism or photochemical transformations (Bauer et al., 2013). Photo-chemical reactions can transform non-labile tDOC to dissolved inorganic carbon (DIC) or biologically labile photoproducts (BLPs), the latter being rapidly assimilated by
mi-5
crobes (Wetzel et al., 1995). The assimilation of non-labile tDOC (directly or after pho-tochemical transformation) contributes to heterotrophy of coastal waters (Smith and Hollibaugh, 1993) and couples tDOC to marine food webs (Vähätalo and Järvinen, 2007; Vähätalo et al., 2011). The extent of this coupling depends also on the fraction of assimilated tDOC converted to bacterial biomass (i.e., bacterial growth efficiency,
10
BGE) (del Giorgio and Cole, 1998; del Giorgio and Davis, 2003).
By operational definition, BLPs are compounds produced by photochemical reac-tions and transformed into a more labile form than the original compounds in DOC. The amount of BLPs is typically quantified experimentally as bacterial respiration, bac-terial production or associated loss of DOC (=bacterial carbon demand) in irradiated
15
DOC in excess of that found in non-irradiated dark control DOC (Wetzel et al., 1995; Smith and Benner, 2005). In order to translate the experimental findings to environ-mental processes, the amounts of BLPs have been related to the number of photons absorbed by chromophoric dissolved organic matter (CDOM) yielding to an apparent quantum yield (AQY) for production of BLPs (Miller et al., 2002; Vähätalo et al., 2011;
20
Aarnos et al., 2012; Reader and Miller, 2014; Cory et al., 2014).
The production of BLPs is also linearly related to the photochemical loss of CDOM (photobleaching) (Kieber et al., 1990; Miller and Moran, 1997; Bertilsson and Tranvik, 2000; Obernosterer and Herndl, 2000; Brinkmann et al., 2003). Although, this quanti-tative relationship between the production of BLPs and photobleaching could be also
25
used to estimate the photoproduction of BLPs in the surface waters, it has to our knowl-edge never been used for such a purpose. Bacterial production on BLPs can support both heterotrophic food webs and primary production in the coastal waters (Vähätalo and Järvinen, 2007; Vähätalo et al., 2011). The bacterial production on BLPs depends
BGD
12, 8199–8234, 2015BLPs from riverine non-labile DOC
V. Kasurinen et al.
Title Page
Abstract Introduction
Conclusions References
Tables Figures
◭ ◮
◭ ◮
Back Close
Full Screen / Esc
Printer-friendly Version Interactive Discussion
Discussion
P
a
per
|
Discussion
P
a
per
|
Discussion
P
a
per
|
Discussion
P
a
per
|
in part on BGE on BLPs. Irradiation of DOC can decrease (15 studies) or increase BGE (5 studies) compared to non-irradiated DOC (reviewed by Abboudi et al. (2008)). Despite of these comparisons, between irradiated and non-irradiated DOC, the BGE on BLPs has not been determined and our study provides the first BGE estimate on BLPs.
5
This study estimates the production of BLPs from non-labile tDOC in the coastal waters and determines BGE on BLPs. We collected water samples from ten large rivers that produce together 28 % of tDOC flux to the ocean and aged the samples with indigenous microbes for the removal of labile DOC. The remaining non-labile DOC was mixed (1 : 1) with artificial seawater to simulate chemical matrix of coastal ocean. The
10
sterile filtered mixtures of non-labile DOC and seawater were irradiated with simulated solar radiation. The irradiated waters received indigenous bacteria and the amount of BLPs was measured separately as bacterial production (BP on BLPs) and respiration (BR on BLPs) in excess of that found in the non-irradiated dark control waters.The BP or BR on BLPs was related to the number of absorbed photons for the calculation of
15
AQY and also to the photobleaching (BLPs vs. photobleaching approach). The annual production of BP on BLPs and BR on BLPs (mol C m−2yr−1) in the river plumes was calculated from AQYs and the annual solar radiation in the coastal ocean in the front of each river. We calculated the annual production of BLPs from the annual CDOM fluxes for each river (Mt C yr−1 per river) using the BLPs vs. photobleaching approach
20
BGD
12, 8199–8234, 2015BLPs from riverine non-labile DOC
V. Kasurinen et al.
Title Page
Abstract Introduction
Conclusions References
Tables Figures
◭ ◮
◭ ◮
Back Close
Full Screen / Esc
Printer-friendly Version Interactive Discussion
Discussion
P
a
per
|
Discussion
P
a
per
|
Discussion
P
a
per
|
Discussion
P
a
per
|
2 Material and methods
2.1 Material
The rivers selected for this study (Table 1) drain 25 % of the land area, contribute 28 % to the global tDOC flux, and 33 % to the freshwater discharge to the ocean (Carl-son, 2002; Cauwet, 2002; Coynel et al., 2005; Milliman and Farnsworth, 2011). For
5
the collection of water samples, empty polyethylene containers (cleaned with deter-gent, rinsed with HCl and finally copiously rinsed with ion exchanged water; MQ) were shipped to the local collaborators at ten major rivers (see acknowledgments). The con-tainers were filled in the center of the stream by direct immersion below the surface, except for the Mississippi and St. Lawrence Rivers where water about 3 m below the
10
surface was collected with Niskin bottles. The samples collected for this study has been used earlier for the determination of dissolved black carbon (Jaffé et al., 2013), dissolved iron (Xiao et al., 2013) and the photochemical isotopic fractionation of DOC (Lalonde et al., 2014).
Artificial seawater was prepared according to Kester et al. (1967) by dissolving pro
15
analysis grade of inorganic salts (VWR International) to MQ water. Prior to use, glass-ware and quartzglass-ware were washed in a dishwasher, rinsed out with 7 % HCl and MQ water, and combusted for several hours (450◦C).
2.2 Experimental
2.2.1 Sample preparation 20
In order to remove labile DOC, the collected water samples were not filtered or pre-served, but kept in darkness and sent to our laboratory in Helsinki, Finland by air cargo. The median transport time between the sampling and the arrival to Helsinki was 33 days (Table 1). Upon arrival to the laboratory, the water samples were filtered through 1 µm filters (quick rinsed membrane cartridge, Nuclepore or double layer of
25
BGD
12, 8199–8234, 2015BLPs from riverine non-labile DOC
V. Kasurinen et al.
Title Page
Abstract Introduction
Conclusions References
Tables Figures
◭ ◮
◭ ◮
Back Close
Full Screen / Esc
Printer-friendly Version Interactive Discussion
Discussion
P
a
per
|
Discussion
P
a
per
|
Discussion
P
a
per
|
Discussion
P
a
per
|
track-etch polyester membrane filter cartridge, Graver Technologies) and stored in the dark at+4◦C. We assume that the microbes present in the water samples consumed the labile DOC during the transportation, which allowed us to carry out the experimen-tal work with non-labile DOC. The amount of labile DOC from the St. Lawrence river sample was 19±1 % (n=3) in the St. Lawrence River sample (Lalonde et al., 2014), 5
which is in agreement with the proportion of labile riverine DOC being 19±16 % (Søn-dergaard and Middelboe, 1995; Lønborg and Álvarez Salgado, 2012; Asmala et al., 2014).
Our salinity adjustment followed by filtration mimics a potential removal of iron via flocculation and related loss in photochemical reactivity and is expected to result a
ma-10
trix characteristic for photochemical transformation of non-labile tDOC in the coastal waters 2.2.1. In order to assess BGEs and the production of BLPs from non-labile tDOC under conditions representing coastal waters, the 1 µm-filtered river water sam-ples were mixed 1 : 1 with artificial seawater. In the mixtures, the ionic composition was similar to that of seawater but the salinity (16) was half of that found in the ocean. For
15
abiotic photochemical experiments, the 1 µm filtered river water samples mixed with ar-tificial seawater were further aseptically filtered through 0.2 µm membrane filters (Palls Supor 200) into 170 mL glass or quartz flasks to be closed with ground-glass stoppers without headspace.
2.2.2 Irradiations 20
The quartz flasks were irradiated for 44 to 46 h with 765 W m−2 simulated solar radia-tion (Atlas Suntest CPS+solar simulator) in a MQ-water bath regulated to 20◦
C with a Lauda RE-112 thermostat like in our earlier study (Aarnos et al., 2012). The glass flasks wrapped into aluminum foil were kept in the same water bath (dark controls) or at 4◦
C (initials).
BGD
12, 8199–8234, 2015BLPs from riverine non-labile DOC
V. Kasurinen et al.
Title Page
Abstract Introduction
Conclusions References
Tables Figures
◭ ◮
◭ ◮
Back Close
Full Screen / Esc
Printer-friendly Version Interactive Discussion
Discussion
P
a
per
|
Discussion
P
a
per
|
Discussion
P
a
per
|
Discussion
P
a
per
|
2.2.3 Bioassays
For the bioassays, the irradiated and the dark control samples from each river re-ceived a 10 % (vol/vol) inoculum of bacterioplankton prepared from their correspond-ing river by passcorrespond-ing the 1 µm-filtered river water through GF/F filters (nominal pore size of 0.7 µm, Whatman) for the removal of the grazers of bacterioplankton. The bioassay
5
samples received NH4Cl and KH2PO4to the final concentrations of 1.2 mg N L−1 and 0.13 mg P L−1, respectively, and were divided into two aliquots for the determination of bacterial respiration (BR) or bacterial production (BP).
2.2.4 Bacterial respiration
BR was determined as a consumption of dissolved oxygen (O2) measured with
needle-10
type oxygen microsensor optodes (PreSens GmbH, Regenburg, NTH-PSt1-L5-TF-NS40) (Warkentin et al., 2007, 2011) at 15 min intervals from aliquots closed in bio-logical oxygen demand bottles incubated in darkness in a water bath at 20◦C (Lauda RE-112 thermostat). An optode was inserted into the sample via a hole drilled through the ground-glass stopper and sealed with parafilm. The drift of instrument defining
15
the detection limit for BR was measured in three blank experiments, where MQ water was incubated for 300 h under conditions identical to respiration measurements. Dur-ing the blank experiments, the apparent decline of O2 was 1.5±0.5 µmol L−1300 h−1
(mean±sd, n=3). The decline in the concentration of O2 was converted into an in-crease in the concentration of CO2 assuming 1 : 1 molar ratio between the consumed
20
O2 and the produced CO2 in BR. The selected respiratory quotient makes our study comparable to earlier studies, which have used values ranging from 0.82 to 1.2 (Søn-dergaard and Middelboe, 1995; del Giorgio et al., 1997; del Giorgio and Cole, 1998; Cory et al., 2014). The temporal trend of accumulated CO2was determined by a poly-nomial fitting to the measurements with the smooth spline function in R software (R
25
Core Team, 2014).
BGD
12, 8199–8234, 2015BLPs from riverine non-labile DOC
V. Kasurinen et al.
Title Page
Abstract Introduction
Conclusions References
Tables Figures
◭ ◮
◭ ◮
Back Close
Full Screen / Esc
Printer-friendly Version Interactive Discussion
Discussion
P
a
per
|
Discussion
P
a
per
|
Discussion
P
a
per
|
Discussion
P
a
per
|
2.2.5 Bacterial production
To determine bacterial production (BP), 10 mL samples were preserved with formalde-hyde (final concentration 5 %) daily from aliquots incubated in dark conditions at room temperature (mean 22◦C, range from 20 to 24◦C) with an air-head space. The bacte-rial cells from the preserved samples were filtered on 0.2 µm polycarbonate filters (GE
5
water & Process Technologies) and stained with acridine orange (Hobbie et al., 1977). Bacterial densities were estimated from cell counts from ≥ 20 fields with an
epifluo-rescence microscope (Aristoplan). The cell volumes were determined by digital image analysis (Image Analysis & LabMicrobe software; Massana et al.1997). The volumes of cells were converted to carbon using a conversion factor of 0.12 pg C (µm3)0.7 and
10
the total carbon-biomass of bacterioplankton assemblage was calculated by multiplying the organic carbon content of cells with the density of cells (Norland, 1993).
2.2.6 Defining BLPs and BGEs
For the bacteria growing in the irradiated sample, the response to BLPs was consid-ered to be largest in the end of logarithmic growth phase defined as the first day with
15
maximum biomass during the 12 day-long bioassay (Stepanauskas et al., 2002). On that day (varying from 5 to 12 days), the difference in the accumulated BP or BR be-tween the dark control and the irradiated samples represented the BP or BR on BLPs. The bacterial growth efficiency (BGE) was calculated as BP/(BP+BR).
2.3 Analytical measurements 20
The absorbance by CDOM was measured with a spectrophotometer (Shimadzu UV 2550) in triplicates against MQ water reference using a 0.05 m quartz cuvette. The ab-sorbance by CDOM was converted into an absorption coefficient (aCDOM,λ) accounting for the path length of the cuvette and transforming the 10-base logarithm to a Naperian-based logarithm (ln(10)).
BGD
12, 8199–8234, 2015BLPs from riverine non-labile DOC
V. Kasurinen et al.
Title Page
Abstract Introduction
Conclusions References
Tables Figures
◭ ◮
◭ ◮
Back Close
Full Screen / Esc
Printer-friendly Version Interactive Discussion
Discussion
P
a
per
|
Discussion
P
a
per
|
Discussion
P
a
per
|
Discussion
P
a
per
|
2.4 The apparent quantum yields for the production of BLPs
Spectral apparent quantum yields (AQYs) for the production of BLPs supporting bacte-rial production (BP) or bactebacte-rial respiration (BR) (AQYBP,λor AQYBP,λ) were calculated as:
AQYBP,λor AQYBR,λ= BP or BR
photons absorbed by CDOM(λ) (1)
5
where BP or BR on BLPs are the bacterial production or respiration based on BLPs (mol C) and photons absorbed represents the spectrally resolved absorption of photons by CDOM during the irradiation experiment (mol photons at the spectral range from 290 to 750 nm) andλspecific wavelength. The latter was calculated by accounting for the spectral dose of photons, the optical path length, and the absorption characteristics of
10
samples as explained in our earlier study (Aarnos et al., 2012). AQYBP,λ and AQYBR,λ were assumed to depend on wavelength according to:
AQYλ=cd−d λ
(2)
where AQYλ is AQYBP,λor AQYBR,λ,c(mol C mol photons−1) andd (nm−1) are positive constants, and λ is the wavelength (nm). The parameters c and d in Eq. (2) were
15
iterated from Eq. (1) by unconstrained nonlinear optimization (the “fminsearch” function of the Matlab 7.9.0) as in our earlier publications (Vähätalo et al., 2011; Aarnos et al., 2012).
2.5 The production of BLPs based on AQYs
The measured AQYBP,λ or AQYBR,λ was used to calculate the production rate of BLPs
20
in the river plumes according to:
pr =
λZmax
λmin
AQYλQλ(aCDOM,λa
−1
tot,λ)dλ (3)
BGD
12, 8199–8234, 2015BLPs from riverine non-labile DOC
V. Kasurinen et al.
Title Page
Abstract Introduction
Conclusions References
Tables Figures
◭ ◮
◭ ◮
Back Close
Full Screen / Esc
Printer-friendly Version Interactive Discussion
Discussion
P
a
per
|
Discussion
P
a
per
|
Discussion
P
a
per
|
Discussion
P
a
per
|
where pr is the production rate of BLPs supporting BP or BR over the entire water column (mol C m−2yr−1), AQYλ is AQYBP,λ or AQYBR,λ, Qλ represents the spectrum of solar radiation absorbed by the entire water column (mol photons m−2yr−1nm−1), and the ratioaCDOM,λa−1
tot,λ (dimensionless) is the contribution of tDOC to the total
absorp-tion coefficientatot,λ (m−1nm−1) (Aarnos et al., 2012). The integration was done from 5
λmin of 290 nm toλmaxof 750 nm.Qλ was calculated as the product of a standard solar radiation spectrum (ASTM G173-03; Chu and Liu, 2009) normalized with global radia-tion and the annual mean global radiaradia-tion determined for the area of each river plume examined. The latter was calculated from monthly values over the years 1984 to 2000 (Hatzianastassiou et al., 2005). Terrestrial CDOM was assumed to absorb all
pho-10
tolytic photons (aCDOM,λa
−1
tot,λ=1; Eq. 3). Therefore the calculated rates apply for those
coastal regions, where tCDOM from rivers dominates the absorption of photolytic solar radiation (e.g. river plumes).
2.6 The production of BLPs based on photobleaching
The annual production of BLPs from tCDOM in the coastal ocean was estimated from
15
the measured relationship between BLPs and photobleaching. The latter was assumed to be the only sink for tCDOM discharged by rivers to coastal ocean (Nelson and Siegel, 2013). In this case, the amount of photobleached tCDOM equals the CDOM flux by the rivers. The annual CDOM fluxes for Lena, Mississippi and St. Lawrence rivers were taken from the literature (Stedmon et al., 2011; Spencer et al., 2013) and
20
converted to aCDOM,300 flux with spectral slope coefficients (Stedmon et al. (2011); 17.6 and 16.3 µm−1) measured for Mississippi and St. Lawrence CDOM, respectively. In the absence of published fluxes for the remaining rivers, the annual CDOM fluxes were estimated by multiplying the measuredaCDOM,300with the annual water discharge (Cauwet, 2002; Coynel et al., 2005). The production of BLPs supporting BP by each
25
BGD
12, 8199–8234, 2015BLPs from riverine non-labile DOC
V. Kasurinen et al.
Title Page
Abstract Introduction
Conclusions References
Tables Figures
◭ ◮
◭ ◮
Back Close
Full Screen / Esc
Printer-friendly Version Interactive Discussion
Discussion
P
a
per
|
Discussion
P
a
per
|
Discussion
P
a
per
|
Discussion
P
a
per
|
CDOM at 300 nm. The BR on BLPs was calculated from the mean BGE on BLPs (BR=BP/BGE−BP). Finally, the total production of BLPs (mol C yr−1) was obtained
as a sum of BR and BP on BLPs.
2.7 Statistical analysis
Statistical differences between the samples were tested with two-tailed paired t tests
5
(heteroscedastic) by comparing observed response between the irradiated and the dark control samples. All statistical analyses were carried out by using R language and a significance level of 0.05 (R Core Team, 2014). We used linear regression to evaluate the dependency between photobleaching and and BP or BLPs.
3 Results 10
3.1 Photobleaching of riverine CDOM in a seawater matrix
When 0.2 µm filtered river waters without labile DOC (Table 1) were mixed with arti-ficial seawater and irradiated, the simulated solar radiation photobleached CDOM at 300 nm (aCDOM,300) by 50.4±2.6 % (mean±sd here and elsewhere in the results;
Ta-ble 2). The amount of photoTa-bleaching expressed as absorption coefficient ranged from
15
0.48±0.06 m−1(Ganges–Brahmaputra) to 12.42±0.06 m−1(Congo) when calculated
as the difference in aCDOM,300 between the dark control and the irradiated samples (∆aCDOM,300, Table 2).
3.2 Bacterial production
In order to assess bacterial production (BP) on the irradiated and the dark control
non-20
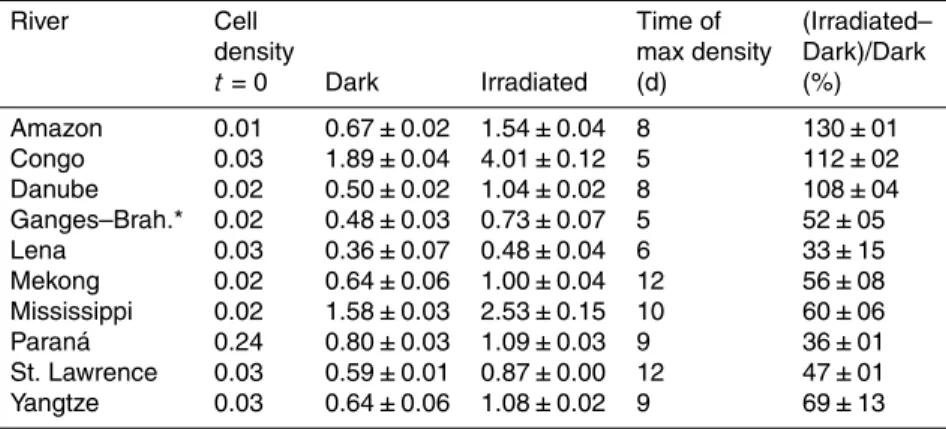
labile DOC, we introduced an inoculum of riverine bacterioplankton to the irradiated and the dark control samples resulting in the bacterial cell densities from 0.006 to 0.240×10⁹cells L−1(t=0 in Table 3). The bacteria increased their densities by one to
BGD
12, 8199–8234, 2015BLPs from riverine non-labile DOC
V. Kasurinen et al.
Title Page
Abstract Introduction
Conclusions References
Tables Figures
◭ ◮
◭ ◮
Back Close
Full Screen / Esc
Printer-friendly Version Interactive Discussion
Discussion
P
a
per
|
Discussion
P
a
per
|
Discussion
P
a
per
|
Discussion
P
a
per
|
two orders of magnitude in five to 12 days (Table 3) in the irradiated samples and 33 to 152 % higher more than in the dark control samples (Table 3).
The bacterial cell densities were converted to biomasses by accounting for the bac-terial cell volumes, which were not different between the dark control and the irradi-ated samples (pairedttest, df=9,p >0.05). In the dark controls, the accumulated BP
5
ranged from 0.5±0.1 (Lena) to 3.9±0.2 (Congo) µmol C L−1 (Fig. 1). BP was higher in the irradiated than in the dark control samples (pairedt test, df=9,p=0.003) and ranged from 1.2±0.1 (Lena) to 8.7±0.6 (Congo) µmol C L−1(Fig. 1). BP on BLPs,
cal-culated as the difference between the irradiated and the dark control samples, ranged from 0.6±0.3 (Ganges–Brahmaputra) to 4.8±0.8 (Congo) µmol C L−1(Fig. 1). The BP 10
on BLPs was significantly related to the photobleaching by a linear regression coeffi -cient of 0.336 mmol C L m−2(Fig. 2).
3.3 Bacterial respiration
In the dark controls, bacterial respiration (BR) accumulated usually linearly with time indicating relatively constant rates of respiration throughout the bioassay (Fig. 3). In
15
the irradiated samples, the kinetics of BR was different and rates typically higher than in the dark control samples (Fig. 3). The BR on BLPs (Fig. 4) was calculated from the difference in respiration between the irradiated and dark control samples (Fig. 3). After a lag-phase, BR on BLPs typically accumulated rapidly, but leveled offat the late phase of bioassay (Fig. 4). The BR on BLPs accumulated by the time of maximum
20
biomass was undetectable (−1.4±1.39 µmol C L−1) with Ganges–Brahmaputra BLPs
and highest (27.8±1.33 µmol C L−1) with Yangtze BLPs (Fig. 4).
3.4 Bacterial growth efficiency
When BGE was calculated from the biomass (Fig. 1) and the respiration gained by the time of maximum biomass (Figs. 3 and 4), it was lowest 3.0 % and highest 27.7 % in
25
BGD
12, 8199–8234, 2015BLPs from riverine non-labile DOC
V. Kasurinen et al.
Title Page
Abstract Introduction
Conclusions References
Tables Figures
◭ ◮
◭ ◮
Back Close
Full Screen / Esc
Printer-friendly Version Interactive Discussion
Discussion
P
a
per
|
Discussion
P
a
per
|
Discussion
P
a
per
|
Discussion
P
a
per
|
dark controls BGE ranged from 3.6 % (Yangtze) to 15.3 % (Amazon) (Table 4). BGE on BLPs ranged from 2.8 % (Yangtze) to 21.5 % (Amazon) (Table 4). The mean BGEs were not different among the irradiated DOC, the dark control DOC or BLPs (paired
ttest, df=7,p >0.05) (Table 4).
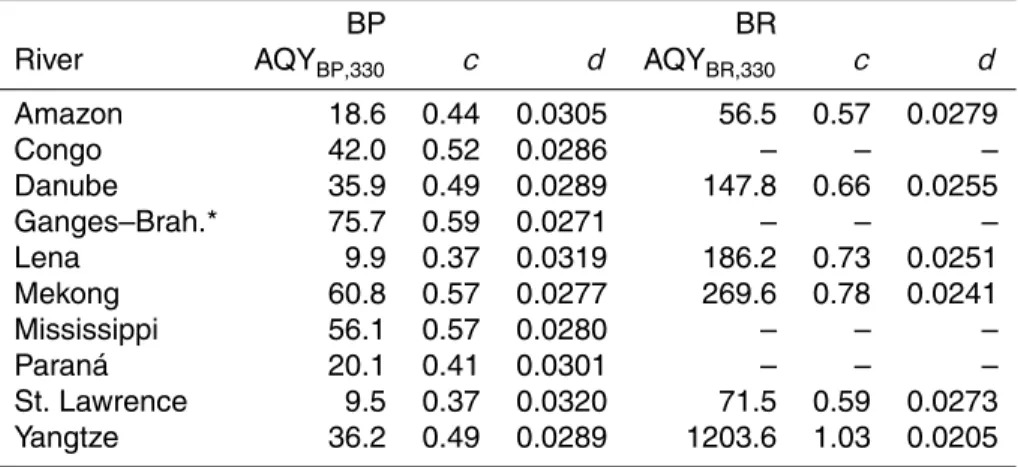
3.5 Apparent quantum yields and production rates of BLPs 5
When the BP on BLPs (Fig. 1) was divided by the spectrum of photons absorbed during the irradiation, the spectral AQY for the production of BLPs supporting BP (AQYBP,λ; Eq. 2) was defined by the parameterscanddshown in Table 5. Based on these param-eters, the calculated AQYBPranged from 9.5 to 76 with median of µmol C mol photons−1 at 330 nm, a wavelength of solar radiation responsible for highest production of BLPs
10
(Table 5) (Miller et al., 2002; Vähätalo et al., 2011; Aarnos et al., 2012). The corre-sponding values for the production of BLPs supporting BR (AQYBR,330) ranged from 57 to 1203 with median of 186 µmol C mol photons−1(Table 5).
In the river plumes, the annual production of BLPs supporting BP ranged from 1.0 (Lena) to 33 mmol C m2yr−1(Ganges–Brahmaputra) (Table 6) when calculated (Eq. 3)
15
with AQYBP,λ (Table 5) and the local annual mean solar irradiance in the coastal ocean at the front of each river. The corresponding production of BLPs supporting BR ranged from 19 (St. Lawrence) to 574 mmol C m−2yr−1 (Yangtze) (Table 6). The total produc-tion of BLPs ranged from 21 (St Lawrence) to 584 mmol C m−2yr−1 (Yangtze) when calculated as the sum of BLPs supporting BP and BR (Table 6).
20
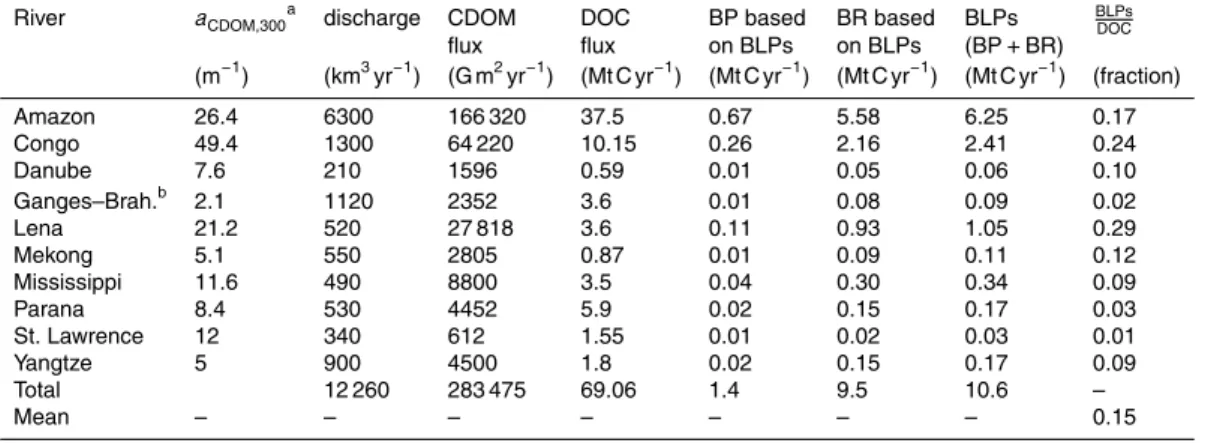
3.5.1 An estimate for the global production of BLPs
The relationship between BP on BLPs and∆aCDOM,300 (Fig. 2) was multiplied with the annual CDOM fluxes (Table 7) to estimate the photobleaching of CDOM and related production of BLPs from non-labile tDOC of each river in the coastal ocean. The pho-tobleaching of CDOM fluxes was calculated to promote altogether 1.1±0.3 Mt C yr−1 25
BP on BLPs (mean±95 % confidence interval; Table 7). The corresponding amount of
BGD
12, 8199–8234, 2015BLPs from riverine non-labile DOC
V. Kasurinen et al.
Title Page
Abstract Introduction
Conclusions References
Tables Figures
◭ ◮
◭ ◮
Back Close
Full Screen / Esc
Printer-friendly Version Interactive Discussion
Discussion
P
a
per
|
Discussion
P
a
per
|
Discussion
P
a
per
|
Discussion
P
a
per
|
BR on BLPs was calculated to be 9.5±4.8 Mt C yr−1 when accounting for the 12.0 %
BGE on BLPs (Table 7). The sum of BP and BR on BLPs was 10.7±4.5 Mt C yr−1
representing the total production of BLPs (Table 7). This total production of BLPs cor-responds to 15±6.8 % of the total DOC flux (69 Mt C yr−1) of examined rivers (Table 7).
Assuming that the rivers examined responsible for 28 % of global DOC flux are
repre-5
sentative for the remaining 72 % DOC flux to ocean, the estimate for the global coastal production of BLPs from tDOC is 38.0±15.9 Mt C yr−1 supporting 4.1±1.1 Mt C yr−1
BP and 33.9±16.9 Mt C yr−1BR.
4 Discussion
4.1 Global fluxes of BLPs from terrestrial DOC 10
Our study provides the first estimate for the production of BLPs from tDOC in the coastal waters in the front of ten major rivers across five continents. The BLPs from tDOC (38.0±15.9 Mt C yr−1; this study) contribute little to the production of BLPs in
global coastal water estimated earlier (206 Mt C yr−1) (Miller et al., 2002). That esti-mate is nearly as large as global riverine DOC flux to the ocean (246 Mt C yr−1) (Cai, 15
2011). There much of the earlier estimate must be based on the autochthonous pro-duction in marine waters and tells little about the coupling of tDOC to marine waters trough the microbial loop.
The annual production of BLPs from tDOC in coastal waters (38.0±15.9 Mt C yr−1)
estimated in this study is larger than the global photochemical production of dissolved
20
inorganic carbon (DIC) in inland waters (Koehler et al., 2014). This comparison indi-cates that although solar radiation transforms a remarkable amount of DOC in lakes and rivers, the majority of photochemical processing of terrestrial and freshwater DOC takes place in coastal waters.
According to the present study, the BGE on BLPs is 12 % and thus the majority of
as-25
BGD
12, 8199–8234, 2015BLPs from riverine non-labile DOC
V. Kasurinen et al.
Title Page
Abstract Introduction
Conclusions References
Tables Figures
◭ ◮
◭ ◮
Back Close
Full Screen / Esc
Printer-friendly Version Interactive Discussion
Discussion
P
a
per
|
Discussion
P
a
per
|
Discussion
P
a
per
|
Discussion
P
a
per
|
coastal waters. This amount provides an additional source of DIC to coastal ocean in addition to the riverine flux of DIC (407 Mt C yr−1; Cai, 2011). This study estimates that BLPs from tDOC support 4.1±1.1 Mt C yr−1of BP in the global coastal waters. This BP is not alone a source of carbon to food webs, but is associated with N and P bound in bacterial biomass (Smith and Benner, 2005; Vähätalo et al., 2011). Assuming
stoi-5
chiometric amounts of N and P associated to bacterial biomass (mass C : N : P ratio of 17 : 4 : 1) (Goldman et al., 1987), the assimilation of BLPs from terrestrial tDOC trans-fers 4.5 Mt C yr−1, 1.06 Mt N yr−1and 0.26 Mt P yr−1to the coastal food webs through the grazers of bacterioplankton.
4.1.1 BLPs, photobleaching and CDOM fluxes 10
In this study, the production of BLPs is related to the photobleaching of CDOM with aR2 0.88 (Fig. 2). Similar relationships has been found also in earlier studies (Miller and Moran, 1997; Obernosterer and Herndl, 2000; Brinkmann et al., 2003). For ex-ample,∆aCDOM,300explains extremely well (R2>96 %) of the photoproduction of three individual BLP-compounds: formaldehyde, acetaldehyde and glyoxylate (Kieber et al.,
15
1990). The corresponding R2 is lower (0.67) for the relationship between a group of BPLs (carboxylic acids) and∆aCDOM,365 determined for 38 Swedish lakes (Bertilsson and Tranvik, 2000). OurR2-value (Fig. 2) is higher than the corresponding one for 38 lake water samples (Bertilsson and Tranvik, 2000). This is at first glance surprising since our DOC was collected from ten global rivers covering a wide climatic range and
20
land use not limited for a small region (Sweden) as in an earlier study (Bertilsson and Tranvik, 2000). The relatively high R2-values in this study may be explained in part by the same chemical matrix (artificial coastal water) used in our experiments. Addi-tionally, the rivers examined here integrate the variability of DOM across their large catchments. For example, one third of 7838 different chemical compounds assigned
25
by ultrahigh-resolution mass spectral analysis to the water samples examined in this study were shared among all river samples (Wagner et al., 2015). A conclusion from
BGD
12, 8199–8234, 2015BLPs from riverine non-labile DOC
V. Kasurinen et al.
Title Page
Abstract Introduction
Conclusions References
Tables Figures
◭ ◮
◭ ◮
Back Close
Full Screen / Esc
Printer-friendly Version Interactive Discussion
Discussion
P
a
per
|
Discussion
P
a
per
|
Discussion
P
a
per
|
Discussion
P
a
per
|
this and many other studies (Kieber et al., 1990; Miller and Moran, 1997; Bertilsson and Tranvik, 2000; Obernosterer and Herndl, 2000; Brinkmann et al., 2003) is that the production of BLPs is quantitatively linked the photobleaching of CDOM, which makes it as a useful proxy for the production of BLPs.
Our estimate for the global production of BLPs from terrestrial DOM bases on an
as-5
sumption that the riverine CDOM flux will be photobleached completely in the coastal ocean. We used published CDOM fluxes for Mississippi, St. Lawrence and Lena Rivers (Stedmon et al., 2011; Spencer et al., 2013), but for the remaining rivers the CDOM flux was estimated simply by multiplying the measured CDOM with the published water discharge (Table 7). This method provides only rough estimates for CDOM fluxes and
10
causes uncertainty also for our global estimates of BLPs. Therefore an additional data on riverine CDOM fluxes in the future will improve our estimate for CDOM fluxes and related production of BLPs. The majority of global riverine CDOM flux enters to the mix-ing layer of coastal waters, where solar radiation photobleaches CDOM efficiently and leaves not traces of terrestrial CDOM to be found in the surface of open ocean (review
15
by Nelson and Siegel (2013) and references therein). Our assumption for complete photobleaching may not hold entirely for the rivers (such as Lena in this study) dis-charging to Arctic Ocean, which transfers 78 200 Gm2yr−1 of riverine CDOM to North
Atlantic (calculated for 300 nm from the slope and flux estimated by Granskog et al., 2012). A part of this CDOM flux is directed to the deep ocean without photobleaching
20
as a part of deep water formation in the North Atlantic (Nelson and Siegel, 2013). Thus our assumption for complete photobleaching is relatively well but not entirely supported by our current estimate for photobleaching being the major sink for riverine CDOM in the coastal ocean.
4.1.2 AQYs for BLPs 25
BGD
12, 8199–8234, 2015BLPs from riverine non-labile DOC
V. Kasurinen et al.
Title Page
Abstract Introduction
Conclusions References
Tables Figures
◭ ◮
◭ ◮
Back Close
Full Screen / Esc
Printer-friendly Version Interactive Discussion
Discussion
P
a
per
|
Discussion
P
a
per
|
Discussion
P
a
per
|
Discussion
P
a
per
|
AQYBR,330s (57 to 1204 (µmol C mol photons−1) are generally lower than the previously reported 1391 (µmol C mol photons−1) for river water and 1090 (µmol C mol photons−1) for water draining a salt marsh (Miller et al., 2002), but similar to those for rivers and lakes in Alaska (Cory et al., 2014). In the earlier studies, the AQYBPs reported by Aarnos et al. (2012) are lower than AQYBRs reported by Miller et al. (2002) and Cory
5
et al. (2014). To the best of our knowledge, our study presents the first simultaneous determinations of AQYBPand AQYBRand shows that AQYs for bacterial respiration are larger than for bacterial production.
In this study, BLPs were consumed by riverine bacteria, which survived at the coastal salinities, increased their biomass by one to two orders of magnitude and reached a
de-10
tectable peak in biomass within<12 days. The bacterial inoculum used by Miller et al. (2002) was thousand-times larger and the time of bioassay longer than in the present study. The bacteria used by Miller et al. (2002) were able to assimilate more BPLs re-sulting in higher AQYs than in our study. Although our bioassays for the determination of BPLs lasted up to 12 days, the initial cell densities of inoculum were low and reached
15
typical densities found in surface water not until the end of bioassay (Table 3). The BLPs determined in this study likely represent the most bioavailable fraction of BLPs (Kieber and Mopper, 1987). The number of known chemically distinct BLP-compounds was 14 in an early review (Moran and Zepp, 1997), but had increased to 44 in a later review (Vähätalo, 2009). A more recent study using a high resolution of mass spectrometry
20
identified 1835 chemical formulae that were produced by solar radiation-induced photo-chemical reactions (Rossel et al., 2013).From these formulae 44 % were not observed in a treatment with high microbial activity indicating that the number of BLP-compounds was 807 and that BLPs represent a diverse group of compounds (Rossel et al., 2013). Although, by a definition BLPs are biologically more labile than the original DOC, the
25
biodegradability of individual BLP-compounds likely varies and may form a continuum like with the bulk DOM (Moran and Zepp, 1997; Vähätalo, 2009; Vähätalo et al., 2010; Rossel et al., 2013). Thus, as the present study refers to the most bioavailable fraction of BLPs, the entire pool of BPLs is likely larger than what was measured in this study.
BGD
12, 8199–8234, 2015BLPs from riverine non-labile DOC
V. Kasurinen et al.
Title Page
Abstract Introduction
Conclusions References
Tables Figures
◭ ◮
◭ ◮
Back Close
Full Screen / Esc
Printer-friendly Version Interactive Discussion
Discussion
P
a
per
|
Discussion
P
a
per
|
Discussion
P
a
per
|
Discussion
P
a
per
|
4.1.3 BGEs on BLPs and non-labile DOC
Our BGE on BLPs (12.0±7.2 %; Table 4) provides the first direct estimate for the BGE
of microbial communities on a group of compounds classified as BLPs. Our values can be compared to BGEs reported for single compounds such as acetic and formic acids (Bertilsson and Tranvik, 1998). BGEs on formic and acetic acids has been 2 and
5
41 %, in one study (Bertilsson and Tranvik, 1998), but 20–27 and 73–80 %, respectively, in another study (Remington et al., 2011). The earlier studies demonstrate that BGE on a single BLP compound can vary and thus it is a challenge to determine BGE separately for each BLP compound and compile them together for an overall BGE on all BLPs. Such a simple overall BGE (12.0±7.2 %) can now be applied on BLPs based 10
on the results of the present study.
Our BGE on DOM in the dark controls (11.5±3.9 %, Table 4) represents an estimate for BGE on non-labile tDOC in coastal waters. This estimate falls to the lower range of hundreds BGE determinations done with freshly collected water representing BGEs primarily on labile DOC (Kroer, 1993; del Giorgio and Cole, 1998; Wikner et al., 1999).
15
Our BGE on non-labile DOC is similar to BGE (mean 11 %) on riverine DOC aged for 100 to 450 days (Asmala et al., 2014). An extensive aging of humic lake water by 6 years resulted in BGEs of 5–6 % (Kragh et al., 2008). The results of this (Figs. 1 and 3; Tables 3 and 4) and earlier studies (Kragh et al., 2008; Berggren et al., 2009; Vähätalo et al., 2010; Asmala et al., 2014) emphasize that bacteria can assimilate non-labile
20
tDOC, but a relatively low BGE.
5 Conclusions
Our study shows that the mineralization and transformation of tDOC will continue in the coastal ocean after the quick consumption of labile tDOC at estuaries (Figs. 1– 3, Tables 3 and 4). As the tDOC is transported towards open ocean, the microbes
25
BGD
12, 8199–8234, 2015BLPs from riverine non-labile DOC
V. Kasurinen et al.
Title Page
Abstract Introduction
Conclusions References
Tables Figures
◭ ◮
◭ ◮
Back Close
Full Screen / Esc
Printer-friendly Version Interactive Discussion
Discussion
P
a
per
|
Discussion
P
a
per
|
Discussion
P
a
per
|
Discussion
P
a
per
|
et al., 2014). The photochemical transformation of tDOC is expected to increase after the turbidity maximum, advection and mixing into optically transparent marine waters. These reactions transform tDOC directly into CO2Miller and Zepp (1995); Aarnos et al. (2012) and into BLPs to be assimilated by bacteria with BGEs around 12 % (Table 4). The photochemical production of BLPs in coastal waters can be estimated with two
ap-5
proaches. The AQYs can estimate the production of BLPs locally in the rivers plumes at any specified time with known solar irradiance (Tables 5 and 6). Similar estimates can be made by multiplying photobleaching of CDOM (Whitehead et al., 2000; Osburn et al., 2001; Vähätalo and Wetzel, 2004) with 0.335 mmol C m−2(Fig. 2). Photobleach-ing also provides a robust estimate for the annual production of BLPs by each river or
10
all rivers (Table 7). Although this estimate does not specify where and when the pho-tochemical transformations take place, it improves integrative synthesis on the fate of tDOC in the coastal ocean and its linkages to marine food webs (Bauer et al., 2013).
Acknowledgements. We thank the scientists and their teams responsible for sampling
river waters: E. M. Paolucci (Paraná), D. E. Musibono (Congo), A. Shantz (Mekong), S. R. 15
Khan (Ganges–Brahmaputra), Q. Huang (Yangtze), W. Schneider (Lena), A. Rivas and C. E. Rezende (Amazon), E. Petrescu (Danube), and H. E. Reader (Mississippi). We are grateful to Nicolas Hatzianastassiou for providing the annual doses of global radiation for the river plumes. This research was funded by the Finnish Academy and by the Nordic Center of Excellence CRAICC (Cryosphere–atmosphere interactions in a changing Arctic climate). We also thank 20
the Academy of Finland Center of Excellence (project number 1118615) and Norwegian Uni-versity of Science and Technology (NTNU).
References
Aarnos, H., Ylöstalo, P., and Vähätalo, A. V.: Seasonal phototransformation of dissolved organic matter to ammonium, dissolved inorganic carbon, and labile substrates supporting bacterial 25
biomass across the Baltic Sea, J. Geophys. Res., 117, 1–14, doi:10.1029/2010JG001633, 2012. 8201, 8204, 8207, 8208, 8211, 8214, 8215, 8217
BGD
12, 8199–8234, 2015BLPs from riverine non-labile DOC
V. Kasurinen et al.
Title Page
Abstract Introduction
Conclusions References
Tables Figures
◭ ◮
◭ ◮
Back Close
Full Screen / Esc
Printer-friendly Version Interactive Discussion
Discussion
P
a
per
|
Discussion
P
a
per
|
Discussion
P
a
per
|
Discussion
P
a
per
|
Abboudi, M., Jeffrey, W. H., Ghiglione, J.-F., Pujo-Pay, M., Oriol, L., Sempéré, R., Charrière, B., and Joux, F.: Effects of photochemical transformations of dissolved organic matter on bacte-rial metabolism and diversity in three contrasting coastal sites in the Northwestern Mediter-ranean Sea during summer, Microb. Ecol., 55, 344–57, doi:10.1007/s00248-007-9280-8, 2008. 8202
5
Asmala, E., Autio, R., Kaartokallio, H., Stedmon, C. A., and Thomas, D. N.: Processing of humic-rich riverine dissolved organic matter by estuarine bacteria: effects of predegradation and inorganic nutrients, Aquat. Sci., 76, 451–463„ doi:10.1007/s00027-014-0346-7, 2014. 8204, 8216
Bauer, J. E., Cai, W.-J., Raymond, P. A., Bianchi, T. S., Hopkinson, C. S., and Reg-10
nier, P. A. G.: The changing carbon cycle of the coastal ocean, Nature, 504, 61–70, doi:10.1038/nature12857, 2013. 8201, 8217
Berggren, M., Laudon, H., and Jansson, M.: Aging of allochthonous organic carbon regu-lates bacterial production in unproductive boreal lakes, Limnol. Oceanogr., 54, 1333–1342, doi:10.4319/lo.2009.54.4.1333, 2009. 8216
15
Bertilsson, S. and Tranvik, L.: Photochemical transformation of dissolved organic matter in lakes, Limnol. Oceanogr., 45, 753–762, doi:10.4319/lo.2000.45.4.0753, 2000. 8201, 8213, 8214
Bertilsson, S. and Tranvik, L. J.: Photochemically produced carboxylic acids as substrates for freshwater bacterioplankton, Limnol. Oceanogr., 43, 885–895, 1998. 8216
20
Brinkmann, T., Hörsch, P., Sartorius, D., and Frimmel, F. H.: Photoformation of low-molecular-weight organic acids from brown water dissolved organic matter, Environ. Sci. Technol., 37, 4190–4198, doi:10.1021/es0263339, 2003. 8201, 8213, 8214
Cai, W.-J.: Estuarine and coastal ocean carbon paradox: CO2sinks or sites of terrestrial carbon incineration?, Ann. Rev. Mar. Sci., 3, 123–145, doi:10.1146/annurev-marine-120709-142723, 25
2011. 8200, 8212, 8213
Carlson, C. A.: Production and Removal Processes, in: Biogeochemistry of Marine Dissolved Organic Matter, edited by: Hansell, D. A. and Carlson, C. A., 91–151, Elsevier, 2002. 8203 Cauwet, G.: DOM in the Coastal Zone, in: Biogeochemistry of Marine Dissolved Organic Matter,
edited by: Hansell, D. A. and Carlson, C. A., 579–609, Academic Press, San Diego, 2002. 30
8203, 8208, 8230
BGD
12, 8199–8234, 2015BLPs from riverine non-labile DOC
V. Kasurinen et al.
Title Page
Abstract Introduction
Conclusions References
Tables Figures
◭ ◮
◭ ◮
Back Close
Full Screen / Esc
Printer-friendly Version Interactive Discussion
Discussion
P
a
per
|
Discussion
P
a
per
|
Discussion
P
a
per
|
Discussion
P
a
per
|
Cory, R. M., Ward, C. P., Crump, B. C., and Kling, G. W.: Sunlight controls wa-ter column processing of carbon in arctic fresh wawa-ters, Science, 345, 925–928, doi:10.1126/science.1253119, 2014. 8201, 8205, 8215
Coynel, A., Seyler, P., Etcheber, H., Meybeck, M., and Orange, D.: Spatial and seasonal dy-namics of total suspended sediment and organic carbon species in the Congo River, Global 5
Biogeochem. Cy., 19, 1–17, doi:10.1029/2004GB002335, 2005. 8203, 8208, 8230
del Giorgio, P. A. and Cole, J. J.: Bacterial growth efficiency in natural aquatic systems, Annu. Rev. Ecol. Syst., 29, 503–541, doi:10.1146/annurev.ecolsys.29.1.503, 1998. 8201, 8205, 8216
del Giorgio, P. A. and Davis, J.: 17 – patterns in dissolved organic matter lability and consump-10
tion across aquatic ecosystems, in: Aquatic Ecosystems, a volume in Aquatic Ecology, edited by: Findlay, S. E. G. and Sinsabaugh, R. L., Academic Press, Burlington, doi:10.1016/B978-012256371-3/50018-4, 399–424, 2003. 8201
del Giorgio, P. A., Cole, J. J., and Cimbleris, A.: Respiration rates in bacteria exceed phyto-plankton production in unpductive aquatic systems, Nature, 385, 148–151, 1997. 8205 15
Goldman, J. C., Caron, D. A., and Dennett, M. R.: Regulation of gross growth efficiency and ammonium regeneration in bacteria by substrate C : N ratio, Limnol. Oceanogr., 32, 1239– 1252, doi:10.4319/lo.1987.32.6.1239, 1987. 8213
Granskog, M. A., Stedmon, C. A., Dodd, P. A., Amon, R. M. W., Pavlov, A. K., De Steur, L., and Hansen, E.: Characteristics of colored dissolved organic matter (CDOM) in the Arctic outflow 20
in the Fram Strait: assessing the changes and fate of terrigenous CDOM in the Arctic Ocean, J. Geophys. Res.-Oceans, 117, 1–13, doi:10.1029/2012JC008075, 2012. 8214
Hatzianastassiou, N., Matsoukas, C., Fotiadi, A., Pavlakis, K. G., Drakakis, E., Hatzidim-itriou, D., and Vardavas, I.: Global distribution of Earth’s surface shortwave radiation budget, Atmos. Chem. Phys., 5, 2847–2867, doi:10.5194/acp-5-2847-2005, 2005. 8208
25
Hobbie, J. E., Daley, R. J., and Jasper, S.: Use of nuclepore filters for counting bacteria by fluorescence microscopy. Use of nuclepore filters for counting bacteria by fluorescence mi-croscopy, Appl. Environ. Microb., 33, 1225–1228, 1977. 8206
Jaffé, R., Ding, Y., Niggemann, J., Vähätalo, A. V., Stubbins, A., Spencer, R. G. M., Campbell, J., and Dittmar, T.: Global charcoal mobilization from soils via dissolution and riverine transport 30
to the oceans, Science, 340, 345–347, doi:10.1126/science.1231476, 2013. 8203
Kester, D. R., Duedall, I. W., Connors, D. N., and Pytkowic, R.: Preparation of artificial seawater, Limnol. Oceanogr., 12, 176–179, doi:10.4319/lo.1967.12.1.0176, 1967. 8203
BGD
12, 8199–8234, 2015BLPs from riverine non-labile DOC
V. Kasurinen et al.
Title Page
Abstract Introduction
Conclusions References
Tables Figures
◭ ◮
◭ ◮
Back Close
Full Screen / Esc
Printer-friendly Version Interactive Discussion
Discussion
P
a
per
|
Discussion
P
a
per
|
Discussion
P
a
per
|
Discussion
P
a
per
|
Kieber, D. J. and Mopper, K.: Photochemical formation of glyoxylic and pyruvic acids in seawa-ter, Mar. Chem., 21, 135–149, doi:10.1016/0304-4203(87)90034-X, 1987. 8215
Kieber, R. J., Zhou, X., and Mopper, K.: Formation of carbonyl compounds from UV-induced photodegradation of humic substances in natural waters: fate of riverine carbon in the sea, Limnol. Oceanogr., 35, 1503–1515, 1990. 8201, 8213, 8214
5
Koehler, B., Landelius, T., Weyhenmeyer, G. A., Machida, N., and Tranvik, L. J.: Sunlight-induced carbon dioxide emissions from inland waters, Global Biogeochem. Cy., 28, 696–711, doi:10.1002/2014GB004850, 2014. 8212
Kragh, T., Søndergaard, M., and Tranvik, L.: Effect of exposure to sunlight and phosphorus-limitation on bacterial degradation of coloured dissolved organic matter (CDOM) in freshwa-10
ter, FEMS Microbiol. Ecol., 64, 230–9, doi:10.1111/j.1574-6941.2008.00449.x, 2008. 8216 Kroer, N.: Bacterial growth efficiency on natural dissolved organic matter, Limnol. Oceanogr.,
38, 1282–1290, 1993. 8216
Lalonde, K., Vähätalo, A. V., and Gélinas, Y.: Revisiting the disappearance of terrestrial dissolved organic matter in the ocean: a δ13C study, Biogeosciences, 11, 3707–3719, 15
doi:10.5194/bg-11-3707-2014, 2014. 8203, 8204
Lønborg, C. and Álvarez Salgado, X. A.: Recycling versus export of bioavailable dissolved organic matter in the coastal ocean and efficiency of the continental shelf pump, Global Biogeochem. Cy., 26, 1–12, doi:10.1029/2012GB004353, 2012. 8200, 8204
Lønborg, C., Álvarez Salgado, X. A., Davidson, K., and Miller, A. E.: Production of bioavail-20
able and refractory dissolved organic matter by coastal heterotrophic microbial populations, Estuar. Coast. Shelf S., 82, 682–688, doi:10.1016/j.ecss.2009.02.026, 2009. 8200
Massana, R., Gasol, J. M., Bjørnsen, P. K., Black-Burn, N., Hagström, Å., Hietanen, S., Hygum, B. H., Kuparinen, J., and Pedors-Alio, C.: Measurement of bacterial size via image analysis of epifluorescence preparations: description of an inexpensive system and solutions 25
to some of the most common problems, Sci. Mar., 61, 397–407, 1997. 8206
Miller, W. L. and Moran, M. A.: Interaction of photochemical and microbial processes in the degradation of refractory dissolved organic matter from a coastal marine environment, Lim-nol. Oceanogr., 42, 1317–1324, available at: http://www.jstor.org/stable/10.2307/2839130, 1997. 8201, 8213, 8214
30
BGD
12, 8199–8234, 2015BLPs from riverine non-labile DOC
V. Kasurinen et al.
Title Page
Abstract Introduction
Conclusions References
Tables Figures
◭ ◮
◭ ◮
Back Close
Full Screen / Esc
Printer-friendly Version Interactive Discussion
Discussion
P
a
per
|
Discussion
P
a
per
|
Discussion
P
a
per
|
Discussion
P
a
per
|
Miller, W. L., Moran, M. A., and Sheldon, W. M.: Determination of apparent quantum yield spec-tra for the formation of biologically labile photoproducts, Limnol. Oceanogr., 47, 343–352, available at: http://www.jstor.org/stable/10.2307/3068981, 2002. 8201, 8211, 8212, 8215 Milliman, J. D. and Farnsworth, K. L.: River Discharge to the Coastal Ocean: a Global
Synthe-sis, vol. 24, Cambridge University Press, Cambridge, doi:10.5670/oceanog.2011.108, 2011. 5
8203, 8230
Minor, E. C., Pothen, J., Dalzell, B. J., Abdulla, H., and Mopper, K.: Effects of salinity changes on the photodegradation and ultraviolet-visible absorbance of terrestrial dissolved organic matter, Limnol. Oceanogr., 51, 2181–2186, doi:10.4319/lo.2006.51.5.2181, 2006.
Moran, M. and Zepp, R.: Role of photoreactions in the formation of biologically labile com-10
pounds from dissolved organic matter, Limnol. Oceanogr., 42, 1307–1316, available at: http://www.aslo.org/lo/toc/vol_42/issue_6/1307.pdf, 1997. 8215
Nelson, N. B. and Siegel, D. A.: The global distribution and dynamics of chromophoric dis-solved organic matter, Ann. Rev. Mar. Sci., 5, 447–76, doi:10.1146/annurev-marine-120710-100751, 2013. 8208, 8214
15
Norland, S.: The relationship between biomass and volume of bacteria, in: Handbook of Meth-ods in Aquatic Microbial Ecology, edited by: Kemp, P., Sherr, B., Sherr, E., and Cole, J., Lewis Publishers, Boca Raton, 303–307, 1993. 8206
Obernosterer, I. and Herndl, G.: Differences in the optical and biological reactivity of the humic and nonhumic dissolved organic carbon component in two contrasting coastal marine en-20
vironments, Limnol. Oceanogr., 45, 1120–1129, available at: http://www.jstor.org/stable/10. 2307/2670702, 2000. 8201, 8213, 8214
Osburn, C. L., Zagarese, H. E., Morris, D. P., Hargreaves, B. R., and Cravero, W. E.: Calculation of spectral weighting functions for the solar photobleaching of chro-mophoric dissolved organic matter in temperate lakes, Limnol. Oceanogr., 46, 1455–1467, 25
doi:10.4319/lo.2001.46.6.1455, 2001. 8217
R Core Team: R: a Language and Environment for Statistical Computing, R Foundation for Statistical Computing, Vienna, Austria, http://www.r-project.org/, 2014. 8205, 8209
Reader, H. E. and Miller, W. L.: The efficiency and spectral photon dose dependence of pho-tochemically induced changes to the bioavailability of dissolved organic carbon, Limnol. 30
Oceanogr., 59, 182–194, doi:10.4319/lo.2014.59.1.0182, 2014. 8201
Remington, S., Krusche, A., and Richey, J.: Effects of DOM photochemistry on bacterial metabolism and CO2 evasion during falling water in a humic and a whitewater river in the
BGD
12, 8199–8234, 2015BLPs from riverine non-labile DOC
V. Kasurinen et al.
Title Page
Abstract Introduction
Conclusions References
Tables Figures
◭ ◮
◭ ◮
Back Close
Full Screen / Esc
Printer-friendly Version Interactive Discussion
Discussion
P
a
per
|
Discussion
P
a
per
|
Discussion
P
a
per
|
Discussion
P
a
per
|
Brazilian Amazon, Biogeochemistry, 105, 185–200, doi:10.1007/s10533-010-9565-8, 2011. 8216
Rossel, P. E., Vähätalo, A. V., Witt, M., and Dittmar, T.: Molecular composition of dissolved or-ganic matter from a wetland plant (Juncus effusus) after photochemical and microbial decom-position (1.25 yr): common features with deep sea dissolved organic matter, Org. Geochem., 5
60, 62–71, doi:10.1016/j.orggeochem.2013.04.013, 2013. 8215
Smith, E. and Benner, R.: Photochemical transformations of riverine dissolved organic matter: effects on estuarine bacterial metabolism and nutrient demand, Aquat. Microb. Ecol., 40, 37–50, doi:10.3354/ame040037, 2005. 8201, 8213
Smith, S. V. and Hollibaugh, J. T.: Coastal metabolism and the oceanic organic carbon balance, 10
Rev. Geophys., 31, 75–89, 1993. 8201
Søndergaard, M. and Middelboe, M.: A cross-system analysis of labile dissolved organic car-bon, Mar. Ecol.-Prog. Ser., 118, 283–294, available at: http://www.int-res.com/abstracts/ meps/v118/p283-294/, 1995. 8200, 8201, 8204, 8205
Spencer, R. G. M., Aiken, G. R., Dornblaser, M. M., Butler, K. D., Holmes, R. M., Fiske, G., 15
Mann, P. J., and Stubbins, A.: Chromophoric dissolved organic matter export from US rivers, Geophys. Res. Lett., 40, 1575–1579, doi:10.1002/grl.50357, 2013. 8208, 8214, 8230 Stedmon, C., Amon, R., Rinehart, A., and Walker, S.: The supply and characteristics of colored
dissolved organic matter (CDOM) in the Arctic Ocean: pan arctic trends and differences, Mar. Chem., 124, 108–118, doi:10.1016/j.marchem.2010.12.007, 2011. 8208, 8214, 8230 20
Stepanauskas, R., Jørgensen, N. O. G., Eigaard, O. R., Zvikas, A., Tranvik, L. J., and Leonard-son, L.: Summer inputs of riverine nutrients to the Baltic Sea: bioavailability and eutrophica-tion relevance, Ecol. Monogr., 72, 579–597, 2002. 8206
Vähätalo, A. and Järvinen, M.: Photochemically produced bioavailable nitrogen from biologically recalcitrant dissolved organic matter stimulates production of a nitrogen-limited microbial 25
food web in the Baltic Sea, Limnol. Oceanogr., 52, 132–143, 2007. 8201
Vähätalo, A. V.: Light, Photolytic Reactivity and Chemical Products – Encyclopedia of Inland Waters, vol. 2, 2nd edn., Likens, Oxford, doi:10.1016/B978-012370626-3.00110-1, 2009. 8215
Vähätalo, A. V. and Wetzel, R. G.: Photochemical and microbial decomposition of chromophoric 30
BGD
12, 8199–8234, 2015BLPs from riverine non-labile DOC
V. Kasurinen et al.
Title Page
Abstract Introduction
Conclusions References
Tables Figures
◭ ◮
◭ ◮
Back Close
Full Screen / Esc
Printer-friendly Version Interactive Discussion
Discussion
P
a
per
|
Discussion
P
a
per
|
Discussion
P
a
per
|
Discussion
P
a
per
|
Vähätalo, A. V., Aarnos, H., and Mäntyniemi, S.: Biodegradability continuum and biodegradation kinetics of natural organic matter described by the beta distribution, Biogeochemistry, 100, 227–240, doi:10.1007/s10533-010-9419-4, 2010. 8215, 8216
Vähätalo, A. V., Aarnos, H., Hoikkala, L., and Lignell, R.: Photochemical transformation of ter-restrial dissolved organic matter supports hetero- and autotrophic production in coastal wa-5
ters, Mar. Ecol.-Prog. Ser., 423, 1–14, doi:10.3354/meps09010, 2011. 8201, 8207, 8211, 8213
Warkentin, M., Freese, H. M., Karsten, U., and Schumann, R.: New and fast method to quantify respiration rates of bacterial and plankton communities in freshwater ecosys-tems by using optical oxygen sensor spots, Appl. Environ. Microb., 73, 6722–6729, 10
doi:10.1128/AEM.00405-07, 2007. 8205
Warkentin, M., Freese, H. M., and Schumann, R.: Bacterial activity and bacterioplankton diver-sity in the eutrophic River Warnow – direct measurement of bacterial growth efficiency and its effect on carbon utilization, Microb. Ecol., 61, 190–200, doi:10.1007/s00248-010-9729-z, 2011. 8205
15
Wetzel, R. G., Hatcher, P. G., and Bianchi, T. S.: Natural photolysis by ultraviolet irradiance of recalcitrant dissolved organic matter to simple substrates for rapid bacterial metabolism, Limnol. Oceanogr., 40, 1369–1380, 1995. 8201
White, E. M., Kieber, D. J., Sherrard, J., Miller, W. L., and Mopper, K.: Carbon dioxide and carbon monoxide photoproduction quantum yields in the Delaware Estuary, Mar. Chem., 20
118, 11–21, doi:10.1016/j.marchem.2009.10.001, 2010.
Whitehead, R. F., de Mora, S., Demers, S., Gosselin, M., Monfort, P., and Mostajir, B.: Inter-actions of ultraviolet-B radiation, mixing, and biological activity on photobleaching of natural chromophoric dissolved organic matter: a mesocosm study, Limnol. Oceanogr., 45, 278–291, 2000. 8217
25
Wikner, J., Cuadros, R., and Jansson, M.: Differences in consumption of allochthonous DOC under limnic and estuarine conditions in a watershed, Aquat. Microb. Ecol., 17, 289–299, doi:10.3354/ame017289, 1999. 8216
Xiao, Y.-H., Sara-Aho, T., Hartikainen, H., and Vähätalo, A. V.: Contribution of ferric iron to light absorption by chromophoric dissolved organic matter, Limnol. Oceanogr., 58, 653–662, 30
doi:10.4319/lo.2013.58.2.0653, 2013. 8203
BGD
12, 8199–8234, 2015BLPs from riverine non-labile DOC
V. Kasurinen et al.
Title Page Abstract Introduction Conclusions References Tables Figures ◭ ◮ ◭ ◮ Back Close
Full Screen / Esc
Printer-friendly Version Interactive Discussion Discussion P a per | Discussion P a per | Discussion P a per | Discussion P a per |
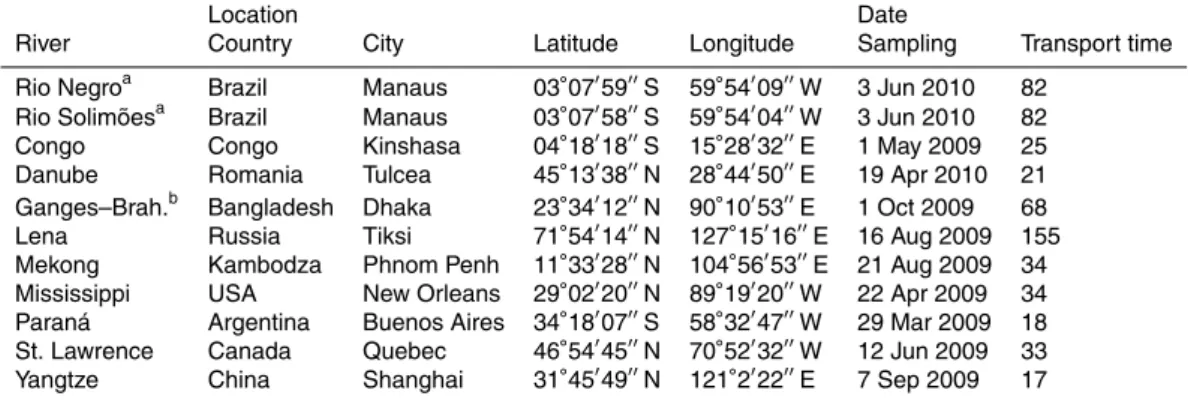
Table 1.Locations and dates for sampling. City refers to a location close to the site of sampling given by coordinates. Transport time expresses the days elapsed between the sampling and the arrival of the sample to laboratory.
Location Date
River Country City Latitude Longitude Sampling Transport time Rio Negroa Brazil Manaus 03◦
07′ 59′′
S 59◦ 54′
09′′
W 3 Jun 2010 82 Rio Solimõesa Brazil Manaus 03◦
07′ 58′′
S 59◦ 54′
04′′
W 3 Jun 2010 82
Congo Congo Kinshasa 04◦
18′ 18′′
S 15◦ 28′
32′′
E 1 May 2009 25
Danube Romania Tulcea 45◦
13′ 38′′
N 28◦ 44′
50′′
E 19 Apr 2010 21 Ganges–Brah.b Bangladesh Dhaka 23◦
34′ 12′′
N 90◦ 10′
53′′
E 1 Oct 2009 68
Lena Russia Tiksi 71◦
54′ 14′′
N 127◦ 15′
16′′
E 16 Aug 2009 155 Mekong Kambodza Phnom Penh 11◦
33′ 28′′
N 104◦ 56′
53′′
E 21 Aug 2009 34 Mississippi USA New Orleans 29◦
02′ 20′′
N 89◦ 19′
20′′
W 22 Apr 2009 34 Paraná Argentina Buenos Aires 34◦
18′ 07′′
S 58◦ 32′
47′′
W 29 Mar 2009 18 St. Lawrence Canada Quebec 46◦
54′ 45′′
N 70◦ 52′
32′′
W 12 Jun 2009 33
Yangtze China Shanghai 31◦
45′ 49′′
N 121◦ 2′
22′′
E 7 Sep 2009 17
BGD
12, 8199–8234, 2015BLPs from riverine non-labile DOC
V. Kasurinen et al.
Title Page
Abstract Introduction
Conclusions References
Tables Figures
◭ ◮
◭ ◮
Back Close
Full Screen / Esc
Printer-friendly Version Interactive Discussion
Discussion
P
a
per
|
Discussion
P
a
per
|
Discussion
P
a
per
|
Discussion
P
a
per
|
Table 2. Absorption coefficients of chromophoric dissolved organic matter at wavelength 300 nm (aCDOM,300m
−1
) in the initial, the dark and the irradiated samples (mean±sd of three determinations), the amount of photobleaching (Dark–Irradiated) given as absorption coeffi -cient (∆aCDOM,300m
−1
) as well as the relative difference (%) between the irradiated and to dark controls (Dark–Irradiated/Dark).
River aCDOM,300 Photobleaching
Intial Dark Irradiated ∆aCDOM,300 (Dark–Irradiated)/Dark (%)
Amazon 13.06±0.03 12.92±0.02 5.97±0.02 6.95±0.04 54±0.1 Congo 21.61±0.03 21.54±0.03 9.12±0.03 12.42±0.06 58±0.1 Danube 4.08±0.03 3.79±0.01 1.73±0.02 2.06±0.03 54±0.4 Ganges–Brah.* 1.08±0.03 1.12±0.03 0.64±0.03 0.48±0.06 43±1.1 Lena 10.92±0.04 10.86±0.02 5.22±0.03 5.64±0.05 52±0.2 Mekong 2.41±0.02 2.41±0.01 1.21±0.03 1.20±0.04 50±1.0 Mississippi 5.90±0.05 6.01±0.05 2.79±0.04 3.22±0.09 54±0.3 Paraná 4.49±0.08 4.48±0.01 2.70±0.01 1.78±0.02 40±0.1 St. Lawrence 6.39±0.17 6.29±0.07 3.12±0.16 3.17±0.23 50±2.0 Yangtze 2.57±0.05 2.63±0.08 1.26±0.03 1.37±0.15 52±0.3
* Ganges–Brahmaputra.
BGD
12, 8199–8234, 2015BLPs from riverine non-labile DOC
V. Kasurinen et al.
Title Page
Abstract Introduction
Conclusions References
Tables Figures
◭ ◮
◭ ◮
Back Close
Full Screen / Esc
Printer-friendly Version Interactive Discussion
Discussion
P
a
per
|
Discussion
P
a
per
|
Discussion
P
a
per
|
Discussion
P
a
per
|
Table 3.Bacterial cell densities (109cells L−1, mean±sd of two replicates) in the beginning of bioassay (t=0) and at the time of maximum cell density in the irradiated (Irradiated) samples and in the dark control samples (Dark), the time of maximal density (in days) and the relative increase in the density based on BLPs: (Irradiated–Dark)/Dark (%).
River Cell Time of (Irradiated–
density max density Dark)/Dark t=0 Dark Irradiated (d) (%)
Amazon 0.01 0.67±0.02 1.54±0.04 8 130±01 Congo 0.03 1.89±0.04 4.01±0.12 5 112±02
Danube 0.02 0.50±0.02 1.04±0.02 8 108±04 Ganges–Brah.* 0.02 0.48±0.03 0.73±0.07 5 52±05 Lena 0.03 0.36±0.07 0.48±0.04 6 33±15 Mekong 0.02 0.64±0.06 1.00±0.04 12 56±08
Mississippi 0.02 1.58±0.03 2.53±0.15 10 60±06 Paraná 0.24 0.80±0.03 1.09±0.03 9 36±01 St. Lawrence 0.03 0.59±0.01 0.87±0.00 12 47±01 Yangtze 0.03 0.64±0.06 1.08±0.02 9 69±13