ISSN 1546-9239
© 2008 Science Publications
Corresponding Author: I. Mohd Hasmadi, Department of Forest Production, Survey and Engineering Laboratory, Faculty of Forestry, Universiti Putra Malaysia, 43400 UPM, Serdang, Selangor, Malaysia
Sensitivity Analysis of an Optimal Access Road Location in HillyForest Area:
A GIS Approach
1
Mohd Hasmadi, I. and
2J.C. Taylor
1
Department of Forest Production, Survey and Engineering Laboratory,
Faculty of Forestry, Universiti Putra Malaysia, 43400 UPM, Serdang, Selangor, Malaysia
2
Cranfield Centre for Geographical Information Management, National Soil Resources Institute,
Cranfield University, Silsoe, Bedford, MK45 4DT, United Kingdom
Abstract: There are various models for establishing the efficient forest road allocation and evaluating optimum density of forest roads network for the transport of timber commodity. Most of them are based on the calculation of common timber transport costs and costs for forest roads. Today, forest road design from traditional method continues to be transformed by remote sensing technology and advancement of GIS. It is now possible for a forester to analyze many different road location alternatives over a large geographic area in a minimal amount of time. A computer programming using GIS, digital terrain data and sensitivity analysis for locating optimal forest road access in a hill area is presented. The optimal access road location specifies destination (starting point) and target (ending point) of the desired path. These paths were allocated by calculated each individual criteria by given weights placed on each cell. Therefore, the objective of this work is to describe an attempt to compute the optimal allocation of forest road corridor in hilly area of Peninsular Malaysia using GIS approach and sensitivity analysis to satisfy the result. Finally, the model minimizes total cost of construction and forest environmental impacts resulting from a specific access road. Sensitivity analysis should be explored further to understand the effects of uncertainty in derivation of model parameter on model outputs. It is concluded that the location of optimal access path were established in the area can reduce the cost and environmental impact to the forest ecosystem.
Key words: Hill forest area, access road location, sensitivity analysis, GIS
INTRODUCTION
There are various models for establishing the efficient forest road alignment and evaluating optimum density of forest roads network for the transport of timber commodity through a combined use of tractor and truck. Most of them are based on the calculation of common timber transport costs and costs for forest roads. A few studies describe a model based on economic evaluation of alternative roads[1]. Conducted a road study that identified the broad feasibility of accessible corridors. They identified and selected broad corridors which were used for detailed evaluation of optimum road potential. Further analyses were supported by aerial photo interpretation, field survey and DEM analysis. Other models were applied to allocate potential roads, which might best minimize environmental impact. This evaluation is done by calculating a minimum total score from variable factors related to conservation of forest land and based on constraints and topographical features[2,3]. In natural
dipterocarp forest like Malaysia, timber volume per ha are scattered over a large area. Extraction by tractors to the main logyard is slow, in every shift only a small number of logs is extracted and so costs are rather high. Transport by trucks is much quicker, a big quantity of logs is transported at the same time, so this method of transport is cheaper. Therefore, the denser the forest roads network, the higher are the costs incurred for the roads construction and the impact to the environmental is greater. This is the reason why the surface area and the distance of the road are used to determine the optimum road alignment and density of forest roads. In order to acquire an ideal environmental protection in hill forest the effort should be made to avoid any sensitive site such as excessive slope, elevation, hydrological buffer zone, etc. If not possible to ovoid these sites, an effort must be made to minimize impact to the forest ecosystem.
road design tools and optimization models have been built to assist the development of transportation plans. Part of the design process is to evaluate a sufficient number of alternative routes to locate a final optimal access that meets operational and environmental targets. In fact, the problem of choosing the optimum forest road alignment forest is important in theory but in practice it is difficult to solve. However, it observes that modeling through mathematical programming and information contained within geographical information system (GIS) is useful to overcome the problem. Therefore the objective of this work is to describe an attempt to compute the optimal allocation of forest road corridor in hilly area of Peninsular Malaysia using GIS approach and sensitivity analysis to satisfy the result
MATERIALS AND METHODS
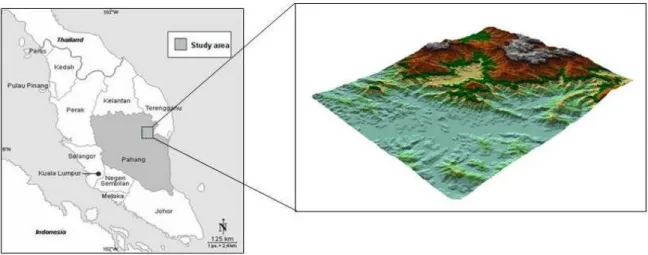
Description of the study area: The technique is demonstrated with a forest management compartment of Sungai Tekai Forest Reserve of Pahang State, Peninsular Malaysia. The demonstration site consists of several compartments covers an area about 5758.32 ha (Fig. 1). It is situated within latitude 04°C10´N-04°C30´N and longitude 103°C03´E-103°C30´E, about 240 km north-east of the capital Kuala Lumpur. The elevation is mostly over 600 m above sea level. The slope gradient of the study area is undulating with steep rugged slopes ranging from 100 to 800. The annual precipitation is about 210 cm with a high tropical climate with mean temperatures ranging from 20-31°C. Based on the north-east Pahang Schematic Reconnaisance Soil Map of 1965[4] the principle soils occurring in this area are from the Munchong-Serdang Series (Order Oxisol-Ultisol), Tropeptic Haplorthox-Typic Paleudult, Orthic
Feralsol-Dystric Nitosol). The texture of the soil ranges from silty loam to clay loam.
Definition used for forest road system and application: Several classifications and road systems can be found in literature. In different country a different classification and system were used. The[5] categorised forest road by three categories such as haul road (includes primary or main road, secondary road and feeder road), skid trail and access road. For the purpose of this study, the modification of definition and designing a classification system for forest road was based on the existing classification system by Malaysian Forestry Headquarters, Kuala Lumpur and road classification for tropical high forest[6]. It can be noted that, according to this classification the roads constructed within Sungai Tekai Forest Reserve area, especially at the selected study compartments were classified as secondary roads and was defined as temporary and may be semi-permanent, connective lines from secondary log yard to primary log yard of primary forest road, used by winch lorry and accessible by truck only under dry conditions, road width carriage way including shoulders is about 8 m. road have a simpler standard of construction and are usable by a truck only under favourable weather condition, road surface is partially unpaved and seriously compacted.
Data sources: Several digital data sets and were available for this study. The data set included a topographical and forest resource map and compartment map. Data were then organized into GIS database to facilitate spatial modelling to facilitate decision-making. The data were edited, georeferenced and topology constructed to make them usable for next the step in GIS analysis.
The digital topographical map was acquired from the Department of Survey and Mapping Malaysia. The map is scaled 1: 50, 000, based on aerial photograph/photogrammetric restitution. The forest resource/operation map was obtained from Pahang Department of Forestry. The 1:50,000 scale maps show the detail of forest compartments, existing forest roads and the pre-felling inventory data. The compartment layout follows the natural topographical features (for example streams and ridges) with the size of each respective compartment ranging from 105.23 to 435.44 ha. Forest compartments were digitised from forest operation maps and includes of 26 compartments.
Creation of a map-derived DEM: A Digital elevation model (DEM) of the study area was generated for topography and surface analysis. Topographical data are usually represented as Digital Elevation Model (DEM) in a raster or vector form in a Geographic Information System (GIS). An isolines contour at 20m intervals were digitised in ArcInfo from a topographic map at 1: 50000 scale. The contour lines were assigned an attribute value according to their height in meters above sea level. The resulting dataset was then used to produce a DEM using Arc View software with the 3D extension analyst. Height value were added to the existing contour line used previously in generating the DEM. Adding the height information to the contour lines was the most time consuming stage of the process to generate a DEM. Based on the study by[7], the accuracy of a raster DEM is related to the contour density and the DEM resolution can be derived as follows:
DEM accuracy[RMSE (m)]=(7.274 1.666S) D1000+ + ε
where, S stand for resolution in meters, D stands for contour density expressed as km km−2, ε is an error term related to D. Contour density was calculated by dividing the total length of contour by the size of the study area. The accuracy of terrain representation was evaluated against root-mean-square-error (RMSE) of elevation residual at 50 selected check points. RMSE was calculated from the following equation:
n
i i
i 1
1
RMSE (Z z )
n =
= −
where, n is number of check points, zi stands for the interpolated elevation at check point I, Zi is the elevation read directly from the enlarged map at the same position. In particular, the RMSE for the study
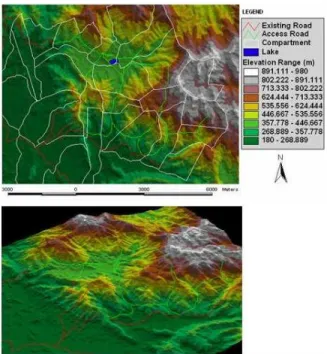
Fig. 2: Elevation map (DEM) of study area
Fig. 3: Illustration of a 15 cell grid of 20 m used in analysis of sensitivity of optimal access road location. A is a destination-entry point and B is target-point ended
area was based on the 10 DEM resolutions and 20 m contour interval (m). The contour density in this area is 25.82 km km−2, thus the RMSE of the DEM creation for the study area is 0.62. For classification purpose, a DEM of study area (Fig. 2) was used to produce four slope classes and expressed in degrees.
all other cells were lesser. Large numbers in individual cell are cell labels and small numbers are the criteria function coefficient of each cell. It is an integer programming formulation[8-10,3]. P1 through P6 are the access road cutting plane that cells must pass through, while white cells contain high value of suitable path allocation. From the cost weighted function, the direction was created to give a grid direction of the least cost path from each cell to each source. With the cost distance and direction of cells were created, the shortest path to the destination were run automatically. The raster of distance and direction gives the least forest path from destination to the target and back to the destination. Changing the weights for each criteria can result in several paths through the grid cell. The selected destination and target in each compartment is presented in Fig. 4.
Planning of optimal access road carried out from available data and at the standard scale of 1: 50,000 used by forestry department in planning a road at compartment level. In this study the cost of planning is considered rather than expenses cost of the road construction. In order to realize that, shortening the total cost can be made by reducing the distance and earth moved in the forest.
Sensitivity analysis was used to determine how sensitive a model to the changes in the value of the parameter while keeping the other parameters unchanged. It also helps to build confidence in the model by studying the uncertainties that are often associated with parameter in models. Sensitivity analysis allows determining what level of accuracy is necessary for a parameter to make the model sufficiently useful and valid. In this study, as an example, the parameter sensitivity is carried out for path allocation to determine the variation in the output caused by different input weights for slope and distance
Fig. 4: The selected targets and destinations created for this study in forest compartments
to road cost. The model finds the best path given the weights placed. By varying the weight, several different paths can be found.
RESULTS AND DISCUSSION
Proposed access road location and analysis: This section discusses the result of computer modelling technique in locating optimal access road locations. Based on the evaluation factors on selected compartments, the access road location was executed to determine the road net pattern. The developed access roads locations were designed by constructing access roads along existing secondary forest road. In this case, in the non-served forest compartment new access roads were located to serve the harvesting process at a minimum construction cost. All cost data sets (slope, distance from existing road and lake barrier) were merged together to create one grid cell. This output grid theme shows the total cost of constructing road paths through each cell or how suitable each location is for locating the new access road. Locations with low values indicates the cell in which it will be the least costly to build a forest road path. The lake barrier was assigned as no data and considered as an absolute barrier since it is impossible to build an access road through the lake.
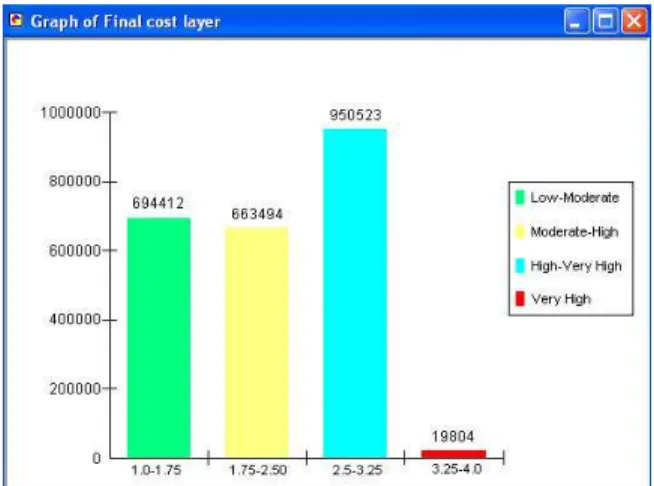
Evaluation of cell area revealed that Very High cost class represents only a tiny portion with 19804 counted cells (about 0.85%) as shown in Fig. 5. This shows that allocation of access roads to very costly area can be easily avoided. Among them, a High-Very High class indicates the major portion with 950523 cells counted (40.82%). This followed by other classes such as Low-Moderate and Moderate-High with counted cells of 694412 (29.82%) and 663494 (28.50%), respectively.
Fig. 6: The optimal access forest road location in the study area
The access road locations were determined after all cost distance and directions were performed to each created target and destination point. The cost distance calculates the least cumulative cost starting from one or several targets or destinations and travel through a cost surface. The optimal lay out of all the forest road accesses are depicted in Fig. 6. Overall total of access road aligned and proposed in the respective study area is 28, 745.35 m. Meanwhile the overall density calculated in selected compartments is about 9.93m/ha (0.80%). The Fig. shows exactly where the access road location has been constructed, as assumed the entire forest road alignments met the design according to specification outlined by the forestry department and criteria developed in this study. Meanwhile, the 3D view of the access road path is shown in Fig. 7.
In general, it is emphasized that the access road is aligned to avoid the most cost anomalies, where as noted the higher slope indicates possibly a higher construction cost. It is estimated that most of the slopes involved in the alignment are more than 10 degrees but do not exceed 40 degrees. It is also revealed that the highest elevation area affected in this path is 840 meters.
Sensitivity analysis for path allocation: As a result, an example sensitivity analysis for path allocation in determining variation in the output caused by different input weights for slope (SL) and distance to road (DTR) cost were presented. Path 2c, which is a connection between destination 2 and target 7, was selected as demonstration. Several iterations were made that test variation in weights. Figure 8 shows four paths derived using different weighting of the slope and distance. Changing the weight of parameter resulted in different path allocations. For example, the path labeled SL-80%, DTR-20% in green uses weight 80% for slope and 20%
Fig. 7: Optimal access road from 3D view of elevation range
Fig. 8: Path allocation by difference weighted of slope and distance to existing road
for distance road existing road. In other words, this path is the result when 80% weight more emphasis is place on the slope. On the other hand, the blue line is the path resulting when the two parameter have equal weights (SL-50%, DTR-50%). The other paths shown have other weight combinations.
Table 1: Summary of optimization of path location through test site Weights (%)
--- Road Slope range Elevation
SL DTR length (m) (degree) range (m)
90 10 1576.93 6-27 269-456
80 20 1539.24 6-28 269-470
70 30 1479.28 7-26 269-470
50 50 1399.59 7-30 269-472
SL = Slope, DTR = Distance to road
Fig. 9: The variation of the elevation and slope range versus path distance by difference weights
distance to road weight was increased. However, in this case there was not much difference for all paths allocated due to fact that the elevation and slope of the test site were below 500 m and 40 degree. Their range is between 6 degree to 30 degree and 269 to 472 m, respectively. The elevation and slope variations versus distance of path are shown in Fig. 9.
The selection of a preferred path will most likely be a compromise between decision makers. A compromise will always have a degree of subjectivity, but with the alternative paths their relative impact on economic and environmental can be optimized. In subsequent phases, the allocation process can be re-programmed for the whole path networks in the study area. A tool as described in this work will enhance path location decision making by bringing together what we know about road construction into visually displays alternatives. On the other hand, the model determines the best path given the weights placed.
CONCLUSIONS
The use of GIS and DEM with the additional supportive information was able to facilitate design of a proposed forest road more easily. This study however has developed a key approach, which integrated the computer system into forestry application that could assist planners and foresters in the planning and design stages for establishing an optimum forest road for forest harvest operations. Specifically, in the future, development of forest roads by means of GIS can be dynamically accessed by all user agencies in managing forest road systems. Overall total of access road aligned and proposed in the respective study area is 28,745.35m. Meanwhile the overall density calculated in selected compartments is about 9.93 m/ha (0.80%). The densities of road paths presented here are achieved below as outlined by the forestry department. Thus, there is potential to reduce damage to the residual stand and to the ground area disturbance by the harvesting operation. The forest road alignment and information in this study provides an initial foundation on which GIS can be used for this kind of analysis in forest road planning. Road planning must establish a minimum standard for road construction and all the forest road planning must establish minimum conditions for the consideration of new roads. It is desirable to construct forest road in consideration of environmental and economic conditions. Past research[11] has clearly revealed that inappropriate planning for the road lay out is inherently damaging to the land and should be discouraged. Due to the limitation and unavailability of tree location data, this study is not able to plan and design the proposed feeder road for tree extraction. Therefore, it is necessary for future research to include the feeder road analysis in the forest road planning (in scale of 1:500,00) because with the feeder road analysis, timber extraction is more detailed and more useful to the loggers. Sensitivity analysis should be explored further to understand the effects of uncertainty in derivation of model parameter on model outputs. It is concluded that the location of optimal access path were established in the area that reduce the cost and environmental impact when building the road.
REFERENCES
1. Tucek, J. and E. Pacola, 1999. Algorithms for Skidding Distance Modelling on a Raster Digital Terrain Model. J. Forest Eng., 10 (1): 67-79. 2. Minamikata, Y., 1984. Effective Forest Road
3. Judibal, C.C. 2000. GIS-Based Support System for Tactical Timber Harvesting Planning: Design and Development. Ph.D (Thesis), Universiti Putra Malaysia, Serdang, Selangor, Malaysia, pp: 174. 4. Geological Survey of Malaysia, 1985.
Reconnaissance Geological Survey of Northern Pahang, pp: 34.
5. FAO, 1977. A Framework for Land Evaluation. Food and Agriculture Organisation. International Institute for Land Reclamation and Improvement, Publication No. 22, Wangeningen, The Netherland. 6. Heindrich, R., 1975. Problem of Forest Roads Construction in Tropical High Forest. In: Technical Report of FAO/Austria Training Course on Forest Roads and Wood Harvesting in Mountainous Forest. pp: 97-113.
7. Gao, J., 1997. Resolution and Accuracy of Terrain Representation by Grid DEM at a Microscale. Int. J. Geographic Inform. Syst., 11: 199-212.
8. Bradley, S.P., A.C. Hax and T.L. Mananti, 1977. Applied Mathematical Programming. Addison-Wesley Company, pp: 366-394.
9. Cohon, J., 1978. Multi-objective Programming and Planning.Mathematics in Science and Engineering. Academic Press, pp: 333.
10. Schuster, E.G., L.A. Leefers and J.E. Thompson, 1993. A Guide to Computer-Based Analythical Tools for Implementing national Forest Plans. USDA Forest Service, General Technical Report INT, pp: 296-269.