www.atmos-meas-tech.net/9/6101/2016/ doi:10.5194/amt-9-6101-2016
© Author(s) 2016. CC Attribution 3.0 License.
Detection of formaldehyde emissions from an industrial zone in the
Yangtze River Delta region of China using a proton transfer
reaction ion-drift chemical ionization mass spectrometer
Yan Ma1,2, Yiwei Diao2,3, Bingjie Zhang1, Weiwei Wang3, Xinrong Ren4, Dongsen Yang1,2,3, Ming Wang1, Xiaowen Shi1,2, and Jun Zheng1,2
1School of Environmental Science and Engineering, Collaborative Innovation Center of Atmospheric Environment and Equipment Technology, Nanjing University of Information Science and Technology, Nanjing 210044, China
2Yale–NUIST Center on Atmospheric Environment, Nanjing University of Information Science & Technology, Nanjing 210044, China
3Key Laboratory for Aerosol–Cloud–Precipitation of China Meteorological Administration, Department of Atmospheric Physics, Nanjing University of Information Science and Technology, Nanjing 210044, China
4Department of Atmospheric and Oceanic Science, University of Maryland, College Park, MD 20742, USA Correspondence to:Jun Zheng ([email protected])
Received: 7 June 2016 – Published in Atmos. Meas. Tech. Discuss.: 1 August 2016
Revised: 8 November 2016 – Accepted: 28 November 2016 – Published: 21 December 2016
Abstract.A proton transfer reaction drift chemical ion-ization mass spectrometer (PTR-ID-CIMS) equipped with a hydronium (H+3O) ion source was developed and deployed near an industrial zone in the Yangtze River Delta (YRD) region of China in spring 2015 to investigate industry-related emissions of volatile organic compounds (VOCs). Air pollutants including formaldehyde (HCHO), aromatics, and other trace gases (O3 and CO) were simultaneously mea-sured. Humidity effects on the sensitivity of the PTR-ID-CIMS for HCHO detection were investigated and quantified. The performances of the PTR-ID-CIMS were also validated by intercomparing with offline HCHO measurement tech-nique using 2,4-dinitrophenylhydrazone (DNPH) cartridges and the results showed fairly good agreement (slope=0.81,
R2=0.80). The PTR-ID-CIMS detection limit of HCHO (10 s, three-duty-cycle averages) was determined to be 0.9– 2.4 (RH=1–81.5 %) parts per billion by volume (ppbv) based on 3 times the standard deviations of the background signals. During the field study, observed HCHO concentra-tions ranged between 1.8 and 12.8 ppbv with a campaign av-erage of 4.1±1.6 ppbv, which was comparable with previ-ous HCHO observations in other similar locations of China. However, HCHO diurnal profiles showed few features of sec-ondary formation. In addition, time series of both HCHO and
aromatic VOCs indicated strong influence from local emis-sions. Using a multiple linear regression fit model, on aver-age the observed HCHO can be attributed to secondary for-mation (13.8 %), background level (27.0 %), and industry-related emissions, i.e., combustion sources (43.2 %) and chemical productions (16.0 %). Moreover, within the plumes the industry-related emissions can account for up to 69.2 % of the observed HCHO. This work has provided direct evi-dence of strong primary emissions of HCHO from industry-related activities. These primary HCHO sources can poten-tially have a strong impact on local and regional air pollu-tion formapollu-tion in this area of China. Given the fact that the YRD is the largest economic zone in China and is dense with petrochemical industries, primary industrial HCHO emis-sions should be strictly monitored and regulated.
1 Introduction
typ-ical near-ground concentration ranging from sub-ppbv lev-els in the rural area to ∼60 ppbv in highly polluted regions (Finlayson-Pitts and Pitts, 1999). HCHO plays a crucial role in atmospheric photochemistry. The absorption spec-trum of HCHO extends well into the UVA region and thus its photolysis rate coefficient (Reaction R1) is one of the highest among all carbonyl compounds in the atmosphere (Gratien et al., 2007). Photolysis of HCHO (Reaction R1a) can contribute substantially to the atmospheric HOx radical
(OH+HO2) budget and thus can exert great impact on the oxidative capacity of the atmosphere (Volkamer et al., 2010). Since hydrogen (H2) is classified as an indirect greenhouse gas, the R1b channel is also of atmospheric importance and may have a non-negligible impact on global climate change (Schultz et al., 2003; Tromp et al., 2003).
HCHO+hν(λ <330 nm)→H+HCO (R1a)
HCHO+hν(λ <360 nm)→H2+CO (R1b)
HCHO is considerably water soluble. Hence, HCHO may participate in either acid or base catalyzed aldol-condensation reactions in the aerosol phase to contribute to secondary organic aerosol (SOA) formation (Wang et al., 2010). Moreover, HCHO is a known carcinogen. Exposure to HCHO vapor can cause nasal and eye irritation. Dur-ing exposure tests, breathDur-ing in as low as 100 ppbv HCHO may cause allergic reactions in certain populations (http: //www.atsdr.cdc.gov/toxfaqs/tfacts111.pdf).
In the background atmosphere, HCHO is mostly formed from photochemical oxidation of methane (CH4) and termi-nal alkenes (Finlayson-Pitts and Pitts, 1999). HCHO can also be emitted directly into the air from vegetation, although its formation mechanism is not well known (Seco et al., 2007). HCHO flux measurements conducted in forest areas indicate that both plants and the ground surface can con-tribute to assignable HCHO emissions, although the magni-tude is relatively small compared to the photochemical pro-duction (DiGangi et al., 2011). In contrast to biogenic HCHO sources, anthropogenic activities are often intense primary HCHO sources. HCHO can be produced from any incom-plete combustion processes. Vehicle exhaust is believed to be the dominant primary HCHO sources in heavily popu-lated urban areas (Anderson et al., 1996; Ho et al., 2012). Regardless of the types of fuel, all internal combustion en-gines emit considerable amounts of HCHO. Interestingly, us-age of alternative fuels can substantially reduce vehicle emis-sions of nitrogen oxides (NOx) but may significantly increase
emissions of HCHO and other carbonyl compounds (Wag-ner and Wyszynski, 1996). A recent study by Rappenglück et al. (2013) suggests that currently available mobile emission models (e.g., MOBILE6 and MOVES) may significantly un-derestimate the HCHO emissions from vehicles and there is a non-negligible difference of HCHO emissions between light-duty and heavy-light-duty diesel vehicles. Nevertheless, studies have found that vehicle exhaust alone may lead to significant
underestimation of the emission inventory of carbonyl com-pounds in Beijing (Wang et al., 2014), most likely due to the complicated but poorly understood emissions from the indus-trial sector (Chen et al., 2014). High concentrations of HCHO have been observed around the Houston Ship Channel area populated with petrochemical facilities (Rappenglück et al., 2010). Using an imaging differential optical absorption spec-trometer, Pikelnaya et al. (2013) have detected direct HCHO emission from burning flares of the refineries in Houston. In addition to flares, desulfurization and other petrochemical processes such as catalytic cracking of refinery feed may also contribute substantially to primary HCHO emissions (Ola-guer et al., 2013). Other industry-related activities, such as wood processing and manufacturing of insect and fungus products, also contribute substantial primary HCHO emis-sions (Garcia et al., 2006). Recent studies have demonstrated that primary carbonyl emissions from a remote oil and gas-production region can lead to high ozone (O3) formation in a nearby rural area (Edwards et al., 2014). Therefore, it is of practical interest to fully comprehend the detailed primary emission sources of carbonyl compounds, especially in the case of HCHO.
Various source apportionment methods have been suc-cessfully utilized to identify primary and secondary HCHO sources (Chen et al., 2014; Garcia et al., 2006; Li et al., 2014; Olaguer et al., 2013; Parrish et al., 2012; Zheng et al., 2013b). Due to the lack of carbonyl emission inventories, particu-larly in China, it is impractical to directly estimate HCHO emissions using emission factors. However, carbon monox-ide (CO), sulfur dioxmonox-ide (SO2), and toluene have been ob-served co-emitted with carbonyl compounds from industrial facilities at various locations and hence can serve as tracers of industrial HCHO emission (Pikelnaya et al., 2013; Rap-penglück et al., 2010; Wang et al., 2015); i.e., variations of these gases are linearly associated with the primary HCHO emissions. Accordingly, correlation-based methods, such as the multiple linear regression fit model, can be used to quan-tify the relative contribution of primary industrial HCHO sources (Li et al., 2014).
Quadrupole MAX1000
1000 μm pinhole
Stainless steel
TV301 TV301
IDP3 1
4"PFA tee
Sampling
flow ~340 sccm
Exhaust Agilent
CDG500 gauge Agilent
TS300
Detector
Data acqusition ~1300 V
~1V
R=1 MΩ each
R=1 MΩ
350℃ Pt catalytic converter
6 m high PFA inlet
Automatic 3-way Valve
Diaphragm pump ~10 SLPM
Calibration port
Mass flow
controller 30.0 SCCM N2
R=2 MΩ
Figure 1.Schematic diagram of the proton transfer reaction ion-drift chemical ionization mass spectrometer (PTR-ID-CIMS).
established DNPH (2,4-dinitrophenylhydrazone) technique and the contribution of industry-related activities to primary HCHO emissions was evaluated with a multiple linear re-gression fit model.
2 Experimental methods 2.1 Observation site
The measurements were carried out from 15 to 30 April 2015 on the campus of the Nanjing University of Information Sci-ence and Technology (NUIST). A detailed description of the site (32◦12′20.8′′N, 118◦42′19.2′′E) has been given in our previous work (please see Fig. 1 in Zheng et al. (2015a) for details). Briefly, the site was established by the Chinese Meteorological Administration as a training facility for me-teorological observations. Meteorology parameters, includ-ing wind direction, wind speed, ambient temperature, pres-sure, relative humidity, and solar radiation, were contin-uously measured according to Chinese national standards (GB31221-2014). The site was located in the middle of two highways, i.e., G40 and G205, which were about 1.3 km to the west and 1.5 km to the east of the site, respectively. From the aromatics measurement results, we found no substantial impacts on measured HCHO from traffic-related emissions, which will be detailed in the discussion section. When east-erly winds were dominant, the site was constantly affected by the outflow from the industry zone (Zheng et al., 2015a). All instruments were housed inside an air-conditioned trailer. The sample line was made of 6.4 mm OD PFA tubing and
was installed on the roof of the trailer, about 6 m above ground level.
2.2 PTR-ID-CIMS
100 101 102 103 104 105 106
Ion si
gna
l (CP
S)
120 110 100 90 80 70 60 50 40 30 20
m/z (amu)
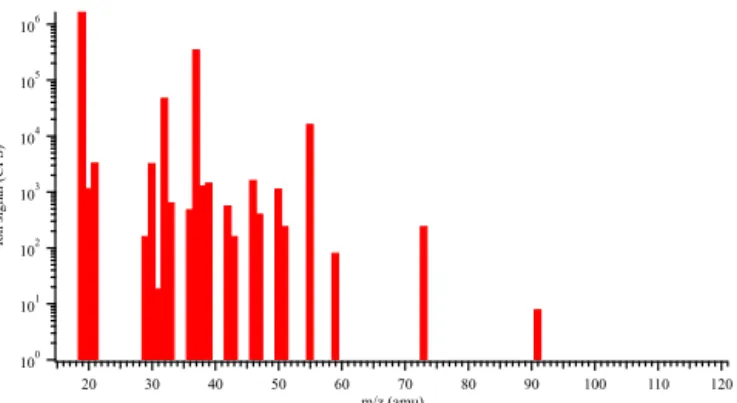
Figure 2.A typical mass spectrum produced by the PTR-ID-CIMS
in the laboratory.
108 Td (1 Td=1×10⁻¹⁷V cm2). To maintain a constant re-action temperature, the drift tube was regulated at 60◦C. A 200 µm pinhole (Edmund Optics) biased by 1 V was used to separate the drift tube from the high vacuum region that was housing the quadrupole mass analyzer and the Chan-neltron electron multiplier. The vacuum chamber was dif-ferentially pumped by two Agilent TV-301 turbomolecular pumps, which shared one Agilent IDP-3 dry scroll pump as the backing pump. Ambient air was delivered to the PTR-ID-CIMS through the 6 m long sample line and a diaphragm pump was used to pump the inlet at 10 standard L min−1 (SLPM) and thus to minimize the sample residence time no more than 1 s. The inlet was also heated to ∼60◦C to re-duce potential wall losses. Using an automatic PTFE three-way valve, background checks were conducted once every 30 min for 10 min by rerouting sample air through a 350◦C Pt catalytic converter (Zheng et al., 2013b, 2015a).
Figure 2 is a typical mass spectrum generated by the PTR-ID-CIMS after scanning the laboratory air by unit mass. Hy-dronium ion (m/z19) and its water clusters (m/z37,m/z55,
m/z 73, andm/z 91) can be observed clearly in the spec-trum and are the dominant ions. Although the oxygen ion (m/z 32) is also present, it is less than 2.5 % of the pri-mary hydronium ion (m/z 19) and thus does not interfere significantly with the PTR reactions initiated by hydronium ions. Masses 33, 42, and 59 can be respectively attributed to methanol, acetonitrile, and acetone because all of these chemicals are commonly utilized as organic solvents in the organic chemistry laboratories in our department. We want to point out that mass 33 can also originate from isotopic peak of O+2 with oxygen-17 (17OO+) and protonated oxygen (HO+2), which, however, are also present during background checks using a catalytic converter and thus both of them will be subtracted from the methanol signal. Mass 59 can also originate from propanal and glyoxal. However, since both propanal and especially glyoxal are significantly more reac-tive than acetone in the atmosphere, both of them typically contribute less than 10 % of the mass 59 signal (de Gouw and Warneke, 2007). The other peaks were most likely due
to the chemicals and their fragments originated from various chemistry experiments in the building.
In theory, the PTR-ID-CIMS worked essentially in the same way as an Ionicon PTR-MS in VOC detections. How-ever, the PTR-ID-CIMS was developed with an intention to do more than positive ion chemical ionization analysis and thus it was equipped with a bipolar ion detection system. It can be readily converted into a negative ion CIMS. With the proper ion chemistry scheme, the PTR-ID-CIMS can be used to detect not only VOCs but also ammonia (NH3) (Nowak et al., 2006), nitrous acid (HONO) (Pinto et al., 2014), and ni-tric acid (HNO3) (Zheng et al., 2008). In the future, the drift tube can also be modified to adapt an atmospheric pressure interface (API) to do sulfuric acid measurements (Zheng et al., 2010). Another significant difference between the PTR-ID-CIMS and the Ionicon PTR-MS was the inlet system. In the PTR-ID-CIMS air samples were introduced into the drift tube through a critical orifice instead of a long (> 1 m) 1.5 mm OD capillary PEEK tubing used in the Ionicon PTR-MS. We found our inlet setup had the advantages of faster time response and lower wall losses and especially suited for sticky gas measurements, such as NH3(Zheng et al., 2015a). In this work, we focus on the measurement and analysis of VOC emissions in the Yangtze River Delta (YRD) region using the PTR-ID-CIMS, especially from industry-related sources.
2.3 HCHO Measurement with PTR-ID-CIMS
The PTR-ID-CIMS was operated in the single ion monitor (SIM) mode; i.e., a series of masses were sequentially de-tected by the PTR-ID-CIMS. The QMS was set to measure each mass for 2 s and then pause for 2 s after switching to a new setting to account for the slew time of the QMS power supply. More than 40 masses were measured during each measurement cycle and it took about 3 min to finish one duty cycle. HCHO was detected atm/z 31. Because the proton affinity of HCHO is slightly higher than water, Reaction (R2) is reversible.
H+3O+HCHO↔H+HCHO+H2O (R2) Therefore, the HCHO measurement using PTR-ID-CIMS was strongly affected by the water concentration in the drift tube. This water dependency has been investigated in details previously and the sensitivity dependence on water in HCHO detection can be evaluated as the following (Inomata et al., 2008; Jobson and McCoskey, 2010; Schripp et al., 2010; Warneke et al., 2011; Wisthaler et al., 2008; Zheng et al., 2013b):
H+HCHO
=
k[HCHO]
H+3O
1−e−k
H+3O
+k′[H 2O]
t
k
H+3O
+k′[H 2O]
wherekandk′ are the forward and reverse reaction rate
co-efficients of Reaction (R2), respectively, and t is the ion– molecule reaction time. Given [H2O]≫[H+3O], Eq. (1) can be simplified and rearranged as Eq. (2):
[H+HCHO] [H+3O][HCHO]=
k(1−e−k′[H2O]t ) k′[H
2O]
. (2)
The left-hand side of the equation indicates that H+3 O-normalized H+HCHO counts rate signal (normalized counts s−1, NCPS) with respect to 1 ppbv of HCHO (NCPS ppbv−1) or that the sensitivity of the PTR-ID-CIMS to HCHO is a function of water vapor concentration inside the drift tube in the form of Warneke et al. (2011):
y=A
x(1−e
−Bx), (3)
where x is the water vapor concentration, A=k/k′, and
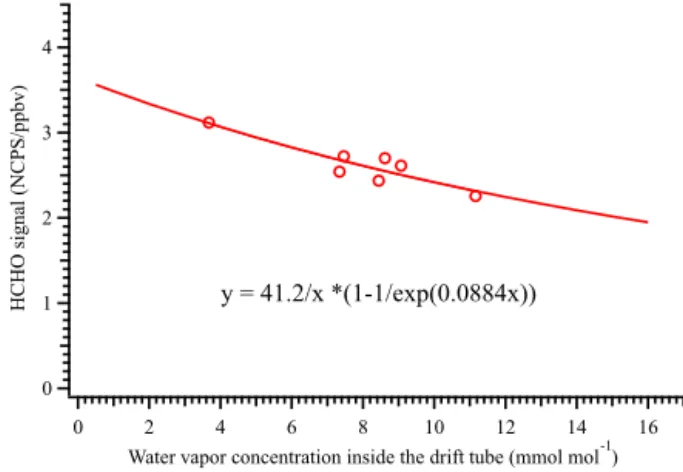
B=k′t. Therefore, the sensitivity of the PTR-ID-CIMS to HCHO at certain humidity can be evaluated according to Eq. (2) if the parametersAandBare known. Figure 3 shows a plot of the PTR-ID-CIMS response to HCHO standards un-der various ambient humidities. Each data point of Fig. 3 was the result of one set of calibration, which will be described in details in the following section. The corresponding water vapor concentration was determined from sample air humid-ity and the ion source carrier flow humidhumid-ity. The values ofA
andB were inferred from curve fitting using Eq. (3) as the fitting function. The linear correlation coefficient between the original and fitted values was determined to be 0.82. In addition, given that the reaction temperature and E / N
in this work were kept constant (i.e., 60◦C and 108 Td) and the reduced ion mobility of H+3O in air was taken as 2.76 cm2V−1s−1(de Gouw et al., 1997), the ion–molecule reaction time was determined to be about 103 µs. Accord-ingly, k andk′ of Reaction (R2) were also evaluated from
A and B with values of 0.84×10⁻⁹cm3molecule−1s−1 and 2.0×10⁻¹¹cm3molecule−1s−1, respectively. The en-ergy dependency ofkandk′has been investigated by Hansel
et al. (1997). It was demonstrated that the reverse reac-tion channel,k′, increased significantly with increasing mean relative kinetic energy (KE) of the reactants while k only showed slightly negative energy dependency. KE under the reaction conditions of this work was calculated according to the method as described by Hansel et al. (1997). The reduced ion mobility of H+HCHO in air was assumed to be similar as that of H+3OqH
2O (2.27 cm2V−1s−1) (de Gouw et al., 1997), since they have a similar molecular size. Therefore, the KEs associated with the forward and the reverse reactions were respectively determined to be 0.12 eV and 0.10 eV. The corresponding k and k′ measured by Hansel et al. (1997) were 1.4×10⁻⁹ and 1.1×10⁻¹¹cm3molecule−1s−1, re-spectively. Evidently, the inferred values from Fig. 3 agreed fairly well with the literature values.
4
3
2
1
0
H
CH
O
si
gna
l (N
CP
S
/ppbv)
16 14 12 10 8 6 4 2 0
Water vapor concentration inside the drift tube (mmol mol )-1
y = 41.2/x *(1-1/exp(0.0884x))
Figure 3. The response of the PTR-ID-CIMS to HCHO
stan-dards (in the units of counts s−1ppbv−1HCHO standard per mil-lion H+3O ion, NCPS ppbv−1) as a function of water vapor con-centration inside the drift tube. The correlation is in the form of y=Ax(1−e−Bx), deduced from Eq. (1), whereAis the ratio be-tween the forward (k) and reverse (k′) reaction rate coefficient and Bis the product ofk′and the ion–molecule reaction timet.
In Fig. 3 much less variation in instrument sensitivity was observed in this work than the previous studies (Vlasenko et al., 2010). The most likely reason is that the ion source of the PTR-ID-CIMS used humidified pure nitrogen as carrier gas. The nitrogen flow rate (30.0 SCCM) was much higher than the water vapor flow rate used by a typical Ionicon PTR-MS and more importantly all of the humidified nitro-gen was sucked into the drift tube instead of being pumped away in the case of PTR-MS. Consequently, the background water concentration in the drift tube of the PTR-ID-CIMS was significantly higher than a typical PTR-MS. As indicated by Fig. 5 of Vlasenko et al. (2010), the instrument sensitiv-ity will change substantially when the water content changes slightly from the completely dry condition. Therefore, the relatively high background water content in the PTR-ID-CIMS can lead to decreased sensitivity during “dry” calibra-tions, which can explain the much lower variation in sensi-tivity observed in this work.
2.4 PTR-ID-CIMS calibration
through the catalytic converter and its flow rate was con-trolled by a critical orifice (as shown in Fig. 1), which was precisely quantified by a Gillibrator (Sensidyne Gilian). Ul-tra pure nitrogen was also used in place of the zero air to con-duct calibrations under the dry condition. The HCHO stan-dard concentration in the cylinder was verified by the DNPH cartridge measurements with a value of 284±2 ppbv (based on three independent measurements). Background signals were checked before and after the HCHO standard additions using the catalytic converter. The PTR-ID-CIMS was also operated in the SIM mode during calibrations. Similar to the field measurement cycle, the integration time at each mass was set to 2 s and the time interval between two consecutive masses was also set to 2 s. Each calibration cycle contained 48 masses, includingm/z21 (H183 O+),m/z25 (system
back-ground),m/z30 (NO+),m/z32 (O+2),m/z37 (H3O+H2O), and other VOC standard gases. It took about 3 min to com-plete one measurement cycle. Figure 4a shows the time se-ries of a typical HCHO calibration. Since the nitrogen-15 isotopic peak of NO (15NO+) also contributes to the sig-nal atm/z 31, relatively high background signals were ob-served in Fig. 4a. In addition, because the quadrupole mass filter can normally achieve unit mass separation,m/z31 sig-nals were also slightly interfered by the tail from the rela-tively strong adjacent oxygen peak (O+2), which was about 1 to 2 % of the H+3O intensity. Although 15NO+ interfer-ence can be removed from the real HCHO signal by back-ground subtraction, to accurately reflect HCHO backback-ground signal variations, 0.37 % (Hoffmann and Stroobant, 2007) of the signal of m/z 30 (not shown in Fig. 4a) was sub-tracted from HCHO background check signals before the background noise was evaluated. Each insert in Fig. 4 is the corresponding calibration curve with background signal sub-tracted. To fully characterize the humidity effects on its per-formance, the PTR-ID-CIMS was also calibrated under vari-ous relative humidity conditions (1.0, 17.5, 29.0, 47.0, 62.5, and 81.5 %) using pure air as the carrier gas. The relative hu-midity of the VOC standards was achieved by passing the carrier gas through a water bubbler similar to the one used in Zheng et al. (2015a). Three to four consecutive calibra-tions were performed at each RH setting. The results are dis-played in Fig. 5. It is clearly shown that higher instrument sensitivity (i.e., NCPS per ppbv HCHO) is associated with lower RH setting. The instrument sensitivity and the corre-sponding detection limit (DL) (based on 3 times the stan-dard deviations of the background signals) at each RH set-ting were evaluated from each individual calibration. Fur-thermore, the instrument precision at each RH setting was assessed by the variations of both the instrument sensitivity and the DL among repeated calibrations. The results showed that on average the PTR-ID-CIMS DL of HCHO varied from 0.9 ppbv for dry condition to 2.4 ppbv for 81.5 % RH at room temperature. Among all RH settings (< 81.5 %) the variations of the instrument sensitivity and the DL were less than 17
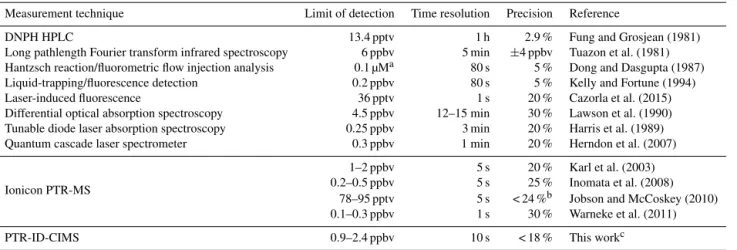
and 16 % of the average values, respectively. Therefore, for the worst case, the HCHO measurement uncertainty in this work should be < 18 %, including the 1 % uncertainty asso-ciated with the HCHO standard concentrations. The perfor-mances of various HCHO measurement techniques including this work have been listed in Table 1. Evidently, the sensitiv-ity of PTR-ID-CIMS for HCHO detection was comparable to other PTR-MS-based techniques and was fast enough to capture pollution episodes with a timescale of at least a few hours.
Calibrations of benzene (Fig. 4b) and toluene (Fig. 4c) were conducted using the VOC standard mixture simulta-neously with the HCHO calibrations. For three-duty-cycle averages, the calibration factors and detection limits were, respectively, 41.2 NCPS ppbv−1and 0.06 ppbv for benzene and 40.0 NCPS ppbv−1and 0.07 ppbv for toluene. In a simi-larly way as the case of HCHO, we determined the uncertain-ties of benzene and toluene measurements to be less than 8.7 and 11.0 % (including the 5 % uncertainty associated with the VOC standard concentration) in this work.
2.5 DNPH HCHO measurements
Carbonyls including HCHO were also measured with the DNPH method followed the US EPA method TO-11A. Car-tridges coated with DNPH (Agela Technologies, Tianjin) were used to scrub carbonyls from the ambient air samples and then analyzed by high-performance liquid chromatogra-phy (HPLC) (Waters, Alliance e2695) equipped with a Di-amonsil C-18 column (5 µm, 250 mm by 4.6 mm). The car-tridge was attached to the front end of a 6.4 mm OD PFA tubing that was bound to the inlet of the PTR-ID-CIMS. A potassium iodide (KI) cartridge was also installed in the front of the DNPH cartridge to remove ozone. Ambient air was pulled into the cartridges by a diaphragm pump and the flow rate was set to 0.53 SLPM by a critical orifice, which was cal-ibrated with the Gillibrator. The sampling time varied from 0.6 to 2 h during the campaign depending on the ambient HCHO concentrations. The sampled cartridges were stored in Teflon bags at 4◦C right after sampling. Note that a few high O3episodes were encountered during the measurement period with a maximum concentration of about 140 ppbv, which can potentially interfere with DNPH samples. How-ever, as demonstrated by the US EPA, the KI cartridges can efficiently remove 125–200 ppbv O3 from air samples for up to 100 000 ppbv h with a requirement of minimum mois-ture level of 10 % RH (https://www3.epa.gov/ttnamti1/files/ ambient/airtox/to-11ar.pdf, accessed October 2016). Given the relative high RH conditions during the campaign period, O3 should not interfere with our DNPH HCHO measure-ments.
Table 1.Performance intercomparison of various HCHO measurement techniques.
Measurement technique Limit of detection Time resolution Precision Reference
DNPH HPLC 13.4 pptv 1 h 2.9 % Fung and Grosjean (1981)
Long pathlength Fourier transform infrared spectroscopy 6 ppbv 5 min ±4 ppbv Tuazon et al. (1981) Hantzsch reaction/fluorometric flow injection analysis 0.1 µMa 80 s 5 % Dong and Dasgupta (1987)
Liquid-trapping/fluorescence detection 0.2 ppbv 80 s 5 % Kelly and Fortune (1994)
Laser-induced fluorescence 36 pptv 1 s 20 % Cazorla et al. (2015)
Differential optical absorption spectroscopy 4.5 ppbv 12–15 min 30 % Lawson et al. (1990) Tunable diode laser absorption spectroscopy 0.25 ppbv 3 min 20 % Harris et al. (1989)
Quantum cascade laser spectrometer 0.3 ppbv 1 min 20 % Herndon et al. (2007)
Ionicon PTR-MS
1–2 ppbv 5 s 20 % Karl et al. (2003)
0.2–0.5 ppbv 5 s 25 % Inomata et al. (2008) 78–95 pptv 5 s < 24 %b Jobson and McCoskey (2010) 0.1–0.3 ppbv 1 s 30 % Warneke et al. (2011)
PTR-ID-CIMS 0.9–2.4 ppbv 10 s < 18 % This workc
aAqueous sample.bBased on the uncertainty of the instrument sensitivity.cAveraged over three duty cycles.
Table 2.Parameters of the multiple linear regression fit and the linear correlation coefficient (R2) for the measured and source-apportioned HCHO in Eq. (4).β1denotes the portion of HCHO from photochemical production.β2,β3, andβ4are the emission ratios of HCHO with respect to CO, benzene, and toluene, respectively.β5represents HCHO concentration in the background atmosphere.
β1(ppbv ppbv−1) β2(ppbv ppbv−1) β3(ppbv ppbv−1) β4(ppbv ppbv−1) β5(ppbv) R2 0.0118±0.0012 0.00116±0.000055 0.218±0.014 0.196±0.016 1.00±0.10 0.52
for analysis. Acetonitrile–water solution (40–60 %) was used as a gradient mobile phase and the flow rate was set to 1.2 mL min−1. Separated carbonyls were detected by its absorption at 360 nm by a UV detector (Waters 2998). Calibration was conducted with standard solution (Supelco, USA) containing 15 DNPH derivatives of car-bonyls, including formaldehyde, acetaldehyde, acrolein, ace-tone, propionaldehyde, crotonaldehyde, butyraldehyde, ben-zaldehyde, isovaleraldehyde, valeraldehyde, o-tolualdehyde, m-tolualdehyde, p-tolualdehyde, hexanaldehyde, and 2,5-dimethylbenzaldehyde. The dynamic range of a five-point calibration of HCHO spanned from 0.05 to 1.0 µg mL−1with a linear correlation coefficient of 0.9998. For a 2 h sam-pling time, the DL of HCHO was 0.00037 µg mL−1, cor-responding to 25 parts trillion−1volume−1 (pptv) at 25◦C, 1.01×10⁵Pa. The uncertainty of the DNPH method de-termined from three independent calibrations was less than 3.6 %.
2.6 Other trace gas measurements
CO (Thermo Scientific, model 48i) and O3(Thermo Scien-tific, model 49i) were also measured at the site. Their opera-tion and calibraopera-tion procedures followed the manufacturer’s instructions and have been detailed in previous work (Zheng et al., 2015a).
3 Results and discussion 3.1 Overall observation results
Meteorological parameters including wind direction and wind speed, relative humidity (RH) and ambient temperature (T), and solar radiation are shown in Fig. 6a–c. During the observation period, the weather was mostly clear with occa-sional precipitation events on 18, 19, 27, and 28 April. RH andT showed typical anticorrelation in their diurnal varia-tions. No gusty wind was experienced during the observation period and the average wind speed was∼2.1 m s−1.
300 250 200 150 100 50 0 m /z 31 (N CP S ) 40 30 20 10 0
Measurement cycle no.
(a) 300 200 100 0 N CP S 80 60 40 20 0 Formaldehyde (ppbv)
y = 3.1x + 23
R2 = 0.998
2500 2000 1500 1000 500 0 m /z 79 (N CP S ) 40 30 20 10 0
Measurement cycle no.
(b) 3000 2000 1000 0 N CP S 60 40 20 0 Benzene (ppbv)
y = 41.3x - 42 R2 = 0.98
2000 1500 1000 500 0 m /z 93 (N CP S ) 40 30 20 10 0
Measurement cycle no.
(c) 2000 1500 1000 500 0 N CP S 50 40 30 20 10 0 Toluene (ppbv) y = 40.0x - 1.9
R2 = 0.997
Figure 4.Time series of a typical set of calibration of HCHO(a), benzene(b), and toluene(c). The insert in each panel is the calibra-tion curve obtained from the corresponding calibracalibra-tion data.
be found within individual plumes, which strongly suggests that primary emissions were responsible for the observed high concentrations of HCHO. In addition, all heavy pollu-tion episodes observed in this campaign were associated with
100 50 0 m 31 si gna l (N CP S) 30 25 20 15 10 5 0 HCHO (ppbv) RH = 1.0 %
RH = 17.5 % RH = 29.0 % RH = 47.0 % RH = 62.5 % RH = 81.5 %
Figure 5.HCHO calibrations conducted at RH=1–81.5 %. Three
or four repeated calibrations were performed at each RH setting. The averaged background signals have been subtracted from all cal-ibration data sets. The linear fitting lines are based on the average of each group of calibrations at one RH setting and the corresponding error bars represent 1 standard deviation of each group of calibra-tions.
easterly wind, which can be demonstrated by the rose plots of HCHO, CO, benzene, toluene, and O3in Fig. 7.
16
12
8
4
0
H
CH
O
(ppbv)
4/15/15 4/17/15 4/19/15 4/21/15 4/23/15 4/25/15 4/27/15 4/29/15 5/1/15 Beijing time
120 80 40 0 O3
(ppbv)
6000 4000 2000 0
CO
(ppbv)
30
20
10
0
C6 H6
(ppbv)
30
20
10
0
C
7H 8 (ppbv)
C6H6
C7H8
(e)
O3
CO
PTR-ID-CIMS
DNPH
(d)
(f) 100
75 50 25 0
RH
(%)
4/15/15 4/17/15 4/19/15 4/21/15 4/23/15 4/25/15 4/27/15 4/29/15 5/1/15 dat
25
0
T
(°
C)
300
0
W
D
(º
) 10
0
WS
(m
s
-1
)
800 400 0
Ra
d
(W
m
-2 )
(a)
(b)
(c)
Figure 6.Time series of meteorological parameters (wind, RH,T, and solar radiation) (a,bandc), trace gases (O3and CO)(d), benzene (C6H6) and toluene (C7H8)(e), and HCHO(f). The black dots in(e)are DNPH cartridge measurements of HCHO.
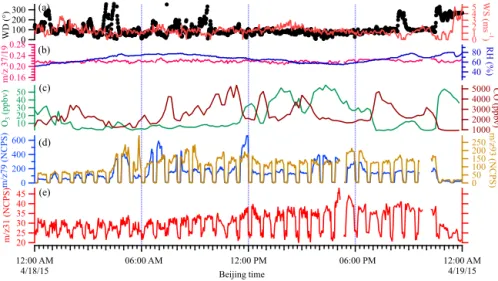
3.2 A case study
To illustrate the performance of the PTR-ID-CIMS in more details and to establish a clear connection between VOC plumes and primary industrial emissions, we chose the mea-surements on 18 April for a case study. On 18 April, it was mostly cloudy with scattered light rain. Therefore, secondary formation of HCHO was substantially suppressed. Fig-ure 8 displays the wind direction and wind speed (Fig. 8a),
m/z37/19 and RH (Fig. 8b), O3and CO (Fig. 8c),m/z79 and m/z 93 in NCPS (Fig. 8d), and m/z 31 in NCPS (Fig. 8e). It is evident that all air pollutants shown in Fig. 8 were substantially elevated in the plume but exhibit differ-ent variation profiles with periods significantly longer than the measurement duty cycle (about 3 min). These fine struc-tures in pollutant time-series indicate that these species were originated from the same area but might be associated with different industrial activities.
It is evident that humidity inside the PTR-ID-CIMS did not change significantly during background checks. Fig-ure 8d and 8e are the time series of m/z 31,m/z 79, and
m/z93 raw data. The background signals ofm/z31 appear to be independent of ambient RH. We also want to point out that there is a significant difference between this work and that of Warneke et al. (2011). Warneke et al. (2011) con-ducted an airborne measurement of HCHO. Their PTR-MS would experience rapid humidity and pressure changes when the flight altitude changed from ground level to the free tro-posphere as shown in their Fig. 3c. The diurnal variation of
m/z 37/19 in this work was about 0.2 to 0.24 and no
sig-nificant background changes were observed, which is con-sistent with the results of Fig. 3c in Warneke et al. (2011). From 10:00 LT on 18 April, there was a persistent easterly wind with wind speed varying within a few meters per sec-ond. Meanwhile, significant increase of HCHO was observed at the site. In particular, after 19:00 LT HCHO apparently an-ticorrelated with wind speed. At about 23:00 LT wind direc-tion suddenly switched to westerly wind and wind speed in-creased to 3–5 m s−1, bringing in cleaner air masses to the site. HCHO suddenly decreased to 2 ppbv. This observation was also consistent with the rose plots in Fig. 7. Evidently, HCHO observed on the night of 18 April can only be ex-plained by primary sources other than automobile emissions. 3.3 Intercomparison with DNPH cartridge
measurements
measure-0 2.5 5 7.5 10 12.5
2.5 5 7.5 10 12.5 0 30 60 90 120 150 180 210 240 270 300 330 HCHO (ppbv) 0–1 1–2 2–4 4–6 6–8 8–10 10+ 0 3 6 9 12 15 18
3 6 9 12 15 18 0 30 60 90 120 150 180 210 240 270 300 330 CO (ppbv) 0–500 500–500 500–1000 1000–1500 1500–2000 2000–2500 2500–3000 3000+ 0 2.5 5 7.5 10 12.5
2.5 5 7.5 10 12.5 0 30 60 90 120 150 180 210 240 270 300 330 Benzene (ppbv) 0–2 2–4 4–6 6–8 8–10 10–12 12+ 0 3 6 9 12 15
3 6 9 12 15 0 30 60 90 120 150 180 210 240 270 300 330 Toluene (ppbv) 0–2 2–4 4–6 6–8 8–10 10+ 0 3 6 9 12 15 18
3 6 9 12 15 18 0 30 60 90 120 150 180 210 240 270 300 330
O3 (ppbv) 0–30 30–60 60–90 90–120 120+
Figure 7.Rose plots of HCHO, CO, benzene, toluene, and O3. The radius represents the percentage of each air pollutant within a certain mixing ratio range. The spread angle denotes the wind direction.
ments was within 3.6 %. Therefore, it is reasonable to believe that the observed discrepancy between these two data sets can be explained by the combined measurement uncertain-ties and the higher background level in the PTR-ID-CIMS measurements.
3.4 Determination of industrial emissions
As the observation site is located less than 10 km away from the east of an industrial zone, the site was constantly expe-riencing plumes originated from various industrial activities, such as crude oil refining, plastic and rubber syntheses, and pesticide productions. Since benzene, toluene, and other aro-matics are heavily used in many chemical syntheses, ben-zene and toluene are mass produced in the industrial zone by both catalytic cracking of petroleum fractions and coal car-bonization. It is clearly shown in Fig. 8d that toluene and ben-zene peaks often did not concur simultaneously, indicating that they were emitted from different facilities. This is also
45 40 35 30 25 20
m
/z
31 (N
CP
S
)
12:00 AM 4/18/15
06:00 AM 12:00 PM 06:00 PM 12:00 AM
4/19/15 Beijing time
0.28 0.24 0.20 0.16
m
/z
37/
19 80
60 40
RH
(%)
300 200 100 0
W
D
(°
) 54
3 2 1 0
W
S
(m
s
-1
)
600
400
200
0
m
/z
79 (N
CP
S
)
250 200 150 100 50 0
m
/z
93 (N
CP
S
)
50 40 30 20 10 O3
(ppbv)
5000 4000 3000 2000 1000
CO
(ppbv)
(a)
(b)
(c)
(d)
(e)
Figure 8.Time series of wind direction (WD) and wind speed (WS)(a),m/z37/19 ratio and RH(b), O3and CO(c),m/z79 andm/z93(d), andm/z31 signal(e)on 18 April 2015. The dips in(d)and(e)are the periods when background checks were made.
10
8
6
4
2
0
P
T
R-ID
-CIM
S
H
CH
O
(ppbv)
10 8 6 4 2 0
DNPH HCHO (ppbv) y = 0.81x + 0.66
R2 = 0.80
Figure 9. Linear correlation between PTR-ID-CIMS and DNPH
measurements of HCHO. The blue trace represents the 1 : 1 guide-line. The black solid line is the linear fit based on orthogonal dis-tance regression. The dashed line and the dot-dashed line denote the 95 % confidence interval band and the 95 % prediction band, respectively. The error bars indicate 1 standard deviation of PTR-ID-CIMS data within the corresponding DNPH sample collection time.
co-emitted from the industrial zone, although they may be originated from different industrial processes and transport-related activities, such as the heavy-duty trucks operating in the vicinity of the industrial zone. Thus both benzene and toluene were selected as tracers of petrochemical-industry-related sources and CO was selected as the tracer of any com-bustion processes including flares and vehicle exhaust. Since O3was from secondary formation, O3was used to represent secondary HCHO. Accordingly, the observed HCHO was
ap-portioned by a multiple linear regression fit model (Eq. 4):
CHCHO=β1×CO3+β2×CCO+β3×CBenzene
+β4×CToluene+β5, (4)
where CHCHO, CCO, CBenzene, and CToluene are measured mixing ratios of HCHO, O3, CO, benzene, and toluene, re-spectively.β1,β2,β3,β4, andβ5 are coefficients obtained from the multiple linear regression fit.β1 denotes the por-tion of HCHO from photochemical producpor-tion.β2,β3, and
sub-14
12
10
8
6
4
2
0
H
CH
O
(ppbv)
4/15/15 4/17/15 4/19/15 4/21/15 4/23/15 4/25/15 4/27/15 4/29/15 5/1/15 Beijing time
HCHO_O3
HCHO_CO HCHO_Benzene HCHO_Toluene HCHO_BG HCHO_Measured
Figure 10.Comparisons of the measured HCHO and source-apportioned HCHO from the multiple linear regression fit. Measured HCHO is denoted by black dots and contributions from different sources are shown as color-coded bars.
12
10
8
6
4
2
0
M
ea
sure
d H
CH
O
(ppbv)
12 10 8 6 4 2 0
Modeled HCHO (ppbv)
y = 0.88x + 0.63 R2 = 0.52
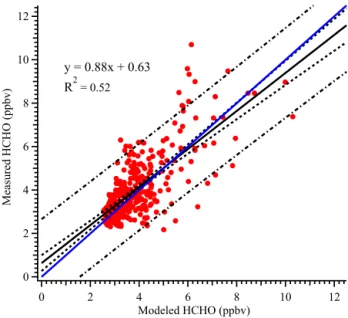
Figure 11.Linear correlation between the approximated and mea-sured HCHO concentrations. Both data sets are synchronized into 1 h temporal resolutions. The blue trace represents the 1 : 1 guide-line. The black solid line is the linear fit based on orthogonal dis-tance regression. The dashed line and the dot-dashed line denote the 95 % confidence interval band and the 95 % prediction band, respectively.
stantially and remained the dominant terms. Since 1.00 ppbv HCHO background level was supported by previous work (Wang et al., 2015), we thus preferred 1.00 ppbv as the con-strained background level.
The fitting results are listed in Table 2. The source-apportioned and measured HCHO time series are shown in Fig. 10. In general, the approximated results can
cap-ture the trends of measured HCHO profiles fairly well, es-pecially during the pollution episodes. A linear regression fit (Fig. 11) between approximated and measured HCHO shows reasonable agreement with a slope of 0.88 andR2of 0.52. Based on a Studentt test, the measured and approxi-mated HCHO values are not significantly different from each other (pvalue=0.15) at a 0.05 significance level. The rela-tive contributions of different sources to ambient HCHO are also tabulated in Table 3. Throughout the campaign period, secondary formation accounted for the smallest portion of the observed HCHO regardless within or out of the pollu-tion episodes. The contribupollu-tion associated with background level of HCHO accounted for about 22 to 29 % of the to-tal HCHO. CO, benzene, and toluene represented various industry-related activities, such as oil refineries, petrochem-ical syntheses, power generations, flares, and transportation, which overall contributed substantially (59.2 %) to the total HCHO budget; this portion reaches 69.2 % when only pol-lution episodes are considered. The possible reason was that the observation site in this work was in the vicinity of the primary emission sources, which constantly emitted a large quantity of HCHO into the air. These sources were so strong that they can dominate the local photochemical production of HCHO and suppress the typical diurnal variations of HCHO. In theory, CO and aromatics also represented industry-related vehicle emissions in this work, which may account for a sig-nificant portion of the vehicle fleet emission in the studied area. However, to specify the portion of vehicles emission cannot be achieved by the current available tracers. The pos-itive correlations between HCHO and these aforementioned air pollutants established a statistical link between HCHO and industrial activities. The relatively weak correlation of
petro-Table 3.Relative contributions (%) of different sources to the observed HCHO calculated using the multiple linear regression model. Pollu-tion episodes are defined as periods when HCHO concentraPollu-tion was higher than the campaign average, i.e., 4.1 ppbv.
Industry-related emission
Secondary (O3) CO Benzene Toluene Sum of industrial emission Background Campaign
13.8 % 43.2 % 9.4 % 6.6 % 59.2 % 27.0 %
average Pollution
8.8 % 42.5 % 15.1 % 11.6 % 69.2 % 22.0 %
episodes Non-pollution
16.1 % 43.6 % 6.7 % 4.3 % 54.6 % 29.3 %
period
chemical industry. Many organic synthesis processes may also lead to HCHO emissions. These tracers used in this work may not represent all processes that contributed to HCHO emissions. More studies are needed to further investigate the potential primary sources of HCHO in the industrial zone and to fully characterize industrial VOCs emissions.
4 Conclusions
High concentrations of HCHO were observed using a custom-built PTR-ID-CIMS at a suburban site in Nanjing, China, near an industrial zone, typical in the YRD region. The humidity dependency of the PTR-ID-CIMS sensitiv-ity to HCHO was evaluated by systematic calibrations. The PTR-ID-CIMS measurement of HCHO was verified by the US EPA recommended offline DNPH method (TO-11A). Within the observation period, HCHO ranged between 1.8 and 12.8 ppbv with a campaign average of 4.1±1.6 ppbv, which was comparable with previous HCHO observations in other similar locations. Temporal variations of HCHO showed no clear correlation with O3, indicating the presence of strong primary point sources of HCHO. All high HCHO episodes observed in this study were associated with air masses originated from the east of the observation site where the industry zone is located and populated with heavy indus-trial facilities especially petrochemical-related manufactur-ers. Furthermore, other primary air pollutants including CO, benzene, and toluene were simultaneously measured within the plumes and showed significant correlations with HCHO. Benzene, toluene, and other aromatics were commonly used and mass produced in petrochemical industries (such as cat-alytic cracking of petroleum fractions and coal carboniza-tion) and hence were excellent tracers of petrochemical pro-cesses. Both CO and HCHO can be produced during incom-plete combustions, such as flares and vehicle exhaust, and thus CO can be considered a tracer of any combustion pro-cesses. However, the benzene to toluene ratio was found sig-nificantly higher than 0.5 in this work, indicating that vehicle exhaust may not be a major contributor to HCHO. Using O3, CO, benzene, and toluene as tracers, a multiple linear
regres-sion analysis revealed that secondary formation, industry-related activities (flares, various petrochemical productions, and transportation), and the background atmosphere respec-tively contributed 13.8, 59.2, and 27.0 % to the observed HCHO. Moreover, within the plumes the portion of industry-related emissions can account for up to 69.2 % of the ob-served HCHO. This work has provided direct evidence of strong primary emissions of HCHO from industry-related ac-tivities in China. These primary HCHO sources can poten-tially have strong impact on local and regional air pollution formation. Given the fact that the YRD region is the largest economic zone in China and is dense with petrochemical in-dustries, primary industrial HCHO emissions should be fully investigated in this area. HCHO emission ratios associated with individual sources are especially needed.
5 Data availability
The PTR-ID-CIMS data used in this work are available from the authors upon request ([email protected]).
Acknowledgements. This work was supported by the National Natural Science Foundation of China (grant no. 41275142, 21377059, 41675126, and 41575122), National Key Research and Development Project (2016YFC0202400), and Jiangsu Provincial Specially Appointed Professors Foundation.
Edited by: A. Zahn
Reviewed by: two anonymous referees
References
Anderson, L. G., Lanning, J. A., Barrell, R., Miyagishima, J., Jones, R. H., and Wolfe, P.: Sources and sinks of formaldehyde and acetaldehyde: An analysis of Denver’s ambient concentra-tion data, Atmos. Environ., 30, 2113–2123, doi:10.1016/1352-2310(95)00175-1, 1996.
fluores-cence instrument for in situ detection of formaldehyde through-out the troposphere and lower stratosphere, Atmos. Meas. Tech., 8, 541–552, doi:10.5194/amt-8-541-2015, 2015.
Chen, W. T., Shao, M., Lu, S. H., Wang, M., Zeng, L. M., Yuan, B., and Liu, Y.: Understanding primary and secondary sources of ambient carbonyl compounds in Beijing using the PMF model, Atmos. Chem. Phys., 14, 3047–3062, doi:10.5194/acp-14-3047-2014, 2014.
Dasgupta, P. K., Li, J. Z., Zhang, G. F., Luke, W. T., McClenny, W. A., Stutz, J., and Fried, A.: Summertime ambient formalde-hyde in five US metropolitan areas: Nashville, Atlanta, Houston, Philadelphia, and Tampa, Environ. Sci. Technol., 39, 4767–4783, doi:10.1021/es048327d, 2005.
de Gouw, J. and Warneke, C.: Measurements of volatile organic compounds in the Earth’s atmosphere using proton-transfer-reaction mass spectrometry, Mass Spectrom. Rev., 26, 223–257, 2007.
de Gouw, J. A., Krishnamurthy, M., Bierbaum, V. M., and Leone, S. R.: Measured and calculated mobilities of cluster ions drifting in helium and in nitrogen, Int. J. Mass Spectrom., 167, 281–289, 1997.
DiGangi, J. P., Boyle, E. S., Karl, T., Harley, P., Turnipseed, A., Kim, S., Cantrell, C., Maudlin, R. L., Zheng, W., Flocke, F., Hall, S. R., Ullmann, K., Nakashima, Y., Paul, J. B., Wolfe, G. M., Desai, A. R., Kajii, Y., Guenther, A., and Keutsch, F. N.: First direct measurements of formaldehyde flux via eddy covari-ance: implications for missing in-canopy formaldehyde sources, Atmos. Chem. Phys., 11, 10565–10578, doi:10.5194/acp-11-10565-2011, 2011.
Dong, S. and Dasgupta, P. K.: Fast fluorometric flow injection anal-ysis of formaldehyde in atmospheric water, Environ. Sci. Tech-nol., 21, 581–588, doi:10.1021/es00160a009, 1987.
Edwards, P. M., Brown, S. S., Roberts, J. M., Ahmadov, R., Banta, R. M., deGouw, J. A., Dube, W. P., Field, R. A., Flynn, J. H., Gilman, J. B., Graus, M., Helmig, D., Koss, A., Langford, A. O., Lefer, B. L., Lerner, B. M., Li, R., Li, S.-M., McKeen, S. A., Murphy, S. M., Parrish, D. D., Senff, C. J., Soltis, J., Stutz, J., Sweeney, C., Thompson, C. R., Trainer, M. K., Tsai, C., Veres, P. R., Washenfelder, R. A., Warneke, C., Wild, R. J., Young, C. J., Yuan, B., and Zamora, R.: High winter ozone pollution from carbonyl photolysis in an oil and gas basin, Nature, 514, 351– 354, doi:10.1038/nature13767, 2014.
Finlayson-Pitts, B. J. and Pitts, J. N.: Chemistry of the upper and lower atmosphere: theory, experiments and applications, Aca-demic Press, San Diego, California, xxii, 969 pp., 1999. Fortner, E. C., Zhao, J., and Zhang, R. Y.: Development of ion
drift-chemical ionization mass spectrometry, Anal. Chem., 76, 5436– 5440, doi:10.1021/Ac0493222, 2004.
Fung, K. and Grosjean, D.: Determination of nanogram amounts of carbonyls as 2,4-dinitrophenylhydrazones by high-performance liquid chromatography, Anal. Chem., 53, 168–171, doi:10.1021/ac00225a009, 1981.
Garcia, A. R., Volkamer, R., Molina, L. T., Molina, M. J., Samuel-son, J., Mellqvist, J., Galle, B., Herndon, S. C., and Kolb, C. E.: Separation of emitted and photochemical formaldehyde in Mex-ico City using a statistical analysis and a new pair of gas-phase tracers, Atmos. Chem. Phys., 6, 4545–4557, doi:10.5194/acp-6-4545-2006, 2006.
Gilpin, T., Apel, E., Fried, A., Wert, B., Calvert, J., Zhang, G. F., Dasgupta, P., Harder, J. W., Heikes, B., Hopkins, B., Westberg, H., Kleindienst, T., Lee, Y. N., Zhou, X. L., Lonneman, W., and Sewell, S.: Intercomparison of six ambient [CH2O] measure-ment techniques, J. Geophys. Res.-Atmos., 102, 21161–21188, doi:10.1029/97jd01314, 1997.
Gratien, A., Nilsson, E., Doussin, J. F., Johnson, M. S., Nielsen, C. J., Stenstrom, Y., and Picquet-Varrault, B.: UV and IR absorption cross-sections of HCHO, HCDO, and DCDO, J. Phys. Chem. A, 111, 11506–11513, doi:10.1021/jp074288r, 2007.
Hansel, A., Jordan, A., Holzinger, R., Prazeller, P., Vogel, W., and Lindinger, W.: Prottransfer reaction mass-spectrometry – on-line trace gas-analysis at the ppb level, Int. J. Mass Spectrom., 149, 609–619, 1995.
Hansel, A., Singer, W., Wisthaler, A., Schwarzmann, M., and Lindinger, W.: Energy dependencies of the proton transfer reactions H3O++CH2O↔CH2OH++H2O∗, Int. J. Mass Spectrom., 167, 697–703, doi:10.1016/s0168-1176(97)00128-6, 1997.
Harris, G. W., Mackay, G. I., Iguchi, T., Mayne, L. K., and Schiff, H. I.: Measurements of formaldehyde in the troposphere by tunable diode laser absorption spectroscopy, J. Atmos. Chem., 8, 119– 137, doi:10.1007/bf00053718, 1989.
Herndon, S. C., Zahniser, M. S., Nelson, D. D., Shorter, J., Mc-Manus, J. B., Jiménez, R., Warneke, C., and de Gouw, J. A.: Airborne measurements of HCHO and HCOOH during the New England Air Quality Study 2004 using a pulsed quantum cas-cade laser spectrometer, J. Geophys. Res.-Atmos., 112, D10S03, doi:10.1029/2006JD007600, 2007.
Ho, S. S. H., Ho, K. F., Lee, S. C., Cheng, Y., Yu, J. Z., Lam, K. M., Feng, N. S. Y., and Huang, Y.: Carbonyl emissions from vehic-ular exhausts sources in Hong Kong, J. Air Waste Manage., 62, 221–234, doi:10.1080/10473289.2011.642952, 2012.
Hoffmann, E. D. and Stroobant, V.: Mass Spectrometry – Principles and Applications, third edition ed., John Wiley & Sons, Ltd, 457– 466, 2007.
Hoque, R. R., Khillare, P. S., Agarwal, T., Shridhar, V., and Bal-achandran, S.: Spatial and temporal variation of BTEX in the ur-ban atmosphere of Delhi, India, Sci. Total Environ., 392, 30–40, doi:10.1016/j.scitotenv.2007.08.036, 2008.
Inomata, S., Tanimoto, H., Kameyama, S., Tsunogai, U., Irie, H., Kanaya, Y., and Wang, Z.: Technical Note: Determination of formaldehyde mixing ratios in air with PTR-MS: laboratory ex-periments and field measurements, Atmos. Chem. Phys., 8, 273– 284, doi:10.5194/acp-8-273-2008, 2008.
Jobson, B. T. and McCoskey, J. K.: Sample drying to im-prove HCHO measurements by PTR-MS instruments: laboratory and field measurements, Atmos. Chem. Phys., 10, 1821–1835, doi:10.5194/acp-10-1821-2010, 2010.
Karl, T., Jobson, T., Kuster, W. C., Williams, E., Stutz, J., Shetter, R., Hall, S. R., Goldan, P., Fehsenfeld, F., and Lindinger, W.: Use of proton-transfer-reaction mass spectrometry to character-ize volatile organic compound sources at the La Porte super site during the Texas Air Quality Study 2000, J. Geophys. Res. At-mos., 108, 4508, doi:10.1029/2002JD003333, 2003.
Lawson, D. R., Biermann, H. W., Tuazon, E. C., Winer, A. M., Mackay, G. I., Schiff, H. I., Kok, G. L., Dasgupta, P. K., and Fung, K.: Formaldehyde Measurement Methods Evaluation and Ambient Concentrations During the Carbonaceous Species Methods Comparison Study, Aerosol Sci. Technol., 12, 64–76, doi:10.1080/02786829008959326, 1990.
Lei, W., Zavala, M., de Foy, B., Volkamer, R., Molina, M. J., and Molina, L. T.: Impact of primary formaldehyde on air pollution in the Mexico City Metropolitan Area, Atmos. Chem. Phys., 9, 2607–2618, doi:10.5194/acp-9-2607-2009, 2009.
Li, J. Z., Dasgupta, P. K., and Luke, W.: Measurement of gaseous and aqueous trace formaldehyde – Revisiting the pentanedione reaction and field applications, Anal. Chim. Acta, 531, 51–68, doi:10.1016/j.aca.2004.09.087, 2005.
Li, M., Shao, M., Li, L. Y., Lu, S. H., Chen, W. T., and Wang, C.: Quantifying the ambient formaldehyde sources utilizing tracers, Chin. Chem. Lett., 25, 1489–1491, doi:10.1016/j.cclet.2014.07.001, 2014.
Nowak, J. B., Huey, L. G., Russell, A. G., Tian, D., Neuman, J. A., Orsini, D., Sjostedt, S. J., Sullivan, A. P., Tanner, D. J., We-ber, R. J., Nenes, A., Edgerton, E., and Fehsenfeld, F. C.: Anal-ysis of urban gas phase ammonia measurements from the 2002 Atlanta Aerosol Nucleation and Real-Time Characterization Ex-periment (ANARChE), J. Geophys. Res. Atmos., 111, D17308, doi:10.1029/2006JD007113, 2006.
Olaguer, E. P., Herndon, S. C., Buzcu-Guven, B., Kolb, C. E., Brown, M. J., and Cuclis, A. E.: Attribution of pri-mary formaldehyde and sulfur dioxide at Texas City during SHARP/formaldehyde and olefins from large industrial releases (FLAIR) using an adjoint chemistry transport model, J. Geophys. Res. Atmos., 118, 11317–11326, doi:10.1002/jgrd.50794, 2013. Parrish, D. D., Ryerson, T. B., Mellqvist, J., Johansson, J., Fried, A., Richter, D., Walega, J. G., Washenfelder, R. A., de Gouw, J. A., Peischl, J., Aikin, K. C., McKeen, S. A., Frost, G. J., Fehsen-feld, F. C., and Herndon, S. C.: Primary and secondary sources of formaldehyde in urban atmospheres: Houston Texas region, Atmos. Chem. Phys., 12, 3273–3288, doi:10.5194/acp-12-3273-2012, 2012.
Pikelnaya, O., Flynn, J. H., Tsai, C., and Stutz, J.: Imaging DOAS detection of primary formaldehyde and sulfur dioxide emissions from petrochemical flares, J. Geophys. Res. Atmos., 118, 8716– 8728, doi:10.1002/jgrd.50643, 2013.
Pinto, J. P., Dibb, J., Lee, B. H., Rappenglück, B., Wood, E. C., Levy, M., Zhang, R. Y., Lefer, B., Ren, X. R., Stutz, J., Tsai, C., Ackermann, L., Golovko, J., Herndon, S. C., Oakes, M., Meng, Q. Y., Munger, J. W., Zahniser, M., and Zheng, J.: Intercompar-ison of field measurements of nitrous acid (HONO) during the SHARP campaign, J. Geophys. Res. Atmos., 119, 5583–5601, doi:10.1002/2013JD020287, 2014.
Rappenglück, B., Dasgupta, P. K., Leuchner, M., Li, Q., and Luke, W.: Formaldehyde and its relation to CO, PAN, and SO2 in the Houston-Galveston airshed, Atmos. Chem. Phys., 10, 2413– 2424, doi:10.5194/acp-10-2413-2010, 2010.
Rappenglück, B., Lubertino, G., Alvarez, S., Golovko, J., Czader, B., and Ackermann, L.: Radical precursors and re-lated species from traffic as observed and modeled at an ur-ban highway junction, J. Air Waste Manage., 63, 1270–1286, doi:10.1080/10962247.2013.822438, 2013.
Schripp, T., Fauck, C., and Salthammer, T.: Interferences in the determination of formaldehyde via PTR-MS: What do we learn from m/z 31?, Int. J. Mass Spectrom., 289, 170–172, doi:10.1016/j.ijms.2009.11.001, 2010.
Schultz, M. G., Diehl, T., Brasseur, G. P., and Zittel, W.: Air pollu-tion and climate-forcing impacts of a global hydrogen economy, Science, 302, 624–627, doi:10.1126/science.1089527, 2003. Seco, R., Penuelas, J., and Filella, I.: Short-chain oxygenated
VOCs: Emission and uptake by plants and atmospheric sources, sinks, and concentrations, Atmos. Environ., 41, 2477–2499, doi:10.1016/j.atmosenv.2006.11.029, 2007.
Tromp, T. K., Shia, R.-L., Allen, M., Eiler, J. M., and Yung, Y. L.: Potential environmental impact of a hydro-gen economy on the stratosphere, Science, 300, 1740–1742, doi:10.1126/science.1085169, 2003.
Tuazon, E. C., Winer, A. M., and Pitts, J. N.: Trace pollutant concentrations in a multiday smog episode in the California South Coast Air Basin by long path length Fourier transform infrared spectroscopy, Environ. Sci. Technol., 15, 1232–1237, doi:10.1021/es00092a014, 1981.
Vlasenko, A., Macdonald, A. M., Sjostedt, S. J., and Abbatt, J. P. D.: Formaldehyde measurements by Proton transfer reaction – Mass Spectrometry (PTR-MS): correction for humidity effects, At-mos. Meas. Tech., 3, 1055–1062, doi:10.5194/amt-3-1055-2010, 2010.
Volkamer, R., Sheehy, P., Molina, L. T., and Molina, M. J.: Oxida-tive capacity of the Mexico City atmosphere – Part 1: A rad-ical source perspective, Atmos. Chem. Phys., 10, 6969–6991, doi:10.5194/acp-10-6969-2010, 2010.
Wagner, T. and Wyszynski, M. L.: Aldehydes and ketones in engine exhaust emissions – A review, P. I. Mech. Eng. D-J. Aut., 210, 109–122, doi:10.1243/pime_proc_1996_210_252_02, 1996. Wang, L., Khalizov, A. F., Zheng, J., Xu, W., Ma, Y., Lal, V.,
and Zhang, R.: Atmospheric nanoparticles formed from het-erogeneous reactions of organics, Nat. Geosci., 3, 238–242, doi:10.1038/ngeo778, 2010.
Wang, M., Shao, M., Chen, W., Yuan, B., Lu, S., Zhang, Q., Zeng, L., and Wang, Q.: A temporally and spatially resolved validation of emission inventories by measurements of ambient volatile or-ganic compounds in Beijing, China, Atmos. Chem. Phys., 14, 5871–5891, doi:10.5194/acp-14-5871-2014, 2014.
Wang, M., Chen, W. T., Shao, M., Lu, S. H., Zeng, L. M., and Hu, M.: Investigation of carbonyl compound sources at a rural site in the Yangtze River Delta region of China, J. Environ. Sci.-China, 28, 128–136, doi:10.1016/j.jes.2014.12.001, 2015.
Warneke, C., Veres, P., Holloway, J. S., Stutz, J., Tsai, C., Alvarez, S., Rappenglueck, B., Fehsenfeld, F. C., Graus, M., Gilman, J. B., and de Gouw, J. A.: Airborne formaldehyde measure-ments using PTR-MS: calibration, humidity dependence, inter-comparison and initial results, Atmos. Meas. Tech., 4, 2345– 2358, doi:10.5194/amt-4-2345-2011, 2011.
Wisthaler, A., Apel, E. C., Bossmeyer, J., Hansel, A., Junkermann, W., Koppmann, R., Meier, R., Muller, K., Solomon, S. J., Stein-brecher, R., Tillmann, R., and Brauers, T.: Technical Note: In-tercomparison of formaldehyde measurements at the atmosphere simulation chamber SAPHIR, Atmos. Chem. Phys., 8, 2189– 2200, doi:10.5194/acp-8-2189-2008, 2008.
Du-santer, S., Stevens, P. S., and Tie, X.: Measurements of HNO3 and N2O5using ion drift-chemical ionization mass spectrometry during the MILAGRO/MCMA-2006 campaign, Atmos. Chem. Phys., 8, 6823–6838, doi:10.5194/acp-8-6823-2008, 2008. Zheng, J., Khalizov, A., Wang, L., and Zhang, R.: Atmospheric
pressure-ion drift chemical ionization mass spectrometry for detection of trace gas species, Anal. Chem., 82, 7302–7308, doi:10.1021/ac101253n, 2010.
Zheng, J., Garzón, J. P., Huertas, M. E., Zhang, R., Levy, M., Ma, Y., Huertas, J. I., Jardón, R. T., Ruíz, L. G., Tan, H., and Molina, L. T.: Volatile organic compounds in Tijuana during the Cal-Mex 2010 campaign: Measurements and source apportionment, Atmos. Environ., 70, 521–531, doi:10.1016/j.atmosenv.2012.11.030, 2013a.
Zheng, J., Zhang, R., Garzón, J. P., Huertas, M. E., Levy, M., Ma, Y., Torres-Jardón, R., Ruiz-Suárez, L. G., Russell, L., Taka-hama, S., Tan, H., Li, G., and Molina, L. T.: Measurements of formaldehyde at the U.S.–Mexico border during the Cal-Mex 2010 air quality study, Atmos. Environ., 70, 513–520, doi:10.1016/j.atmosenv.2012.09.041, 2013b.