Submitted23 September 2016 Accepted 29 November 2016 Published10 January 2017
Corresponding author Ehsan Pashay Ahi, ehsan.pashay-ahi@uni-graz.at, epa1@hi.is
Academic editor María Ángeles Esteban
Additional Information and Declarations can be found on page 17
DOI10.7717/peerj.2843
Copyright 2017 Ahi and Sefc
Distributed under
Creative Commons CC-BY 4.0
OPEN ACCESS
A gene expression study of
dorso-ventrally restricted pigment pattern in
adult fins of
Neolamprologus meeli, an
African cichlid species
Ehsan Pashay Ahi and Kristina M. Sefc
Institute of Zoology, Universitätsplatz 2, Universität Graz, Graz, Austria
ABSTRACT
Fish color patterns are among the most diverse phenotypic traits found in the animal kingdom. Understanding the molecular and cellular mechanisms that control in chromatophore distribution and pigmentation underlying this diversity is a major goal in developmental and evolutionary biology, which has predominantly been pursued in the zebrafish model system. Here, we apply results from zebrafish work to study a naturally occurring color pattern phenotype in the fins of an African cichlid species from Lake Tanganyika. The cichlid fishNeolamprologus meelidisplays a distinct dorsal color pattern, with black and white stripes along the edges of the dorsal fin and of the dorsal half of the caudal fin, corresponding with differences in melanophore density. To elucidate the molecular mechanisms controlling the differences in dorsal and ventral color patterning in the fins, we quantitatively assessed the expression of 15 candidate target genes involved in adult zebrafish pigmentation and stripe formation. For reference gene validation, we screened the expression stability of seven widely expressed genes across the investigated tissue samples and identifiedtbpas appropriate reference. Relative expression levels of the candidate target genes were compared between the dorsal, striped fin regions and the corresponding uniform, grey-colored regions in the anal and ventral caudal fin. Dorso-ventral expression differences, with elevated levels in both white and black stripes, were observed in two genes, the melanosome protein coding genepmel and inigsf11, which affects melanophore adhesion, migration and survival. Next, we predicted potential shared upstream regulators ofpmel andigsf11. Testing the expression patterns of six predicted transcriptions factors revealed dorso-ventral expression difference ofirf1and significant, negative expression correlation of
irf1with bothpmel andigsf11. Based on these results, we proposepmel,igsf11andirf1
as likely components of the genetic mechanism controlling distinct dorso-ventral color patterns inN. meelifins.
SubjectsAquaculture, Fisheries and Fish Science, Biodiversity, Evolutionary Studies, Molecular Biology, Zoology
Keywords Melanophore, Iridophore, Colour stripe, Fin, Dorso-ventral, Pigment pattern, Neolamprologus meeli, Gene expression, African cichlids
INTRODUCTION
of the scientific attraction to colour patterns, besides an appreciation of their innate beauty, is due to their enormous diversity and rapid evolution, their crucial roles in mate choice and camouflage, and the comparative easiness with which the colour pattern phenotypes can be observed and scored (Hoekstra, 2006;Mills & Patterson, 2009). The extensive diversity of vertebrate integumental colour patterns arises from variation in migration, organization and differentiation of pigment cells, which themselves originate from neural crest-derived precursor cells during embryonic development (Kelsh et al., 2009;Bronner & LeDouarin, 2012). It comes with no surprise that teleost fishes as the largest and most diverse group of vertebrates exhibit the highest complexity and diversity in pigmentation patterns. Fish possess the highest number of pigment classes among vertebrates, which are contained in several types of pigment cells (chromatophores), i.e., melanophores (black pigment), erythrophores and xanthophores (yellow-red pigments), cyanophores (blue pigment) and light reflecting iridophores/leucophores (silvery white) (Fujii, 2000;Lynn Lamoreux et al., 2005;Kelsh et al., 2009). The unrivalled diversity of piscine colours and patterns has been attributed to fundamental genetic changes, such as the whole-genome duplication in the teleost lineage providing additional copies of pigmentation genes, and the retention of duplicated pigmentation genes (lost in other vertebrates) from earlier genome duplications in the vertebrate lineage (Braasch, Volff & Schartl, 2008;Braasch et al., 2009). Despite the differences, genetic studies in fish and tetrapod models, particularly using zebrafish, mouse and chicken mutants, have revealed conservation in some patterning mechanisms such as genes involved in migration and formation of melanophores (Lister, Close & Raible, 2001;
Kelsh, 2004;Hoekstra, 2006;Mills & Patterson, 2009;Kelsh et al., 2009).
Pigment patterning is also highly influenced by environmental cues and cellular interactions between the chromatophores (Leclercq, Taylor & Migaud, 2009). Studies in zebrafish showed that the presence of only one type of chromatophore, and the absence of other types, leads to a uniform distribution of the chromatophore throughout the skin without specific pattern (Singh & Nüsslein-Volhard, 2015). The interactions between chromatophores can be complex; for instance, iridophores suppress melanophore survival locally but promote it at a longer distance (Frohnhöfer et al., 2013). Among the extensive collection of colour patterns, a frequent motif in teleost fish is the organization of pigment cells along dorso-ventral or anterior-posterior body axes into stripes (Maan & Sefc, 2013;
Singh & Nüsslein-Volhard, 2015). So far, several genes have been shown to be involved in stripe formation (Singh & Nüsslein-Volhard, 2015). Intriguingly, stripes can appear predominantly or exclusively in specific body compartments and/or fins, and little is known about the molecular mechanisms that restrict pattern formation to specific regions. Moreover, fin and body stripe formation are controlled by different mechanisms in zebrafish, and while body stripe formation has been extensively studied, much less is known about the mechanisms operating in fins (Singh & Nüsslein-Volhard, 2015). However, given that fin pattern variation contributes significantly to the phenotypic diversity of teleost fish, an increased understanding of its molecular background is highly desirable.
Figure 1 (. . . continued)
The blue dashed squares delineate the fin tissue analysed in the present study; the numbers 1–3 in the red circles distinguish the investigated fin regions based on their coloration and distal to proximal location. (B) Loss-of-function mutations inMitf andEdnrbgenes cause skin phenotypes with dorsally restricted black pigmentation in horse and mice. A converse colour phenotype has been observed in black Silver coloured horses as a result of a mutation in thePMELgene (only mane and tail are white). (C) Loss-of-function mutations in an avian paralog of theEdnrb1gene,EDNRB2, cause phenotypes with black–white plumage (dorsal black spots) in Japanese quail, domestic chicken and duck.
Table 1 Selected candidate target genes and available literature indicating their role in pigmentation and stripe formation in zebrafish.
Gene Developmental formation Adult pigmentationa Stripe formation References
Melanophore Iridophore Xanthophore
bnc2 + + + + + Lang et al. (2009)
csf1r + ? + + + Parichy & Turner (2003)
ece2 ? + ? + + Krauss et al. (2014)
ednrb1 + + ? + + Parichy (2006)
fbxw4 + + ? + + Kawakami et al. (2000)
igsf11 + ? ? + + Eom et al. (2012)
kita + ? ? + + Parichy (2006),Mills,
Nuckels & Parichy (2007)
andDooley et al. (2013a)
kir7.1 + − + − + Iwashita et al. (2006)
ltk ? + − + + Fadeev et al. (2015)and
Lopes et al. (2008)
mitfa + ? − + + Lister, Close & Raible
(2001)andJohnson, Nguyen & Lister (2011)
mpv17 ? + ? + + Krauss et al. (2013)
pmel + ? ? + ? Schonthaler et al. (2005)
slc24a5 + ? ? + − Lamason et al. (2005)
slc45a2 ? ? ? + ? Dooley et al. (2013b)
sox10 + ? ? ? + Dutton et al. (2001)and
Elworthy et al. (2003)
Notes.
aA role in adult pigmentation mainly indicates the requirement of gene function for survival of different chromatophore lineages or/and pigment formation in adult zebrafish.
fish displays a contrasting pattern of black and white stripes in its dorsal and caudal fins (see
Fig. 1A) which emerges during the juvenile stage and is maintained throughout adulthood. The phenotype resembles dorso-ventrally distinct pigment patterns observed not only in fishes but also in evolutionary distant mammalian and avian species (Figs. 1Band1C) (Metallinos, Bowling & Rine, 1998;Matsushima et al., 2002;Baxter et al., 2004;Miwa et al., 2007;Hauswirth et al., 2012;Andersson et al., 2013;Kinoshita et al., 2014;Li et al., 2015).
in melanosome traits of the adult fish would be reflected in the expression levels of genes involved in stripe formation and adult pigmentation. The identification of such differentially expressed genes will provide a foundation for further understanding of the molecular mechanisms underlying pigment motifs along body axes. Furthermore, mechanisms of stripe formation, particularly those involving iridophore-derived patterning, in the zebrafish body appeared to be different from those in fins (Singh & Nüsslein-Volhard, 2015). Hence, our study will shed light on the role of genes, which control the formation of body stripes in adult zebrafish, in the patterning ofN. meelifins. In our study, we first characterized the colour pattern phenotype by determining the distribution of melanophores in each fin region, and verifying the presence of iridophores based on the expression of an irodophore-specific marker gene. Next, we investigated the expression patterns of candidate genes in the differently coloured regions of the different fins. Finally, we examined the expression patterns of predicted potential upstream regulators of two differentially expressed target genes. By identifying dorso-ventrally distinct expression of two target genes and one potential shared transcription factor, our work suggests potential components of the mechanism controlling dorsally restricted stripe formation inN. meeli.
METHODS
Fin sampling and melanophore counting
Four captive bred, adult individuals ofN. meeli, two males and two females, were used in this study. The size of the fish was between 7–10 cm and their fins looked intact. The fishes did not show sex dependent differences or individual variation in their stripe patterns. Prior to the experiments, the fish were transferred to separate aquaria and fed on identical diets for two weeks. To obtain fin tissue biopsies, the fish were anesthetized in water containing 0.04 gram per litre of MS-222 and parts of their dorsal fin (D), anal fin (A), and dorsal and ventral parts of their caudal fin (Cd and Cv) were cut under a stereomicroscope (the clipped fin areas are specified by blue dashed squares in Fig. 1A). From each of the cut fin tissues, a piece was dissected and immersed in 0.5 mg/ml epinephrine solution (Sigma No. E4375) for 60 min in order to aggregate the melanosomes. The remaining fin tissue was dissected carefully based on its distinct colours (specified with red circles inFig. 1A), and each piece was immersed in RNAlater (Qiagen) and stored frozen until RNA isolation. Throughout the paper, the individual fin tissues investigated in the study are addressed as ‘‘fin regions’’ and identified by fin type and a number referring to location, such that, for instance, A-1 stands for the distal region of the anal fin, A-2 identifies the middle region and A-3 the proximal region (Fig. 1A). Anatomically equivalent fin regions are grouped into distal, middle and proximal ‘‘classes of fin regions’’ (e.g., the distal class consists of the regions D-1, Cd-1, Cv-1 and A-1;Fig. 1A).
permit number BMWFW-66.007/0013-WF/V/3b/2016 issued by the Federal Ministry of Science, Research and Economy of Austria.
RNA isolation and cDNA synthesis
Tissue samples of the individual fin regions (see above) were transferred from RNAlater to tubes containing TRI Reagent (Sigma) and 1.4 mm ceramic spheres, and homogenized by FastPrep-24 Instrument (MP Biomedicals, Santa Ana, CA, USA). RNA was extracted according to manufacturer’s Trizol protocol and dissolved in 30µl RNase-free water. RNA samples were treated with DNase (New England Biolabs) to remove contaminating DNA. RNA concentration was measured by spectrophotometry using a Nanophotometer (IMPLEN GmbH, Munich, Germany). The quality of the RNA samples was evaluated in a R6K ScreenTape System on an Agilent 2200 TapeStation (Agilent Technologies) to ensure that the integrity number (RIN) of all samples was higher than 7. cDNA was prepared from 1,000 ng of RNA using the High Capacity cDNA Reverse Transcription kit (Applied Biosystems), according to the manufacturer’s protocol. Negative controls, i.e., reactions without addition of reverse transcriptase (-RT samples), were prepared to confirm the absence of genomic DNA. cDNA was diluted 1:3 times in nuclease-free water for further use in quantitative real-time PCR.
Gene selection, primer design and real-time qPCR
To validate suitable reference genes for accurate expression analysis, we selected 7 genes expressed in a variety of tissues and frequently used as reference gene candidates in qPCR studies of teleost fishes (Table S1) (Tang et al., 2007;Fernandes et al., 2008;Olsvik, Søfteland & Lie, 2008;Small et al., 2008; Zheng & Sun, 2011;Yang et al., 2013;Ahi et al., 2013). In addition, we selected 15 target genes that are known to be involved in adult pigmentation and/or stripe formation in zebrafish (Table 1andTable S1). Later, we extended our expression analyses to six additional candidate genes which were predicted as potential upstream regulators of two differentially expressed genes in our study (Table S1). The qPCR primers were designed within sequences conserved across African cichlids, based on recently released transcriptome data from a distantly related species,Oreochromis niloticus, and a closely related species from Lake Tanganyika,Neolamprologus brichardi
(Brawand et al., 2014). The sequence alignment was conducted using CLC Genomic Workbench, version 7.5 (CLC Bio, Aarhus, Denmark) and locations overlapping the exon boundaries of the genes were determined based on the Nile Tilapia annotated genome sequences in the Ensembl database (http://www.ensembl.org/Oreochromis_niloticus). The qPCR Primers were designed on exon boundaries of the conserved regions using Primer Express 3.0 software (Applied Biosystems, Foster City, CA, USA) and checked for self-annealing, hetero-dimers and hairpin structures with OligoAnalyzer 3.1 (Integrated DNA Technology) (Table S1).
each run for each gene and the experimental set-up per run followed the preferred sample maximization method (Hellemans et al., 2007). The qPCR was run with a 2 min hold at 50◦C and a 10 min hot start at 95◦C followed by the amplification step for 40 cycles
of 15 sec denaturation at 95◦C and 1 min annealing/extension at 60◦C. A dissociation
step (60 ◦C–95◦C) was performed at the end of the amplification phase to identify a
single, specific product for each primer set (Table S1). Primer efficiency values (E) were calculated with the LinRegPCR v11.0 programme (http://LinRegPCR.nl) (Ramakers et al., 2003) analysing the background-corrected fluorescence data from the exponential phase of PCR amplification for each primer-pair and those with E less than 0.9 were discarded and new primers designed (Table S1).
Data analysis
Three different ranking algorithms, BestKeeper (Pfaffl et al., 2004), NormFinder (Andersen, Jensen & Ørntoft, 2004) and geNorm (Vandesompele et al., 2002), were employed to identify the most stably expressed reference genes The standard deviation (SD) based on Cq values of the fin regions was calculated by BestKeeper to determine the expression variation for each reference gene. In addition, BestKeeper determines the stability of reference genes based on correlation to other candidates through calculation of BestKeeper index (r). GeNorm measures mean pairwise variation between each gene and other candidates, the expression stability orM value, and it excludes the gene with the highestM value (least stability) from subsequent analysis in a stepwise manner. NormFinder identifies the most stable genes (lowest expression stability values) based on analysis of the sample subgroups and estimation of inter- and intra-group variation in expression levels (Ahi et al., 2013;
Pashay Ahi et al., 2016).
The Cq values of the best ranked reference genes was used as Cqreference in the1Cq
calculations. For the analysis of the qPCR data, the difference between Cq values (1Cq) of the target genes and the selected reference gene was calculated for each target gene;
1Cqtarget=Cqtarget−Cqreference. All samples were then normalized to the1Cq value of
a calibrator sample to obtain a11Cq value (1Cqtarget−1Cqcalibrator). For comparisons
of gene expression involving all three classes of fin regions, one biological replicate of D-3 was arbitrarily chosen as calibrator sample. For comparisons restricted to anatomically equivalent fin regions, one biological replicate of D-1, D-2 and D-3 served as calibrator for proximal, middle and distal fin region samples, respectively. Relative expression quantities (RQ) were calculated based on the expression level of the calibrator sample (E−11Cq) (Pfaffl, 2001). A two-way ANOVA followed by post hoc Tukey’s HSD test was
implemented for each target gene to compare RQ values among fins (averaged across regions) and fin regions. To assess similarities in the expression patterns of the target genes, Pearson correlation coefficients (r) were calculated in R (http://www.r-project.org).
transcription factor (TF) binding sites using STAMP (Mahony & Benos, 2007), with the motif position weight matrices (PWMs) retrieved from the TRANSFAC database (Matys et al., 2003).
RESULTS
Characterization of melanophore distribution in the fin regions
Comparisons of melanophore density and gene expression patterns were conducted between anatomically comparable regions of the dorsal, caudal and anal fins; i.e., either among the total areas cut from each fin (e.g. D-1 +D-2 +D-3 for the dorsal fin),
or separately within each of the corresponding fin region classes; the distal fin regions (D-1, Cd-1, Cv-1 and A-1); the middle fin regions (D-2, Cd-2, Cv-2 and A-2); and the proximal fin regions (D-3, Cd-3, Cv-3 and A-3). Expression comparisons between different classes of fin regions were avoided because given the different histological properties of distinct anatomical fin regions along proximal-distal axis, gene expression differences between non-analogous regions could arise for various reasons not associated with colour patterning.
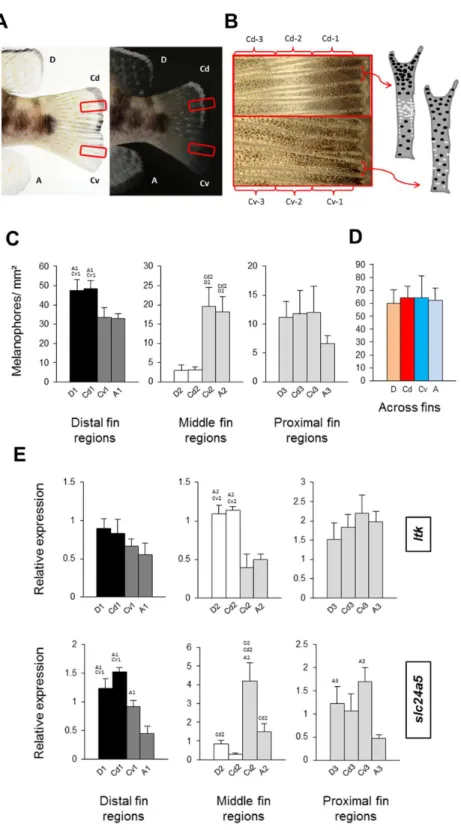
Melanophore density was significantly higher in the black distal regions of the dorsal fin and dorsal part of the caudal fin (D-1 and Cd-1) than in their dark grey ventral counterparts, A-1 and Cv-1 (Fig. 2C). The white dorsal middle regions (D-2 and Cd-2) contained almost no melanophores, whereas melanophore densities were intermediate in their grey ventral counterparts, A-2 and Cv-2, and finally the most proximal regions in all the fins had almost similar numbers of melanophores (Fig. 2C). Melanophore density clearly corresponded with the impression of darkness/lightness of the investigated fin regions. Additionally, the white colour of D-2 and Cd-2 regions appeared to be the result of both melanophore absence and an accumulation of white reflecting iridophores (Fig. 2B). Interestingly, total melanophore numbers summed across fin regions did not differ between fins (Fig. 2D). This indicates that the different fin patterns result from variation in the distribution and perhaps also pigmentation of a constant number of melanophores. In other words, aggregation of melanophores in the black regions and their absence in white regions, determines the dorsal stripes, whereas in their ventral counterpart regions the same number of melanophores is distributed more evenly.
Validation of reference genes
qPCR-based gene expression analyses depend on comparisons with stably expressed reference genes (Kubista et al., 2006), which have to be validated for the species and the specific experimental conditions in each study (Ahi et al., 2013). To this aim, we tested the expression of seven reference gene candidates on the cDNA generated from each of the 12 fin regions. The expression levels of the reference gene candidates varied fromactb1, with the highest expression (lowest Cq) (Fig. S1), toef1aandhprt1with the lowest expressions (highest Cq). Next, the genes were ranked based on three algorithms, i.e., BestKeeper, geNorm and NormFinder, and standard deviation (SD) as described inAhi et al. (2013)
Figure 2 Distribution of melanophores and expression of two chromatophore marker genes in fins of
N. meeli. Fins coded as inFig. 1A. (A) Photographs of the fins ofN. meelitaken on white and black
Figure 2 (. . . continued)
colour contrasts are lower in the ventral part of the fin (fin regions Cv-1, Cv-2 and Cv-3, respectively). Analogous patterns were found in the dorsal and anal fins. The chromatophore distribution in the dor-sal and ventral parts of the caudal fin is depicted in the schematic drawings of two inter-ray regions (white and black dots represent iridophores and melanophores, respectively). (C) Melanophore densities in the distinct fin regions, grouped by anatomical equivalence into the distal fin regions (D-1, Cd-1, Cv-1 and A-1), the middle fin regions (D-2, Cd-2, Cv-2 and A-2) and the proximal fin regions (D-3, Cd-3, Cv-3 and A-3). Pairwise differences between individual fin regions are indicated by the letter codes of fin regions with significantly lower melanophore density (P<0.01) above bars. (D) Melanophore density summed across fin regions in the D, Cd, Cv and A fins. There were no significant differences between fins. (E) The expression levels ofltkandslc24a5in the individual fin regions. Statistical comparisons were conducted among anatomically comparable regions, and pairwise differences between fin regions are indicated by the letter codes of fin regions with significantly lower expression (P<0.01) above bars. In (C–E), error bars represent standard deviations calculated from four biological replicates and the comparisons between groups were done by using Tukey-HSD.
Table 2 Ranking and statistical analyses of candidate reference genes using BestKeeper, geNorm and NormFinder.
BestKeeper geNorm NormFinder
Ranking r Ranking SD Ranking M Ranking SV
rps18 0.992 actb1 1.027 tbp 1.006 tbp 0.069
tbp 0.987 tbp 1.099 rps18 1.023 rps18 0.113
rps11 0.983 ef1a 1.160 rps11 1.030 actb1 0.141
actb1 0.983 rps11 1.217 actb1 1.035 rps11 0.190
ef1a 0.777 rps18 1.297 ef1a 1.470 ef1a 0.622
hprt1 0.718 gapdh 1.761 hprt1 2.285 hprt1 1.191
gapdh 0.493 hprt1 2.386 gapdh 2.352 gapdh 1.252
Notes.
Abbreviations: SD, Standard deviation;r, Pearson product-moment correlation coefficient; SV, stability value; M, M value of stability.
oftbpand suggested it as a suitable normalization factor to accurately quantify differences in gene expression between the fin regions.
Expression analyses of candidate genes
as the correlation was significant in the distal and the middle regions (r=0.73,p=0.001; r=0.76,p=0.0007, respectively) but not in the proximal regions of the fins (r=0.22, p=0.42). This suggests that variation in melanosome densities within the melanophores may also contribute to fin color contrasts.
Since the total number of melanophores, summed across regions, was constant in all fins, we next determined the average expression levels of each of the candidate target genes across the three regions of each fin and compared them among fins in order to identify spatial (particularly dorso-ventral) differentiation in gene expression. The selected candidate genes are known to be involved in stripe formation and/or adult pigmentation in zebrafish (see the details inTable 1). One of the genes,kir7.1(kcnj13), had very low expression levels (Cq > 35) and therefore was discarded from rest of the analysis. This, however, suggests thatkir7.1expression is not required for chromatophores in fin regions of adultN. meeli, which is in agreement with findings in zebrafish,where the function of
kir7.1was not necessary for pigment cell survival in adults (Iwashita et al., 2006). Seven genes,igsf11,ltk,mitfa,mpv17,pmel,slc24a5andslc45a2, showed differential expression between the fins (Fig. 3A). The expression level of the melanosome formation geneslc24a5
was significantly lower in the anal fin than in the other fins. Given that melanophore counts did not differ across fins (Fig. 2D), this indicates a reduced melanosome number in the melanophores of the anal fin. Furthermore, owing to the dorsal white stripes, expression levels of the iridophore markerltkwere significantly higher in the dorsal than in the ventral fin tissues. Dorso-ventral differences were also observed in the expression levels ofigsf11,
mitfa,pmel andslc45a2(D, Cd > A, Cv), whereasmpv17 showed differential expression along the posterior-anterior axis (D, A > Cd, Cv).
Next, we were interested in those genes which showed overall dorso-ventral expression differences across the fins, and compared their expression within the distal, middle and proximal regions separately. Most interestingly, two genes,igsf11andpmel, displayed higher expression in the black and in the white regions (D-1, Cd-1, and D-2, Cd-2) than in the corresponding ventral regions (Fig. 3B) (Table S3). Importantly, the elevated expression of these genes in the dark stripe was not simply due to the higher density of melanophores in these regions, as the differences persisted after correcting for the number of melanophores (last row inFig. 3B). Elevated expression in both black and white stripes suggests that
igsf11andpmelhave similar expression and potential function(s) in both iridophores and melanophores, which might emanate from their shared neural crest cell origin (Curran et al., 2010).
In contrast, the elevated expression levels of two further genes,mitfaandslc45a2, in the black stripe regions compared to the corresponding ventral regions (first row inFig. 3B) levelled out after correction for differences in melanophore density among fin regions (last row inFig. 3B). As discussed before,ltk expression was elevated only in the white stripes (Fig. 2E), consistent with its expression in iridophores.
known TF binding sites in vertebrates, we compiled lists of top potential TFs binding to each motif (Table S2). We then analysed the expression of six of the TFs, which were predicted by all of the three motif enrichment tools and implicated in pigmentation processes (Barrallo-Gimeno et al., 2004;Cook & Sturm, 2008;Li et al., 2009;Agarwal et al., 2011;Besch & Berking, 2014;Natarajan et al., 2014) (Fig. 4). Five of these TFs showed slight but significant expression differences between the fins (Fig. 4A), however only one TF,
irf1, showed dorso-ventral differences (D, Cd < A, Cv). This pattern was confirmed in comparisons among anatomically equivalent regions, as the reduced expression of irf1 in the black stripe regions (first row inFig. 4B) was robust against the correction for melanophore density (last row inFig. 4B).
We also tested for expression correlations among the seven differentially expressed target genes (identified inFig. 3A) and the six predicted TFs (Fig. 4C). The results showed positive expression correlations (blue shadings inFig. 4C) between several pairs of target genes, includingigsf11andpmel, as well as negative expression correlations (red shadings) between target genes and three TFs,irf1,irf2andap2a. Notably, strong expression correlations with several target genes were observed forirf1, which was negatively correlated withigsf11,
mitfa,pmelandslc45a2.
DISCUSSION
Patterns of dark and light stripes are found in many fish species and may not only reflect spatial variation in the number of chromatophores, but can also arise from differences in the pigmentation of the individual chromatophores (Parichy, 2006;Greenwood, Cech & Peichel, 2012). In the here investigated cichlid fish,Neolamprologus meeli, the dorso-ventrally distinct fin stripes involved differences in the spatial distribution of a constant number of melanophores, i.e., their aggregation and depletion in the dorsal black and white stripes, respectively, versus a more homogeneous melanophore density in the ventral fin regions. Although melanophore density in the N. meelifin samples showed the expected gradient between black, grey and white fin regions, its correlation with the expression level of the melanosome markerslc24a5was not consistent across fin regions.
Slc24a5encodes an intracellular membrane cation exchanger predominantly present in melanosomes. Its tissue expression level has been shown to be associated with the number of melanin-producing cells, and reduced expression is associated with fewer, smaller and less pigmented melanosomes (Lamason et al., 2005). The mechanism by whichslc24a5
expression can be regulated differently across melanophore subpopulations in distinct body parts is unclear but it might involve the nonsense-mediated mRNA decay pathway (Wittkopp et al., 2009). Our data suggest that the melanin-based colour differences among fin regions of N. meeliare primarily due to differences in melanophore density, with additional variation contributed by variation in melanophore pigmentation.
all fin regions, but was significantly elevated in the white stripes, which is consistent with an aggregation of iridophores in these regions. This iridophore aggregation could also be involved in the development of the black stripe distal to the white stripe. In the zebrafish dermis, iridophores repel melanophores on the short range but support their aggregation at a longer distance, and thus contribute to melanophore stripe formation (Frohnhöfer et al., 2013).
Since the stripe pattern of the N. meelifins is dorsally restricted, we were primarily interested in genes displaying a corresponding dorso-ventral difference in their expression levels. Two of the investigated candidate genes, igsf11andpmel, followed this pattern in comparisons among fins as well as among analogous fin regions after correction for melanophore density. Expression levels of both genes were higher in the dorsal black and white stripe regions than in the corresponding ventral fin regions (Fig. 3B).Igsf11encodes the immunoglobulin superfamily member 11, a classical cell adhesion molecule, which mediates cell adhesion and promotes the migration and survival of melanophores and their precursors during adult stripe formation in zebrafish (Eom et al., 2012). Interestingly, mutations inigsf11can have local effects. While a homozygous mutation in the fourth exon ofigsf11induces severe irregularities in both body and fin stripes of adult zebrafish, defects caused by mutations in the second exon are mainly restricted to ventral body stripes but not apparent in fins (Eom et al., 2012). Since the melanophores of zebrafishigsf11mutants failed to migrate, the higher expression ofigsf11 in both black and white stripes ofN. meelimight suggest an increased motility of melanophores in these regions. Furthermore, increased igsf11 expression may also affect the arrangement of iridophores. Although the function ofigsf11in iridophores is unclear, Tjp1a, a tight junction protein recently identified as regulator of iridophore organization in zebrafish stripes, has been suggested to be an interacting partner of igsf11 protein in relevant cellular processes (Fadeev et al., 2015). The other gene with dorsally elevated expression levels,pmel, encodes a melanosome protein (Silver), which plays an essential role in the structural organization of
premelanosomes and the formation of intra-lumenal fibrils during melanosome biogenesis (Schonthaler et al., 2005). In homozygous zebrafish mutants of pmel, changes in the shape positioning and melanin content of melanophores result in hypopigmented adults (Schonthaler et al., 2005). The function ofpmel in the formation of pigment patterns has not been investigated, however, its differential expression was suggested as a contributing factor to the dark-light stripe formation in freshwater threespine sticklebacks compared to marine sticklebacks with evenly distributed melanophores and iridophores throughout skin (Greenwood, Cech & Peichel, 2012).
dorsally distinct stripe pattern inN. meelifins involves a novel regulatory mechanism with locally restricted activity in the dorsal fin regions, which inducesigsf11andpmelin both chromatophore classes and affects cell migration and melanosome biogenesis.
We also found an overall positive expression correlation betweenigsf11 andpmel
across all fin regions suggesting a potential co-regulation through a shared upstream transcriptional regulator. There is no evidence yet for such a mechanism in fish, but a recent computational study in human has predicted TFs, including Ap2a and Mitf, and small regulatory RNAs, such as mir-221, as shared upstream regulators ofigsf11andpmel
in specific melanocyte lineages (Rambow et al., 2015). Here, we have already testedmitfa
expression in our candidate gene survey and did not detect elevated expression in the dorsal black and white stripes In addition,mitfashowed positive expression correlation with pmel but not withigsf11 (Fig. 4C). Among the shared TFs predicted by the motif enrichment approach employed in the present study, onlyirf1displayed dorso-ventrally distinct expression (with higher expression level in ventral regions) (Figs. 4Aand4B). Moreover,irf1showed negative expression correlations not only withigsf11andpmel but also withmitfaandslc45a2across the fin regions (Fig. 4C). The gene encodes a member of the interferon regulatory transcription factor family and mediates a cytokine-dependent hypopigmentation process in human and mice melanocytes (Natarajan et al., 2014). The mechanism, by which Irf1 impedes pigmentation, appears to be involved in melanosome maturation and is independent of Mitf regulation (Natarajan et al., 2014). The expression pattern ofirf1in theN. meelifins, the enrichment of its binding sites inigsf11andpmel
promoter regions together with the regulatory role of bothirf1andpmelin melanosome biogenesis suggestirf1as a strong candidate for the regulation of the observed fin colour phenotype. More specifically, irf1 might act as suppressor of bothigsf11andpmelin the chromatophores.
Finally, we note that the involvement in dorso-ventrally distinct colour patterning of those genes, which did not show the expected expression in our study, should not be discarded based solely on mRNA expression data. For instance, our TF prediction also includedap2a, which encodes a TF essential for subsets of neural crest derivatives, including subpopulations of pigment cells. Its loss-of-function mutation in zebrafish leads to defects in the migration and differentiation of melanophores and iridophores, but not xanthophores (Knight et al., 2004;Li & Cornell, 2007). Interestingly, the zebrafish
CONCLUSIONS
Variation in colours and patterns contributes significantly to the tremendous phenotypic diversity among fishes. Elucidating the molecular basis of this diversity is a stimulating challenge to research in both model and non-model species, and promises significant insight in the mechanisms that translate sexual and natural selection pressures into phenotypic variation. In our work, we capitalized on a naturally occurring, dorsally restricted fin pattern phenotype to investigate the mechanisms behind colour pattern differentiation in dorsal versus ventral regions. The investigated fin colour pattern was associated with variation in melanophore and iridophore densities, and corresponded with the gene expression patterns of two candidate target genes,igsf11andpmel, and their predicted shared upstream regulatorirf1. Further studies are required to identify functional relationships between these genes and other potential components of this process.
ACKNOWLEDGEMENTS
The authors thank Wolfgang Gessl for his responsible management of our fish facility and photography of the fishes. We also thank Holger Zimmermann and Stephan Koblmüller for sharing their precious knowledge on cichlid fishes of Lake Tanganyika, as well as Silke Werth and the Institute of Plant Sciences at University of Graz for technical assistance.
ADDITIONAL INFORMATION AND DECLARATIONS
Funding
The University of Graz provided financial support for this study. The funders had no role in study design, data collection and analysis, decision to publish, or preparation of the manuscript.
Grant Disclosures
The following grant information was disclosed by the authors: University of Graz.
Competing Interests
The authors declare there are no competing interests.
Author Contributions
• Ehsan Pashay Ahi conceived and designed the experiments, performed the experiments,
analyzed the data, contributed reagents/materials/analysis tools, wrote the paper, prepared figures and/or tables, reviewed drafts of the paper.
• Kristina M. Sefc conceived and designed the experiments, analyzed the data, contributed
reagents/materials/analysis tools, wrote the paper, prepared figures and/or tables, reviewed drafts of the paper.
Animal Ethics
The biopsies were performed under permit number BMWFW-66.007/0013-WF/V/3b/2016 issued by the Federal Ministry of Science, Research and Economy of Austria.
Data Availability
The following information was supplied regarding data availability: The raw data has been supplied asSupplementary File.
Supplemental Information
Supplemental information for this article can be found online athttp://dx.doi.org/10.7717/ peerj.2843#supplemental-information.
REFERENCES
Agarwal P, Verzi MP, Nguyen T, Hu J, Ehlers ML, McCulley DJ, Xu S-M, Dodou E,
Anderson JP, Wei ML, Black BL. 2011.The MADS box transcription factor MEF2C
regulates melanocyte development and is a direct transcriptional target and partner of SOX10.Development 138:2555–2565DOI 10.1242/dev.056804.
Ahi EP, Guðbrandsson J, Kapralova KH, Franzdóttir SR, Snorrason SS, Maier
VH, Jónsson ZO. 2013.Validation of reference genes for expression
stud-ies during craniofacial development in Arctic charr.PLOS ONE8:e66389
DOI 10.1371/journal.pone.0066389.
Andersen CL, Jensen JL, Ørntoft TF. 2004.Normalization of real-time quantitative
reverse transcription-PCR data: a model-based variance estimation approach to identify genes suited for normalization, applied to bladder and colon cancer data sets.Cancer Research64:5245–5250DOI 10.1158/0008-5472.CAN-04-0496.
Andersson LS, Wilbe M, Viluma A, Cothran G, Ekesten B, Ewart S, Lindgren
G. 2013.Equine multiple congenital ocular anomalies and silver coat colour
result from the pleiotropic effects of mutant PMEL.PLOS ONE8:e75639
DOI 10.1371/journal.pone.0075639.
Bailey TL, Boden M, Buske FA, Frith M, Grant CE, Clementi L, Ren J, Li WW, Noble
WS. 2009.MEME SUITE: tools for motif discovery and searching.Nucleic Acids
Research37(suppl_2):W202–W208DOI 10.1093/nar/gkp335.
Barrallo-Gimeno A, Holzschuh J, Driever W, Knapik EW. 2004.Neural crest survival
and differentiation in zebrafish depends on mont blanc/tfap2a gene function.
Development 131:1463–1477DOI 10.1242/dev.01033.
Baxter LL, Hou L, Loftus SK, Pavan WJ. 2004.Spotlight on spotted mice: a review
of white spotting mouse mutants and associated human pigmentation disorders.
Pigment Cell Research17(3):215–224DOI 10.1111/j.1600-0749.2004.00147.x.
Besch R, Berking C. 2014.POU transcription factors in melanocytes and melanoma.
European Journal of Cell Biology93(1–2):55–60DOI 10.1016/j.ejcb.2013.10.001.
Braasch I, Brunet F, Volff J-N, Schartl M. 2009.Pigmentation pathway evolution
after whole-genome duplication in fish.Genome Biology and Evolution1:479–493
Braasch I, Volff J-N, Schartl M. 2008.The evolution of teleost pigmentation and the fish-specific genome duplication.Journal of Fish Biology 73(1):1891–1918
DOI 10.1111/j.1095-8649.2008.02011.x.
Brawand D, Wagner CE, Li YI, Malinsky M, Keller I, Fan S, Simakov O, Ng AY, Lim ZW, Bezault E, Turner-Maier J, Johnson J, Alcazar R, Noh HJ, Russell P, Aken B, Alföldi J, Amemiya C, Azzouzi N, Baroiller J-F, Barloy-Hubler F, Berlin A, Bloomquist R, Carleton KL, Conte MA, D’Cotta H, Eshel O, Gaffney L, Galibert F, Gante HF, Gnerre S, Greuter L, Guyon R, Haddad NS, Haerty W, Harris RM, Hofmann HA, Hourlier T, Hulata G, Jaffe DB, Lara M, Lee AP, MacCallum I, Mwaiko S, Nikaido M, Nishihara H, Ozouf-Costaz C, Penman DJ, Przybylski D, Rakotomanga M, Renn SCP, Ribeiro FJ, Ron M, Salzburger W, Sanchez-Pulido L, Santos ME, Searle S, Sharpe T, Swofford R, Tan FJ, Williams L, Young S, Yin S, Okada N, Kocher TD, Miska EA, Lander ES, Venkatesh B, Fernald RD, Meyer A, Ponting CP, Streelman JT, Lindblad-Toh K, Seehausen O, Di Palma F.
2014.The genomic substrate for adaptive radiation in African cichlid fish.Nature
513(7518):375–381DOI 10.1038/nature13726.
Bronner ME, LeDouarin NM. 2012.Development and evolution of the neural crest: an
overview.Developmental Biology 366(8):2–9DOI 10.1016/j.ydbio.2011.12.042.
Carlson JM, Chakravarty A, DeZiel CE, Gross RH. 2007.SCOPE: a web server for
practical de novo motif discovery.Nucleic Acids Research35(suppl 2):W259–W264
DOI 10.1093/nar/gkm310.
Cook AL, Sturm RA. 2008.POU domain transcription factors: BRN2 as a regulator
of melanocytic growth and tumourigenesis.Pigment Cell & Melanoma Research
21(6):611–626DOI 10.1111/j.1755-148X.2008.00510.x.
Curran K, Lister JA, Kunkel GR, Prendergast A, Parichy DM, Raible DW. 2010.
Interplay between Foxd3 and Mitf regulates cell fate plasticity in the zebrafish neural crest.Developmental Biology 344(1):107–118DOI 10.1016/j.ydbio.2010.04.023.
Dooley CM, Mongera A, Walderich B, Nüsslein-Volhard C. 2013a.On the
embry-onic origin of adult melanophores: the role of ErbB and Kit signalling in estab-lishing melanophore stem cells in zebrafish.Development 140(5):1003–1013
DOI 10.1242/dev.087007.
Dooley CM, Schwarz H, Mueller KP, Mongera A, Konantz M, Neuhauss SCF,
Nüsslein-Volhard C, Geisler R. 2013b.Slc45a2 and V-ATPase are regulators of
melanosomal pH homeostasis in zebrafish, providing a mechanism for human pigment evolution and disease.Pigment Cell & Melanoma Research26(2):205–217
DOI 10.1111/pcmr.12053.
Dutton KA, Pauliny A, Lopes SS, Elworthy S, Carney TJ, Rauch J, Geisler R, Haffter
P, Kelsh RN. 2001.Zebrafish colourless encodes sox10 and specifies
non-ectomesenchymal neural crest fates.Development 128(21):4113–4125.
Elworthy S, Lister JA, Carney TJ, Raible DW, Kelsh RN. 2003.Transcriptional
Eom DS, Inoue S, Patterson LB, Gordon TN, Slingwine R, Kondo S, Watanabe M,
Parichy DM. 2012.Melanophore migration and survival during zebrafish adult
pigment stripe development require the immunoglobulin superfamily adhesion molecule Igsf11.PLoS Genetics8:e1002899DOI 10.1371/journal.pgen.1002899.
Fadeev A, Krauss J, Frohnhöfer HG, Irion U, Nüsslein-Volhard C. 2015.Tight Junction
Protein 1a regulates pigment cell organisation during zebrafish colour patterning.
eLife4:e06545DOI 10.7554/eLife.06545.
Fernandes JMO, Mommens M, Hagen Ø, Babiak I, Solberg C. 2008.Selection of
suitable reference genes for real-time PCR studies of Atlantic halibut development.
Comparative Biochemistry and Physiology Part B: Biochemistry and Molecular Biology
150(1):23–32DOI 10.1016/j.cbpb.2008.01.003.
Flicek P, Ahmed I, Amode MR, Barrell D, Beal K, Brent S, Carvalho-Silva D, Clapham P, Coates G, Fairley S, Fitzgerald S, Gil L, García-Girón C, Gordon L, Hourlier T, Hunt S, Juettemann T, Kähäri AK, Keenan S, Komorowska M, Kulesha E, Longden I, Maurel T, McLaren WM, Muffato M, Nag R, Overduin B, Pignatelli M, Pritchard B, Pritchard E, Riat HS, Ritchie GRS, Ruffier M, Schuster M, Sheppard D, Sobral D, Taylor K, Thormann A, Trevanion S, White S, Wilder SP, Aken BL, Birney E, Cunningham F, Dunham I, Harrow J, Herrero J, Hubbard TJP, Johnson N,
Kinsella R, Parker A, Spudich G, Yates A, Zadissa A, Searle SMJ. 2013.Ensembl
2013.Nucleic Acids Research41(D1):D48–D55DOI 10.1093/nar/gks1236.
Frohnhöfer HG, Krauss J, Maischein H-M, Nüsslein-Volhard C. 2013.Iridophores and
their interactions with other chromatophores are required for stripe formation in zebrafish.Development 140:2997–3007DOI 10.1242/dev.096719.
Fujii R. 2000.The regulation of motile activity in fish chromatophores.Pigment Cell
Research/Sponsored by the European Society for Pigment Cell Research and the Interna-tional Pigment Cell Society13(5):300–319DOI 10.1034/j.1600-0749.2000.130502.x.
Greenwood AK, Cech JN, Peichel CL. 2012.Molecular and developmental contributions
to divergent pigment patterns in marine and freshwater sticklebacks.Evolution & Development 14(4):351–362 DOI 10.1111/j.1525-142X.2012.00553.x.
Hauswirth R, Haase B, Blatter M, Brooks SA, Burger D, Drögemüller C, Gerber V, Henke D, Janda J, Jude R, Magdesian KG, Matthews JM, Poncet P-A, Svansson
V, Tozaki T, Wilkinson-White L, Penedo MCT, Rieder S, Leeb T. 2012.Mutations
in MITF and PAX3 cause ‘‘splashed white" and other white spotting phenotypes in horses.PLoS Genetics8:e1002653DOI 10.1371/journal.pgen.1002653.
Hellemans J, Mortier G, De Paepe A, Speleman F, Vandesompele J. 2007.qBase
relative quantification framework and software for management and auto-mated analysis of real-time quantitative PCR data.Genome Biology8:R19
DOI 10.1186/gb-2007-8-2-r19.
Higdon CW, Mitra RD, Johnson SL. 2013.Gene expression analysis of zebrafish
melanocytes, iridophores, and retinal pigmented epithelium reveals indica-tors of biological function and developmental origin.PLOS ONE8:e67801
Hoekstra HE. 2006.Genetics, development and evolution of adaptive pigmentation in vertebrates.Heredity 97:222–234DOI 10.1038/sj.hdy.6800861.
Iwashita M, Watanabe M, Ishii M, Chen T, Johnson SL, Kurachi Y, Okada N, Kondo
S. 2006.Pigment pattern in jaguar/obelix zebrafish is caused by a Kir7.1 mutation:
implications for the regulation of melanosome movement.PLoS Genetics2:e197
DOI 10.1371/journal.pgen.0020197.
Johnson SL, Nguyen AN, Lister JA. 2011.mitfa is required at multiple stages of
melanocyte differentiation but not to establish the melanocyte stem cell. Develop-mental Biology350(2):405–413DOI 10.1016/j.ydbio.2010.
Kawakami K, Amsterdam A, Shimoda N, Becker T, Mugg J, Shima A, Hopkins N. 2000.
Proviral insertions in the zebrafish hagoromo gene, encoding an F-box/WD40-repeat protein, cause stripe pattern anomalies.Current Biology10:463–466.
Kelsh RN. 2004.Genetics and evolution of pigment patterns in fish.Pigment Cell
Research17(4):326–336DOI 10.1111/j.1600-0749.2004.00174.x.
Kelsh RN, Harris ML, Colanesi S, Erickson CA. 2009.Stripes and belly-spots—a review
of pigment cell morphogenesis in vertebrates.Seminars in Cell & Developmental Biology20(1):90–104 DOI 10.1016/j.semcdb.2008.10.001.
Kinoshita K, Akiyama T, Mizutani M, Shinomiya A, Ishikawa A, Younis HH, Tsudzuki
M, Namikawa T, Matsuda Y. 2014.Endothelin receptor B2 (EDNRB2) is responsible
for the tyrosinase-independent recessive white (mow) and mottled (mo) plumage phenotypes in the chicken.PLoS ONE9:e86361DOI 10.1371/journal.pone.0086361.
Knight RD, Javidan Y, Nelson S, Zhang T, Schilling T. 2004.Skeletal and pigment cell
defects in thelockjaw mutant reveal multiple roles for zebrafishtfap2a in neural crest development.Developmental Dynamics229(1):87–98DOI 10.1002/dvdy.10494.
Krauss J, Astrinidis P, Frohnhöfer HG, Walderich B, Nüsslein-Volhard C. 2013.
Erratum: transparent, a gene affecting stripe formation in Zebrafish, encodes the mitochondrial protein Mpv17 that is required for iridophore survival.Biology Open 2(9):979.
Krauss J, Frohnhöfer HG, Walderich B, Maischein H-M, Weiler C, Irion U,
Nüsslein-Volhard C. 2014. Endothelin signalling in iridophore development and stripe
pattern formation of zebrafish.Biology Open3:503–509.
Kubista M, Andrade JM, Bengtsson M, Forootan A, Jonák J, Lind K, Sindelka R,
Sjöback R, Sjögreen B, Strömbom L, Ståhlberg A, Zoric N. 2006.The
real-time polymerase chain reaction.Molecular Aspects of Medicine27(2–3):95–125
DOI 10.1016/j.mam.2005.12.007.
Lamason RL, Mohideen M-APK, Mest JR, Wong AC, Norton HL, Aros MC, Jurynec MJ, Mao X, Humphreville VR, Humbert JE, Sinha S, Moore JL, Jagadeeswaran P, Zhao W, Ning G, Makalowska I, McKeigue PM, O’Donnell D, Kittles R, Parra EJ,
Mangini NJ, Grunwald DJ, Shriver MD, Canfield VA, Cheng KC. 2005.SLC24A5,
a putative cation exchanger, affects pigmentation in zebrafish and humans.Science
Lang MR, Patterson LB, Gordon TN, Johnson SL, Parichy DM. 2009.Basonuclin-2 requirements for zebrafish adult pigment pattern development and female fertility.
PLOS Genetics5:e1000744.
Leclercq E, Taylor JF, Migaud H. 2009.Morphological skin colour changes in teleosts.
Fish and Fisheries11(2):159–193DOI 10.1111/j.1467-2979.2009.00346.x.
Li W, Cornell RA. 2007.Redundant activities of Tfap2a and Tfap2c are required
for neural crest induction and development of other non-neural ectoderm derivatives in zebrafish embryos.Developmental Biology304(1):338–354
DOI 10.1016/j.ydbio.2006.12.042.
Li L, Li D, Liu L, Li S, Feng Y, Peng X, Gong Y. 2015.Endothelin receptor B2 (EDNRB2)
gene is associated with spot plumage pattern in domestic ducks (Anas platyrhyn-chos).PLOS ONE10:e0125883DOI 10.1371/journal.pone.0125883.
Li R, Maminishkis A, Banzon T, Wan Q, Jalickee S, Chen S, Miller SS. 2009.IFNγ
regulates retinal pigment epithelial fluid transport.American Journal of Physiology. Cell Physiology 297(6):C1452–C1465DOI 10.1152/ajpcell.00255.2009.
Lister JA, Close J, Raible DW. 2001.Duplicate mitf genes in zebrafish: complementary
expression and conservation of melanogenic potential.Developmental Biology
237(2):333–344DOI 10.1006/dbio.2001.0379.
Lopes SS, Yang X, Müller J, Carney TJ, McAdow AR, Rauch G-J, Jacoby AS, Hurst LD, Delfino-Machín M, Haffter P, Geisler R, Johnson SL, Ward A, Kelsh RN. 2008.
Leukocyte tyrosine kinase functions in pigment cell development.PLoS Genetics 4:e1000026DOI 10.1371/journal.pgen.1000026.
Luehr S, Hartmann H, Söding J. 2012.The XXmotif web server for eXhaustive, weight
matriX-based motif discovery in nucleotide sequences.Nucleic Acids Research
40(W1):W104–W109DOI 10.1093/nar/gks602.
Lynn Lamoreux M, Kelsh RN, Wakamatsu Y, Ozato K. 2005.Pigment pattern formation
in the medaka embryo.Pigment Cell Research18(2):64–73
DOI 10.1111/j.1600-0749.2005.00216.x.
Maan ME, Sefc KM. 2013.Colour variation in cichlid fish: developmental mechanisms,
selective pressures and evolutionary consequences.Seminars in Cell & Developmental Biology24(6–7):516–528DOI 10.1016/j.semcdb.2013.05.003.
Mahony S, Benos PV. 2007.STAMP: a web tool for exploring DNA-binding motif
simi-larities.Nucleic Acids Research35(suppl-2):W253–W258DOI 10.1093/nar/gkm272.
Matsushima Y, Shinkai Y, Kobayashi Y, Sakamoto M, Kunieda T, Tachibana M. 2002.
A mouse model of Waardenburg syndrome type 4 with a new spontaneous mutation of the endothelin-B receptor gene.Mammalian Genome: Official Journal of The Inter-national Mammalian Genome Society13(1):30–35DOI 10.1007/s00335-001-3038-2.
Matys V, Fricke E, Geffers R, Gössling E, Haubrock M, Hehl R, Hornischer K, Karas D, Kel AE, Kel-Margoulis OV, Kloos D-U, Land S, Lewicki-Potapov B, Michael H, Münch R, Reuter I, Rotert S, Saxel H, Scheer M, Thiele S, Wingender E. 2003.
Metallinos DL, Bowling AT, Rine J. 1998.A missense mutation in the endothelin-B receptor gene is associated with Lethal White Foal Syndrome: an equine version of Hirschsprung disease.Mammalian Genome: Official Journal of the International
Mammalian Genome Society9(6):426–431DOI 10.1007/s003359900790.
Mills MG, Nuckels RJ, Parichy DM. 2007.Deconstructing evolution of adult phenotypes:
genetic analyses of kit reveal homology and evolutionary novelty during adult pigment pattern development of Danio fishes.Development 134(6):1081–1090.
Mills MG, Patterson LB. 2009.Not just black and white: pigment pattern development
and evolution in vertebrates.Seminars in Cell & Developmental Biology20(1):72–81
DOI 10.1016/j.semcdb.2008.11.012.
Miwa M, Inoue-Murayama M, Aoki H, Kunisada T, Hiragaki T, Mizutani M,
Ito S. 2007.Endothelin receptor B2 (EDNRB2) is associated with the panda
plumage colour mutation in Japanese quail.Animal Genetics38(2):103–108
DOI 10.1111/j.1365-2052.2007.01568.x.
Natarajan VT, Ganju P, Singh A, Vijayan V, Kirty K, Yadav S, Puntambekar S, Bajaj S,
Dani PP, Kar HK, Gadgil CJ, Natarajan K, Rani R, Gokhale RS. 2014.IFN-γ
sig-naling maintains skin pigmentation homeostasis through regulation of melanosome maturation.Proceedings of the National Academy of Sciences of the United States of America111(6):2301–2306DOI 10.1073/pnas.1304988111.
Olsvik PA, Søfteland L, Lie KK. 2008.Selection of reference genes for qRT-PCR
examination of wild populations of Atlantic cod Gadus morhua.BMC Research Notes 1:47DOI 10.1186/1756-0500-1-47.
Parichy DM. 2006.Evolution of danio pigment pattern development.Heredity
97:200–210DOI 10.1038/sj.hdy.6800867.
Parichy DM, Turner JM. 2003.Temporal and cellular requirements for Fms signaling
during zebrafish adult pigment pattern development.Development130:817–833.
Pashay Ahi E, Walker BS, Lassiter CS, Jónsson ZO. 2016.Investigation of the effects of
estrogen on skeletal gene expression during zebrafish larval head development.PeerJ 4:e1878DOI 10.7717/peerj.1878.
Pfaffl MW. 2001.A new mathematical model for relative quantification in real-time
RT-PCR.Nucleic Acids Research29(9):e45DOI 10.1093/nar/29.9.e45.
Pfaffl MW, Tichopad A, Prgomet C, Neuvians TP. 2004.Determination of stable
housekeeping genes, differentially regulated target genes and sample integrity: BestKeeper—Excel-based tool using pair-wise correlations.Biotechnology Letters
26(6):509–515DOI 10.1023/B:BILE.0000019559.84305.47.
Ramakers C, Ruijter JM, Deprez R.HL, Moorman AF. 2003.Assumption-free analysis
of quantitative real-time polymerase chain reaction (PCR) data.Neuroscience Letters
339(1):62–66DOI 10.1016/S0304-3940(02)01423-4.
Rambow F, Job B, Petit V, Gesbert F, Delmas V, Seberg H, Meurice G, Van Otterloo
E, Dessen P, Robert C, Gautheret D, Cornell RA, Sarasin A, Larue L. 2015.New
Schonthaler HB, Lampert JM, Von Lintig J, Schwarz H, Geisler R, Neuhauss SCF.
2005.A mutation in the silver gene leads to defects in melanosome biogenesis and
alterations in the visual system in the zebrafish mutant fading vision.Developmental Biology284(2):421–436DOI 10.1016/j.ydbio.2005.06.001.
Singh AP, Nüsslein-Volhard C. 2015.Zebrafish stripes as a model for vertebrate colour
pattern formation.Current Biology25(2):R81–R92DOI 10.1016/j.cub.2014.11.013.
Small BC, Murdock CA, Bilodeau-Bourgeois AL, Peterson BC, Waldbieser GC. 2008.
Stability of reference genes for real-time PCR analyses in channel catfish (Ictalurus punctatus) tissues under varying physiological conditions.Comparative Biochem-istry and Physiology Part B: BiochemBiochem-istry and Molecular Biology151(3):296–304
DOI 10.1016/j.cbpb.2008.07.010.
Tang R, Dodd A, Lai D, McNabb WC, Love DR. 2007.Validation of zebrafish (Danio
re-rio) reference genes for quantitative real-time RT-PCR normalization.Acta Biochim-ica et BiophysBiochim-ica SinBiochim-ica39(5):384–390DOI 10.1111/j.1745-7270.2007.00283.x.
Vandesompele J, De Preter K, Pattyn F, Poppe B, Van Roy N, De Paepe A, Speleman F.
2002.Accurate normalization of real-time quantitative RT-PCR data by geometric
averaging of multiple internal control genes.Genome Biology3(7):RESEARCH0034.
Wittkopp N, Huntzinger E, Weiler C, Sauliere J, Schmidt S, Sonawane M, Izaurralde E.
2009.Nonsense-mediated mRNA decay effectors are essential for zebrafish
embry-onic development and survival.Molecular and Cellular Biology 29(13):3517–3528
DOI 10.1128/MCB.00177-09.
Yang CG, Wang XL, Tian J, Liu W, Wu F, Jiang M, Wen H. 2013.Evaluation of reference
genes for quantitative real-time RT-PCR analysis of gene expression in Nile tilapia (Oreochromis niloticus).Gene527(1):183–192 DOI 10.1016/j.gene.2013.06.013.
Zheng W, Sun L. 2011.Evaluation of housekeeping genes as references for quantitative