ISJ 13: 298-308, 2016
ISSN 1824-307X
RESEARCH REPORT
Transcriptome-wide analysis reveals candidate genes responsible for the asymmetric
pigment pattern in scallop
Patinopecten yessoensis
XJ Sun, LQ Zhou, ZH Liu, B Wu, AG Yang
Yellow Sea Fisheries Research Institute, Chinese Academy of Fishery Sciences, Qingdao 266071, China
Accepted September 14, 2016
Abstract
Yesso scallop
Patinopecten yessoensis
is an economically important marine bivalve species in
aquaculture and fishery in Asian countries. The colors of the left and right shells are obviously distinct,
typically having reddish-brown for the left and white for the right. This left-right asymmetric pigment
pattern is a very unique phenomenon among invertebrates, whereas the molecular mechanisms that
control regional differences in pigmentation are not clear. To better understand the left-right
asymmetric pigment pattern, we apply Illumina digital gene expression (DGE) to characterize the gene
expression profiles in left and right mantle tissues, and identify five differentially expressed genes,
including
Cytochrome P450
and other four unknown genes. Among the five genes, one gene shows
significantly higher expression in the right mantle, while other four exhibit significantly higher
expression in the left mantle. We further validate the DGE results by using quantitative real-time PCR
for
P450
, resulting in approximately 32-fold higher expression in the left mantle than that in the right
mantle. These findings will not only help assist our understanding of the sophisticated processes of
shell pigmentation in scallops, but also provide new insights into the adaptive evolution of phenotypes
to maximize survival that underlie the left-right asymmetric pigment pattern in molluscs.
Key Words: mollusc; Patinopecten yessoensis; digital gene expression; shell color; mantle; cytochrome P450
Introduction
Color variation is an interesting and a nearly universal mechanism for recognition, adaption, and camouflage in nature (Jiggins et al., 2001; Barbato et al., 2007; Mckinnon and Pierotti, 2010; Maan and Sefc, 2013). The different pigment patterns can occur in different individuals within and among populations, at different stages of development, and also probably in different regions of the body within a species, which are an excellent system to investigate how morphological differences arise (Candille et al., 2004). For decades, the color traits continue to be of great interest to evolutionary biologists because of their general tractability, importance in studies of selection, and potential role in speciation (Tanaka, 2006; Mckinnon and Pierotti, 2010). Moreover, color traits are also be attracted by geneticists and breeding scientists because of their commercial value in livestock and aquatic breeding industry
_______________________________________________________________________
Corresponding author: Aiguo Yang
Yellow Sea Fisheries Research Institute Chinese Academy of Fishery Sciences Qingdao 266071, China
E-mail: [email protected]
(Johansson et al., 1992; Colihueque, 2010; Fan et al., 2013). For the aquatic animals, the appearance of color pattern in fishes and molluscs can significantly influence consumer’s acceptance and affect the value of goods in markets (Guan and He, 2009; Colihueque, 2010). As a valuable trait in both scientific and commercial communities, studies aimed to clarify the genetic basis of traits related to color aquatic animals, are considered to be of great importance for the knowledge on micro-evolutionary forces, adaptive evolution and survival mechanisms (Kittilsen et al., 2009; Gunter
et al., 2011; Maan and Sefc, 2013; Takahashi et al., 2013).
(Fukuzawa et al., 1995; Jiggins et al., 2001; Candille et al., 2004; Yamada et al., 2010). As reported, several mechanisms may contribute to regional differences in vertebrate pigmentation, including alterations in the determination or migration of melanoblasts (Reedy et al., 1998), paracrine signal controlling (Furumura et al., 1996; Barsh et al., 2000), movement of pigment granules (Marks and Seabra, 2001), the asymmetric appearance of adult-type pigment cells (Yamada et al., 2010), and T-box gene action (Candille et al., 2004). In comparison with vertebrates, the mechanism underlying regional differences in pigmentation of invertebrates remain largely unknown.
For molluscs, shell color variations are not only known to exist in various kinds of species, but also may occur in different regions of the body within a species (Comfort, 1951; Kondo and Miura, 2010). The shells are specifically secreted by the mantle epithelium, where the anterior edge of the mantle tissue directs the formation of different structural layers of the shell, and controls the patterning of architectural and color features (Jackson et al., 2006). Molluscan shells contain a wide range of pigments, including melanins, indigoids, pyrroles, pterins, quinones and flavones, which are probably formed in the secretory cells and subsequently transported to the shell edges (Comfort, 1951; Nagai et al., 2007; Zhang et al., 2012; Bai et al., 2013; Sun et al., 2015). Recently, the molecular mechanism of shell color variations has been investigated in several bivalve species (Bai et al., 2013; Yue et al., 2015; Ding et al.,
2015), but regional differences in shell pigmentation within a species are still poorly understood.
The Yesso scallop Patinopecten yessoensis
is a cold water bivalve and naturally distributes along the coastline of the northern islands of Japan, northern Korean Peninsula, and Russian Primorye, Sakhalin and Kurile islands (Ito, 1991). Due to its large and edible adductor muscle, P. yessoensis is becoming one of the most important maricultural species in northern China (Xu et al., 2008; Cai et al., 2014). The colors of the left and right shells are obviously distinct, typically having reddish-brown for the left and white for the right, showing typically left-right asymmetric pigment pattern (Fig. 1). The pigmentation for left mantle tissue is slightly darker than the right one. This regional difference in pigmentation is a very unique phenomenon among invertebrates, which can serve as a striking example for studying asymmetric pigment pattern in invertebrates. To better understand the mechanisms underlying the region-specific differences in body morphology that give rise to different shell colors, detection of differentially expressed genes from the mantle is essential. In the present study, we applied Illumina RNA-Seq and digital gene expression (DGE) analysis to characterize the gene expression profiles, identified the differentially expressed genes between the left and right mantle, and help understand the molecular mechanism underlying the left-right asymmetric pigment pattern in this economically important species.
Table 1 The primer information used in quantitative real-time PCR (RT-PCR)
Gene_id Primers Size (bp) Tm (Ԩ)
actin F: CCAAAGCCAACAGGGAAAAG 163 55.0
R: TAGATGGGGACGGTGTGAGTG
comp51117_c0 F: GGCTGTGCACATGTGTAGTC 235 58.7
R: CCAACTTCCGGCTCAAAACT
comp96758_c0 F: TACCGTAGCTGCCCTGAAAA 246 59.0
R: CTTTCTTTCTTGGCGGCTGT
comp97294_c0 F: CCTACAACAGCGGATTCACG 256 59.0
R: CAACTATACGGTCCGGTCGA
comp99344_c0 F: ATCGGTGAAAGGGTTGAGGT 250 58.9
R: AAGTGCCACAGTTCGGTAGA
comp99344_c1 F: ACGGTGTTTGCTTAGGAGGA 216 59.0
R: CGACAGGACAGATGTGAGGT
Materials and Methods
Animal and tissue collection
Six scallops P. yessoensis (two-year old; 9.55 ± 0.42 cm) were obtained from a commercial hatchery in Yantai, China. The scallops were cultured in sand-filtered sea water at 14 ± 2 °C for two weeks before processing. The rearing methods were accordance with the previous study (Sun et al., 2015). The left and right mantle tissues of each scallop was dissected and stored in RNAlater (Ambion). Total RNA was isolated with Trizol Reagent (Invitrogen) and checked using the NanoPhotometer™ spectrophotometer (Implen, CA, USA) for RNA purity and quality. RNA integrity was assessed using the RNA Nano 6000 Assay Kit.
NGS library construction and sequencing
A total amount of 3 μg RNA per individual was used as input, and RNA samples of left mantle from three individuals were pooled in equal amounts to generate the mixed sample for the left mantle library. Similarly, RNA samples of right mantle from the same three individuals were used to generate the mixed sample for the right mantle library. Four libraries, including two biological replicates, were used for the Illumina sequencing in this study. Sequencing libraries were generated using NEBNext Ultra™ RNA Library Prep Kit for Illumina (NEB, USA) following manufacturer’s recommendations and index codes were added to attribute sequences to each sample. The mRNA was purified using poly-T oligo-attached magnetic beads. The first strand cDNA was synthesized using random hexamer primer, and second strand
cDNA synthesis was subsequently performed using DNA Polymerase I and RNase H. After adenylation of 3’ ends of DNA fragments, adaptors were ligated to prepare for hybridization. The fragments were purified with AMPure XP system (Beckman Coulter, Beverly, USA) to select cDNA fragments of 150~200 bp. The adaptor-ligated cDNA was kept at 37 °C for 15 min followed by 5 min at 95 °C. Finally, PCR products were purified and library quality was assessed on the Agilent Bioanalyzer 2100 system. The clustering of the index-coded samples was performed using TruSeq SR Cluster Kit v3-cBot-HS (Illumina) according to the manufacturer’s instructions. After cluster generation, the sequencing was carried out on an Illumina HiSeq 2000 platform that generated about 100 bp paired-end raw reads.
Quality control
Raw data (raw reads) of fastq format were first processed through in-house perl scripts, in order to remove reads containing adapters, reads containing ambiguous ‘N’ nucleotides (‘N’ ratio of more than 10 %) and reads with low quality (quality score of less than 5). All the downstream analyses were based on clean data with high quality. Meanwhile, Q20, Q30 and GC-content of the clean data were calculated for estimating the quality of clean data.
Aligning raw reads and differentially expressed genes analysis
counts obtained from the mapping results for each gene were used to estimate gene expression levels for each sample. We performed differential expression analysis for the left and right mantle
samples with biological replicates using the DESeq R package, which provides statistical routines for determining differential expression in digital gene expression data using a model based Table 2 Summary statistics for sequencing and data quality of RNA-Seq
Sample Raw Reads Clean Reads Clean Bases Error (%) Q20 Q30 GC Content (%)
left_1 10,061,486 9,952,872 1.00 G 0.03 98.10 93.56 42.17
left_2 19,330,562 19,176,083 1.92 G 0.03 98.22 93.88 41.16
right_1 16,885,161 16,737,085 1.67 G 0.03 98.19 93.76 41.35
right_2 18,024,935 17,853,507 1.79 G 0.03 98.12 93.59 41.56
Note: left_1, the left-end sequencing of the left mantle tissue; left_2 the right-end sequencing of the left mantle tissue; right_1, the left-end sequencing of the right mantle tissue; left_2 the right-end sequencing of the right mantle tissue.
on the negative binomial distribution. The resulting
P values were adjusted using the Benjamini and Hochberg’s approach for controlling the false discovery rate (Benjamini and Hochberg, 1995). The differentially expressed genes were assigned with an adjusted p-value lower than 0.05.
Quantitative real-time PCR
The seven tissues, including left mantle, right mantle, adductor muscle, gill, gonad, hepatopancreas and foot, were immediately dissected from the live scallops. These tissues were cleaned and then stored in RNAlater at −80 °C. Total RNAs were extracted using Trizol Reagent (Invitrogen) according to the manufacturer’s protocols. The qualities of RNA samples were assessed as described above. Three biological replicates were used for the analysis of quantitative real-time PCR on Applied Biosystems 7500 system. The primer information for quantitative real-time PCR was listed in Table 1. The transcripts level of each gene was normalized to the expression of β-actin and the
comparative Ct method (2-ᇞᇞCt
method) was used
to calculate the relative gene expression of the samples (Livak and Schmittgen, 2001). The expression data were subsequently subjected to one-way ANOVA followed by an LSD test for multiple comparisons, using SPSS 17.0 to determine whether there was any significant difference (p < 0.05).
Results
Overall statistics and reads
For the four samples (left_1, left_2, right_1 and right_2), there are a total of 64,302,144 raw reads generated by Illumina sequencing, which
yields a total of 6.37 G clean bases after quality filtering that remove reads containing adapters or ambiguous nucleotides and low quality reads (Table 2). The left mantle samples of left_1 and left_2 produces 1.00 G and 1.92 G cleaned reads, and the right mantle samples of right_1 and right_2 produces 1.67 G and 1.79 G cleaned reads. The cleaned reads produced in this study have been deposited in the NCBI SRA database (accession number: SRP059521). The similar values of Q20 percentage and Q30 percentage are found around 98 % and 94 %, and the same error rates of 0.03 % are observed in the four samples. The percentage of GC content for the clean reads was consistent among samples, varying from 41.1 % to 42.2 %. The obtained clean reads are then used for reads alignment with the reference transcriptome of P. yessoensis
(Sun et al., 2015), resulting in the high percentages of mapped reads of 85.00 %, 94.01 %, 93.13 % and 90.73 %, respectively.
Quality control of gene expression analysis
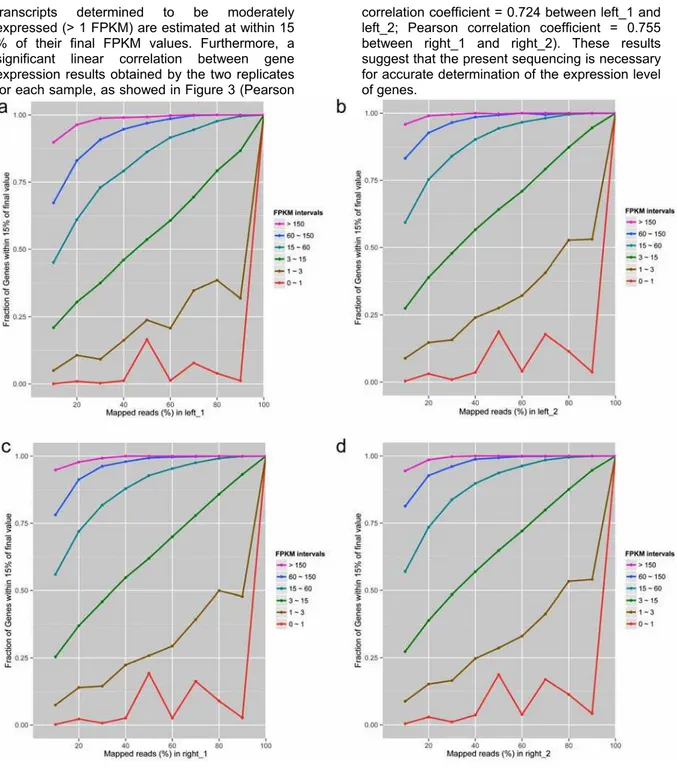
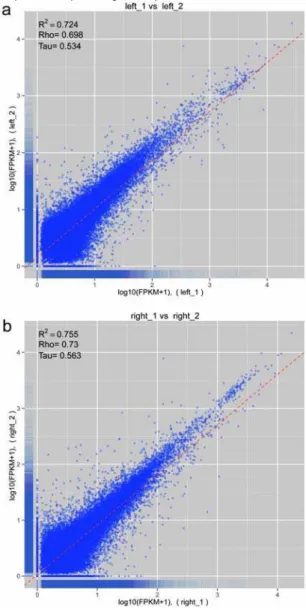
transcripts determined to be moderately expressed (> 1 FPKM) are estimated at within 15 % of their final FPKM values. Furthermore, a significant linear correlation between gene expression results obtained by the two replicates for each sample, as showed in Figure 3 (Pearson
correlation coefficient = 0.724 between left_1 and left_2; Pearson correlation coefficient = 0.755 between right_1 and right_2). These results suggest that the present sequencing is necessary for accurate determination of the expression level of genes.
Fig. 2 The saturation analysis of sequencing data. X-axis represents the percentage of mapped reads to reference transcriptome (%); Y-axis represents the fraction of genes within 15% of quantitative deviation. Each color line represents the saturation curve of different gene expression levels in terms of FPKM intervals. A, left_1 sample; B, left_2 sample; C, right_1 sample; D, right_2 sample.
Gene expression analysis
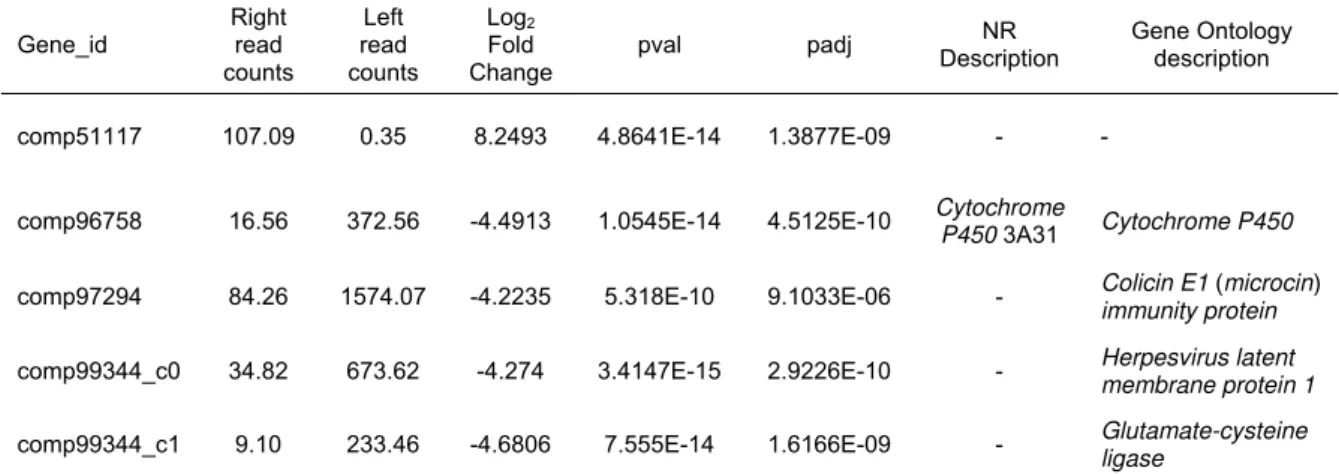
About 80,000 genes identified at different levels of expression for each library sample are selected for further analysis using DESEQ (Anders and Huber, 2010). The applied DESEQ package has pointed five significantly differentially expressed genes (padj < 0.01), including comp51117, comp96758, comp97294,
comp99344_c0, and comp99344_c1 (Table 3). Among the five screened genes, one up-regulated gene shows significantly higher expression in the right mantle, whereas four down-regulated genes exhibit significantly higher expression in the left mantle (Fig. 4). The highest obtained log2 ratio
down-regulated genes is -4.68.
Functional annotation of the screened genes and qPCR validation
Among the five differentially expressed genes, only one (comp96758) is annotated by NR database which encodes Cytochrome P450 3A31, while other four are not annotated by NR (Table 3). Among the four unannotated genes, three (comp97294, comp99344_c0, comp99344_c1) are enriched by Gene Ontology Biological Pathway, relating to colicin E1 (microcin) immunity protein, herpesvirus latent membrane protein 1
(LMP1), and glutamate-cysteine ligase, respectively. However, comp51117 is an unknown gene which is not annotated by any database so far.
The validation of RNA-Seq results was performed using quantitative real-time PCR (RT-PCR) technology by the estimation of relative
expression level (2-ᇞᇞCt
) for the left and right
mantle samples in additional animals. Statistically, the significantly higher level of P450 expression is detected in the left mantle, approximately 32-fold higher than that in the right mantle (p < 0.01; Fig. 5). The significantly different expression of P450
between the left and right mantle revealed by RT-PCR is in accordance with the RNA-Seq results.
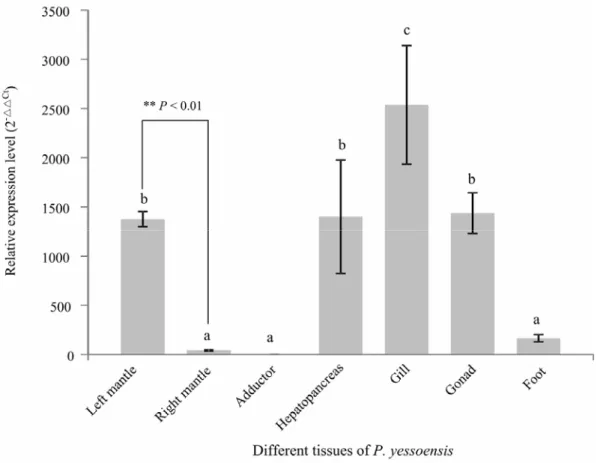
To examine the spatial mRNA expression pattern of P450 in the adult P. yessoensis, quantitative RT-PCR was also used to detect the expression of P450 in five other tissues, including adductor, gill, gonad, hepatopancreas, and foot (Fig. 5). Combined with the results of P450
expression in the left and mantle tissues, the RT-PCR results indicate that the expression of
P450 is significantly different among the scallop tissues (df = 6, F = 11.19, p < 0.01). The highest expression level was detected in the gill tissue, which is significantly higher than that in other tissues (LSD post hoc comparisons, p < 0.05). Moderate expression of P450 was observed in the three tissues of left mantle, gonad, and hepatopancreas, showing no significant difference among them (p > 0.05). The above four tissues exhibited significantly higher expression levels than those of right mantle, adductor, and foot (LSD post hoc comparisons, p < 0.05), and the lowest expression of P450 was observed in the tissue of adductor muscle.
Discussion
Bivalve mantle is the key organ that secretes biomineralization proteins inducing shell deposition and pigmentation, which direct the formation of different structural layers of the shell, and controls the patterning of architectural and color features (Comfort, 1951; Wilbur and Saleuddin, 1983; Addadi et al., 2006; Jackson et al., 2006). In the present study, two mantle tissues collected from the same scallops responsible for
reddish-brown and white shell colors, were used to investigate the transcriptome differences by using Illumina digital gene expression (DGE) tag profiling. Due to lack of genome resources, DGE tags were mapped to the previously assembled transcriptome (Sun et al., 2015), and identified five differentially expressed transcripts related to the left-right asymmetric pigment pattern.
Comparing with other genome-wide expression profiling platforms, such as microarray, Illumina DGE is an efficient and economic choice to study mRNA expression level in non-model organisms without a reference genome, which provides a major advance in robustness, comparability, richness, technical reproducibility of expression profiling data (Marioni et al., 2008; Bai
Fig. 3 The correlation for two biological replicates of the left and right mantle assessed by Pearson's correlation coefficient.
et al., 2013). However, the development and
generated by next generation sequencing systems is critically important for gene expression studies (Kvam, 2012). Several programs used for differential expression analysis have been developed for next generation sequencing technology, such as DESeq (Anders and Huber, 2010), DEGseq (Wang et al., 2010), edgeR (Robinson et al., 2010), TSPM (Auer and Doerge,
2011), and NBPSeq (Di et al., 2011). In the present study, DESeq is chosen because it has relatively low rate of false positives and its algorithm performs more conservatively than edgeR and NBPSeq (Robles et al., 2012; Guo et al., 2013). Moreover, the complicated RNA-Seq experiments during the process of RNA isolation and library preparation may cause some errors and Table 3 Identification of differentially expressed genes between the left and right mantle of Patinopecten yessoensis
Gene_id
Right read counts
Left read counts
Log2
Fold Change
pval padj NR
Description
Gene Ontology description
comp51117 107.09 0.35 8.2493 4.8641E-14 1.3877E-09 - -
comp96758 16.56 372.56 -4.4913 1.0545E-14 4.5125E-10 Cytochrome P450 3A31 Cytochrome P450
comp97294 84.26 1574.07 -4.2235 5.318E-10 9.1033E-06 - Colicin E1 (microcin)
immunity protein
comp99344_c0 34.82 673.62 -4.274 3.4147E-15 2.9226E-10 - Herpesvirus latent
membrane protein 1
comp99344_c1 9.10 233.46 -4.6806 7.555E-14 1.6166E-09 - Glutamate-cysteine
ligase
Fig. 4 The volcano plots for RNA-Seq showing differentially expressed genes (right mantle vs. left mantle). X-axis represents log2 (fold change), and Y-axis represents adjusted p-values in terms of -log10 (padj) for the RNA-Seq
biases for the estimation of gene expression (Wang et al., 2009; Bullard et al., 2010). Additionally, the detection power of differential expression analysis for the count data is limited by biological replicates, rather than technical replicates (Anders and Huber, 2010; Robles et al., 2012). Therefore, to obtain the most reliable gene expression measurements in the present study,
we performed the Illumina DGE analysis by using the left and right tissues collected from the same scallops, designing biological replicates, and further validated by RT-PCR. All these conditions have enabled us to narrow down the considerable number of differentially expressed genes to a small number of candidates, which warrant further investigation.
Fig. 5 Validation of RNA-Seq results by quantitative real-time PCR and relative gene expression in different tissues of P. yessoensis. Error bars represent the standard error of three replicates (n = 3). Values marked with different letters differed significantly from each other (p < 0.05).
Five candidate genes were identified by Illumina DGE analysis, including Cytochrome P450 and other four unannotated genes, to express significantly different between the left and right mantle, which are suggested to be responsible for the left-right asymmetric pigment pattern. Although three of the four are enriched by Gene Ontology Biological Pathway, their functions are largely unknown due to the limited genomic resource. The P450 genes are found in the genomes of virtually all organisms, which have a wide spectrum of functions, contributing to carbon source assimilation, biosynthesis of hormones, structural components and degradation of xenobiotics in living organisms (Werck-Reichhart and Feyereisen, 2000; Nelson, 2013). In particular, the cytochrome P450 genes play critical roles in flavonoid biosynthetic pathways especially in plants, which are responsible for the variation of flower colors
inhibit tyrosinase activity and enhance melanogenesis due to their ability to chelate the copper in the active site, interfering with mammalian pigmentation (Kim and Uyama, 2005; Carletti et al., 2014; Takekoshi et al., 2014). For marine molluscs, flavonoids are largely synthesized in microalgae and ingested by filter-feeding (Goiris et al., 2014). We therefore speculate that the higher expression level of cytochrome P450 in the left mantle than the right mantle of P. yessoensis may be related to flavonoid biosynthesis due to the ingested microalgae, which could probably inhibit tyrosinase activity and promote melanin biosynthesis, and eventually result in the reddish-brown pigmentation in the left shell.
The evidences for tissue-specific gene expression of P450 have been uncovered in this study. As reported, the gills of bivalve molluscs are composed of curtains of filaments held in alignment by apposed patches of adherent cilia, which is the first tissue in contact with xenobiotics (Reed-miller and Greenberg, 1982). The present results revealing the highest level of P450
expression in gill of P. yessoensis may suggest the potential role of P450 involved in degradation of xenobiotics (Carletti et al., 2014). However, further study is still needed to investigate the functional role of P450 in this species. In the natural living condition of P. yessoensis, the left shell with brown-color is always at the upper side position, while the right shell with white-color is located at the bottom contacting with the seafloor. The nature living state of the scallops is potentially associated with their left-right asymmetric pigment pattern, implying the adaptive evolution of external phenotypes in this species. In the present study, the differently expressed genes between the two shells are speculated to be responsible for the appearance of dark color in the scallop, which may have the potential shielding effects relating to molluscan defensive adaptations against predators in order to maximize survival when they live in the natural environment. The present findings will provide insights into the molecular basis for the left-right asymmetric pigment pattern in scallops, as well as other molluscs.
Conclusion
In conclusion, we detect the significantly different expression of Cytochrome P450 and four unannotated genes between pigmented (left) and non-pigmented shells (right) in the scallop P.
yessoensis by transcriptome sequencing of the
mantle tissue collected from the same scallops. The identified genes are suggested to be associated with the left-right asymmetric pigment pattern in the scallops. The findings will provide insights into the molecular basis for the left-right asymmetric pigment pattern in molluscs, and supply valuable information for their adaptive evolution of external phenotypes, which may maximize survival of scallops in natural condition.
Acknowledgements
This work is supported by the grants from
the Basic Scientific Research Fund of YSFRI (No. 2060302201516054), Zhejiang Provincial Top Key Discipline of Biological Engineering (KF2015005).
References
Addadi L, Joester D, Nudelman F, Weiner S. Mollusk shell formation: a source of new concepts for understanding biomineralization processes. Chemistry 12: 980-987, 2006. Anders S, Huber W. Differential expression
analysis for sequence count data. Genome Biol. 11: 79-82, 2010.
Auer PL, Doerge RW. A two-stage poisson model for testing RNA-Seq data. Stat. Appl. Genet. Mol.Biol.10: 1-26, 2011.
Bai Z, Zheng H, Lin J, Wang G, Li J. Comparative analysis of the transcriptome in tissues secreting purple and white nacre in the pearl mussel Hyriopsis cumingii. PLOS ONE 8: e53617, 2013.
Barbato M, Bernard M, Borrelli L, Fiorito G. Body patterns in cephalopods “polyphenism” as a way of information exchange. Pattern Recogn. Lett. 28: 1854-1864, 2007.
Barsh G, Gunn T, He L, Schlossman S, Duke-Cohan J. Biochemical and genetic studies of pigment-type switching. Pigment Cell Res. 13: 48-53, 2000.
Benjamini Y, Hochberg Y. Controlling the false discovery rate - a practical and powerful approach to multiple testing. J. R. Stat. Soc. 57: 289-300, 1995.
Bullard JH, Purdom E, Hansen KD, Dudoit S. Evaluation of statistical methods for normalization and differential expression in mRNA-Seq experiments. BMC Bio Informatics 11: 504-520, 2010.
Cai Z, Sun X, Yang A. Effects of delayed first feeding on larval growth and survival of Yesso scallop (Patinopecten yessoensis). Int. J. Biol. 6: 37, 2014.
Candille SI, Van Raamsdonk CD, Chen C, Kuijper S, Chen-Tsai Y, Russ A, et al. Dorsoventral patterning of the mouse coat by Tbx15. PLOS Biol. 2: E3, 2004.
Carletti G, Nervo G, Cattivelli L. Flavonoids and melanins: a common strategy across two kingdoms. Int. J. Biol. Sci. 10: 1159-70, 2014.
Colihueque N. Genetics of salmonid skin pigmentation: clues and prospects for improving the external appearance of farmed salmonids. Rev. Fish Biol. Fish. 20: 71-86, 2010.
Comfort A. The pigmentation of molluscan shells. Biol. Rev. 26: 285-301, 1951.
Di YM, Schafer DW, Cumbie JS, Chang JH, Schafer DW, Cumbie JS, et al. The NBP negative binomial model for assessing differential gene expression from RNA-Seq. Stat. Appl. Genet. Mol. Biol. 10: 1-28, 2011. Ding J, Zhao L, Chang Y, Zhao W, Du Z, Hao Z.
Transcriptome sequencing and characterization of Japanese scallop
Patinopecten yessoensis from different
2015.
D'Ischia M, Wakamatsu K, Cicoira F, Mauro ED, Garcia-Borron JC, Commo S, et al. Melanins and melanogenesis: from pigment cells to human health and technological applications. Pigment Cell Melanoma Res. 28: 520-544, 2015.
Fan R, Xie J, Bai J, Wang H, Tian X, Bai R, et al. Skin transcriptome profiles associated with coat color in sheep. BMC Genomics 14: 3001-3008, 2013.
Fishlyn DA, Phillips DW. Chemical camouflaging and behavioral defenses against a predatory seastar by three species of gastropods from the surfgrass Phyllospadix community. Biol. Bull. 1: 34-48, 1980.
Fukuzawa T, Samaraweera P, Mangano FT, Law JH, Jt B. Evidence that mif plays a role in the development of pigmentation patterns in the frog. Dev. Biol. 167: 148-158, 1995.
Furumura M, Sakai C, Abdel-Malek Z, Barsh GS, Hearing VJ. The interaction of agouti signal protein and melanocyte stimulating hormone to regulate melanin formation in mammals. Pigment Cell Res. 9: 191-203, 1996.
Goiris K, Muylaert K, Voorspoels S, Noten B, Paepe DD, Baart GJE, et al. Detection of flavonoids in microalgae from different evolutionary lineages. J. Phycol. 50: 483-492, 2014.
Guan Y, He MX. Progress on shell coloration polymorphism in seashells. Mar. Sci. 28: 108-114, 2009. (In Chinese)
Gunter HM, Clabaut C, Salzburger W, Meyer A. Identification and characterization of gene expression involved in the coloration of cichlid fish using microarray and qRT-PCR approaches. J. Mol. Evol.72: 127-137, 2011. Guo Y. Evaluation of read count based RNA-Seq
analysis methods. BMC Genomics 14: 163, 2013.
Hatlestad GJ, Sunnadeniya RM, Akhavan NA, Gonzalez A, Goldman IL, Mcgrath JM, et al. The beet r locus encodes a new cytochrome p450 required for red betalain production. Nature Genet. 44: 816-20, 2012.
Ito H. Patinopecten (Mizuhopecten) yessoensis. In: Shumway SE (ed.), Scallops: Biology, Ecology and Aquaculture, Elsevier, Amsterdam, 1991.
Jackson DJ, McDougall C, Green K, Simpson F, Wörheide G, Degnan BM. A rapidly evolving secretome builds and patterns a sea shell. BMC Biology 4: 40, 2006.
Jiggins CD, Naisbit RE, Coe RL, Mallet J. Reproductive isolation caused by colour pattern mimicry. Nature 411: 302-305, 2001. Johansson M, Ellegren H, Marklund L,
Gustavsson U, Ringmar-Cederberg E, Andersson K, et al. The gene for dominant white color in the pig is closely linked to alb and pdgfra on chromosome 8. Genomics 14: 965-969, 1992.
Kim YJ, Uyama H. Tyrosinase inhibitors from natural and synthetic sources: structure, inhibition mechanism and perspective for the future. Cell Mol. Life Sci. 62: 1707-1723,
2005.
Kittilsen S, Schjolden J, Beitnes-Johansen I, Shaw JC, Pottinger TG, Sørensene C, et al. Melanin-based skin spots reflect stress responsiveness in salmonid fish. Horm. Behav. 56: 292-298, 2009.
Kondo S, Miura T. Reaction-diffusion model as a framework for understanding biological pattern formation. Science 329: 1616-20, 2010.
Kubista V. Flavones in Helix pomatia L. Experientia 5: 100, 1950.
Kvam VM. A comparison of statistical methods for detecting differentially expressed genes from RNA-Seq data. Am. J. Botany 99: 248-256, 2012.
Li B, Dewey CN. RSEM: accurate transcript quantification from RNA-Seq data with or without a reference genome. BMC Bioinformatics 12: 93-99, 2011.
Livak KJ, Schmittgen TD. Analysis of relative gene expression data using real-time quantitative
PCR and the 2-ᇞᇞCt
method. Methods 25:
402-408, 2001.
Maan ME, Sefc KM. Colour variation in cichlid fish: developmental mechanisms, selective pressures and evolutionary consequences. Semin. Cell Dev. Biol. 24: 516-528, 2013. Marioni J, Mason C, Mane S, Stephens M, Gilad Y.
RNA-seq: An assessment of technical reproducibility and comparison with gene expression arrays. Genome Res. 18: 1509-1517, 2008.
Marks MS, Seabra MC. The melanosome: membrane dynamics in black and white. Nature Rev. Mol. Cell Biol. 2: 738-748, 2001. Martin W, Rujan T, Richly E, Hansen A, Cornelsen
S, Lins T, et al. Evolutionary analysis of
arabidopsis, cyanobacterial, and chloroplast genomes reveals plastid phylogeny and thousands of cyanobacterial genes in the nucleus. Proc. Natl. Acad. Sci. USA 99: 12246-12251, 2002.
Mckinnon JS, Pierotti MER. Colour polymorphism and correlated characters: genetic mechanisms and evolution. Mol. Ecol. 19: 5101-5125, 2010.
Nagai K, Yano M, Morimoto K, Miyamoto H. Tyrosinase localization in mollusc shells. Comp. Biochem. Physiol. 146B: 207-214, 2007.
Nelson DR. A world of cytochrome p450s. Philos. Trans. R. Soc. A 368: 20120430, 2013. Reed-Miller C, Greenberg MJ. The ciliary
junctions of scallop gills: the effects of cytochalasins and concanavalin. Biol. Bull. 163: 187-196, 1982.
Robinson MD, Mccarthy DJ, Smyth GK. Edger: a bioconductor package for differential expression analysis of digital gene expression data. Bioinformatics 26: 139-140, 2010.
Robles JA, Qureshi SE, Stephen SJ, Wilson SR, Burden CJ, Taylor JM. Efficient experimental design and analysis strategies for the detection of differential expression using RNA-sequencing. BMC Genomics 13: 253-258, 2012.
Slominski A, Tobin DJ, Shibahara S, Wortsman J. Melanin pigmentation in mammalian skin and its hormonal regulation. Physiol. Rev. 84: 1155-1228, 2004.
Sun X, Liu Z, Zhou L, Wu B, Dong Y, Yang A. Integration of next generation sequencing and EPR analysis to uncover molecular mechanism underlying shell color variation in scallops. PLOS ONE 11: e0161876, 2016. Sun X, Yang A, Wu B, Zhou L, Liu Z.
Characterization of the mantle transcriptome of Yesso scallop (Patinopecten yessoensis): identification of genes potentially involved in biomineralization and pigmentation. PLOS ONE 10: e0122967, 2015.
Takahashi T, Sota T, Hori M. Genetic basis of male colour dimorphism in a lake tanganyika cichlid fish. Mol. Ecol. 22: 3049-3060, 2013. Takekoshi S, Nagata H, Kitatani K. Flavonoids
enhance melanogenesis in human melanoma cells. Tokai J. Exp. Clin. Med. 39: 116-121, 2014.
Tanaka Y. Flower colour and cytochromes p450. Philos. Trans. R. Soc. A 5: 283-291, 2006. Wang LK, Feng ZX, Wang X, Wang XW, Zhang
XG. DEGseq: an R package for identifying differentially expressed genes from RNA-seq data. Bioinformatics 26: 136-138, 2010. Wang Z, Gerstein M, Snyder M. RNA-Seq: a
revolutionary tool for transcriptomics. Nature Rev. Genet. 10: 57-63, 2009
Werck-Reichhart D, Feyereisen R. Cytochromes p450: a success story. Genome Biol. 1: 28-31, 2000
Wilbur KM, Saleuddin ASM. Shell formation. The Mollusca4: 235-287, 1983.
Williams ST. Molluscan shell colour. Biol. Rev. doi: 10.1111/brv.12268, 2016.
Xu K, Li Q, Kong L, Yu R. A first-generation genetic map of the Japanese scallop
patinopecten yessoensis-based AFLP and
microsatellite markers. Aquaculture Res. 40: 35-43, 2008.
Yamada T. Origin of adult-type pigment cells forming the asymmetric pigment pattern, in Japanese flounder (paralichthys olivaceus). Dev. Dyn. 239: 3147-3162, 2010.
Yue X, Nie Q, Xiao G, Liu B. Transcriptome analysis of shell color-related genes in the clam meretrix meretrix. Mar. Biotechnol. 17: 364-74, 2015.
Zhang GF, Fang XD, Guo XM, Li L, Luo RB, Xu F,
et al. The oyster genome reveals stress