Submitted2 May 2016
Accepted 25 August 2016
Published27 September 2016
Corresponding author
Magdalena Szenejko,
Academic editor
Blanca Landa
Additional Information and Declarations can be found on page 16
DOI10.7717/peerj.2489
Copyright
2016 Szenejko et al.
Distributed under
Creative Commons CC-BY 4.0
OPEN ACCESS
Genetic diversity of
Poa pratensis
L.
depending on geographical origin and
compared with genetic markers
Magdalena Szenejko1,2, Przemysław Śmietana1,2and Edyta Stępień3 1Faculty of Biology, Department of Ecology and Environmental Protection, Institute for Research on
Biodiversity, University of Szczecin, Szczecin, Poland
2Faculty of Biology, Molecular Biology and Biotechnology Center, University of Szczecin, Szczecin, Poland 3Department of Plant Taxonomy and Phytogeography, Institute for Research on Biodiversity, Faculty of
Biology, University of Szczecin, Szczecin, Poland
ABSTRACT
Background. Poa pratensisis one of the most common species of meadow grass in
Europe. Most cultivars of the species found in Poland were originally derived from its ecotypes. We compared the effectiveness of the RAPD and ISSR methods in assessing the genetic diversity of the selected populations ofP. pratensis. We examined whether these methods could be useful for detecting a possible link between the geographical origin of a given population and its assessed genetic variation.
Methods. The molecular markers RAPD and ISSR were used and their efficiency
compared using, inter alia, statistical multivariate methods (UPGMA and PCA).
Results. The low value of Dice’s coefficient (0.369) along with the significantly
high percentage of polymorphic products indicates a substantial degree of genetic diversity among the studied populations. Our results found a correlation between the geographical origin of the studied populations and their genetic variations. For ISSR, which proved to be the more effective method in that respect, we selected primers with the greatest differentiating powers correlating to geographical origin.
Discussion. The populations evaluated in this study were characterized by a high genetic
diversity. This seems to confirm the hypothesis that ecotypes ofP. pratensisoriginating from different regions of Central Europe with different terrain structures and habitat conditions can be a source of great genetic variability.
SubjectsBiodiversity, Ecology, Ecosystem Science, Molecular Biology, Plant Science
Keywords Ecotypes, Genetic diversity, Microsatellite primers, PCA,Poa pratensis, Geographical distribution, RAPD and ISSR methods, Grasses
INTRODUCTION
cultivars of the species were derived from natural grasslands, often from individual plants.
Because apomixis is the dominant manner of reproduction inP. pratensis,achieving high
genetic variability within individual populations is rather difficult (Müntzing, 1933;Muller, 1964;Felsenstein, 1974;Pamilo, Nei & Li, 1987;Huff & Bara, 1993). In addition to vegetative and sexual reproduction processes, the plant can also reproduce asexually from seeds, which are formed through apospory or diploid parthenogenesis and without any fertilization process (Mazzucato, Den Nijs & Falcinelli, 1996;Albertini et al., 2001;Spillane, Steimer & Grossniklaus, 2001;Albertini et al., 2005;Matzk et al., 2005). As a result, offspring and parent plants may be genetically identical (Albertini et al., 2004;Carneiro, Dusi & Ortiz, 2006). This implies that the initial forms i.e., the different ecotypes and cultivars used for breeding did not produce new combinations of genes. As a result, cultivars derived from such initial material have similar or related genotypes. The results of our earlier research, which concerned the evaluation of genetic variability in cultivars and ecotypes ofP. pratensisnative to Central Europe using RAPD markers, confirmed the considerable genetic relatedness of those cultivars and ecotypes (Szenejko, Filip & Słominska-Walkowiak, 2009;Szenejko & Rogalski, 2015). The populations evaluated in those studies originated from Lower Silesia and Podlasie, regions of Poland with different habitats and climatic conditions. The ecotypes analyzed in those previous studies differed with respect to their phenotypic traits but showed little genetic variability, whereas the populations in the present study were selected from habitats as diverse as possible, i.e., lowlands, uplands and mountains. The ecotypes in this study originated from the western and southern regions of Poland as well as from the Kujawy and Podlasie regions. It was assumed that long distances between regions would affect habitat conditions, and that natural spatial barriers would cause the greatest genotypic di-versity among the research material. In addition, three cultivars (including two of the oldest Polish cultivars ofP. pratensis) were included in our research and subjected to the same anal-yses. All the plant material was evaluated for genetic diversity using two systems of markers based on DNA amplification (RAPD and ISSR). In the present study, the effectiveness of the methods in assessing the genetic diversity of the selected forms ofP. pratensiswas com-pared. Furthermore, we investigated whether these methods could be useful in establishing a link between the geographical origin of a given population and their assessed genetic variability. Primers with the greatest differentiating powers correlating with geographical distance were selected for ISSR, the more effective method in that respect. Principal Compo-nent Analysis (PCA) was used for this procedure, which was performed on the chosen values of DNA amplification products obtained in the presence of those selected ISSR markers with the highest genetic differentiating power with respect to the studied forms ofP. pratensis.
MATERIALS & METHODS
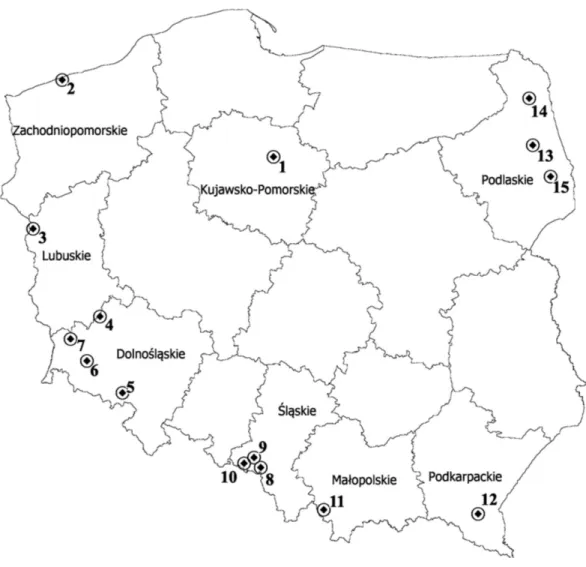
Plant materialFigure 1 Map depicting the locations of the 15 populations ofP. pratensisused in the study.1, pom06 175; 2, zap00 240; 3, lbs05 170; 4, lbs05 628; 5, dos01 333; 6, dos01 405; 7, dos01 468; 8, bes03 373; 9, bes03 379; 10, bes03 35; 11, ora03 178; 12, bie04 189; 13, pod02 215; 14, pod02 172; 15, pod02 317.
(IHAR); the caryopses used for establishing this collection were collected during field trips organized by the staff of the Botanical Garden and originated from different geographical regions of Poland, including 8 different voivodships (provinces) (Fig. 1andTable 1). The main criteria when harvesting the caryopses were the diversity of plant material and variety of habitats. The seed material was collected from wastelands and arable land (meadows and pastures), as well as from environmentally valuable areas. The assessment of genetic diversity was performed for three cultivars used for different purposes, including ‘Eska 46,’ one of the oldest Polish fodder cultivar and two lawn cultivars: ‘Limousine’, an apomictic uniclonal German cultivar, and ‘Alicia,’ the oldest Polish lawn cultivar.
DNA isolation
Genomic DNA was isolated from the plant tissue using magnetic beads (Novabeads Plant DNA STANDARD Purification KIT), following the procedure for monocotyledons and the
Table 1 Ecotypes ofP. pratensisanalyzed in the study and the locations where their caryopses were collected.
Ecotype Town/Place Latitude Longitude Habitat
pom06 175 Wielkie Stwolno 53◦26′34
.1′′N 18◦39′25.8′′E Vistula River oxbow lake
zap00 240 Łuk¸ecin 54◦
02′
58.4′′N 14◦52′03.7′′E Beach
lbs05 170 Owczary 52◦28′16
.3′′N 14◦39′08.0′′E Ostnicowy nature reserve lbs05 628 Przemków 51◦32′50
.6′′N 15◦46′33.4′′E Meadow dos01 333 Rybnica Leśna II 50◦
42′
08.5′′N 16◦18′00.3′′E Pasture dos01 405 Dziwiszów–Góry Kaczawskie 50◦57′39
.4′′N 15◦49′23.6′′E Meadow dos01 468 Oleszna Podgórska 51◦21′02
.3′′N 15◦28′12.1′′E Meadow bes03 373 Ustroń–Wielka Czantoria 49◦
40′
45.6′′N 18◦47′42.7′′E Mountain meadow bes03 379 Ustroń–Polana Goryczkowa 49◦41′05
.6′′N 18◦46′58.6′′E Meadow pasture bes03 354 Jaworzynka 49◦31′20
.2′′N 18◦51′31.2′′E Meadow ora03 178 Lipnica Wielka 49◦
27′
05.3′′N 19◦37′40.6′′E Meadow
bie04 189 Płonna 49◦26′11
.7′′N 22◦07′05.9′′E Wasteland
pod02 215 Lipina 53◦19′59
.6′′N 23◦25′28.5′′E Meadow/pasture
pod02 172 Walne 53◦
58′
20.0′′N 23◦04′04.6′′E Meadow
pod02 317 Pieńki 53◦03′32
.3′′N 23◦38′47.2′′E Pasture
100–150 mg of material was taken from 80 random etiolated seedlings. The DNA was isolated in two repetitions.
RAPD method
RAPD analysis, based on random amplification of polymorphic DNA, was performed
according to the modified method described byWilliams et al. (1990). Sixty-nine primers
were tested and 7 were chosen to evaluate RAPD polymorphism (Table 2). The amplification
reactions were performed in a T100TM Thermal Cycler (Bio-Rad Polska). The thermal
profile proposed byRajasekar, Fei & Christians (2005)was used: initial denaturation for 5 min at 95 ◦
C, then 94 ◦
C—1 min, 37 ◦
C—90 s, and 72 ◦
C—1 min in 45 cycles, with a final elongation for 7 min. The reactions were carried out on a total volume of 25µl containing
the following ingredients: 1xbufor for PCR reaction with Mg2+
(Novazym, Poland), 1.5
mM MgCl2, 0.2 mM dNTPs, 1.0µM primer, 1.25 U RedAllegroTaqPolymerase (Novazym,
Warszawa, Poland) and 125 ng of DNA.
ISSR method
ISSR analysis was performed following the modified method described byZi¸etkiewicz,
Rafalski & Labuda (1994)and the experimental conditions optimized byWang (2010). Having pretested 66 microsatellite primers, 13 of these (Oligo IBB PAN, Poland) were
chosen to evaluate ISSR polymorphism (Table 2). The reaction mixture, 25µl in volume,
contained: 1xbufor for the PCR reaction with Mg2+
(Novazym, Poland), 1.5 mM MgCl2,
0.25 mM dNTP, 0.4µM of primer 1 U RedAllegroTaqPolymerase (Novazym, Poland)
and 50 ng of DNA.
The amplification reactions were carried out in a T100TM Thermal Cycler (Bio-Rad
Polska) for 40 cycles. The ISSR PCR reaction was as follows: initial denaturation at 94 ◦
Table 2 The sequences of primers used in the study.Random amplification of polymorphic DNA was held in the presence of 7 10-nucleotide primers manufactured by Oligo IBB PAN, Poland. 13 microsatel-lite primers were used for the ISSR-PCR reaction. Most of them were dinucleotides composed of 17 and 18 bp.
Primer Sequence Primer Sequence
RAPD 5′–3′ ISSR 5′–3′
B10 CTGCTGGGAC 807 (AG)8T
B17 AGGGAACGAG 808 (AG)8C
C16 CACACTCCAG 810 (GA)8T
F05 CCGAATTCCC 811 (GA)8C
G19 GTCAGGGCAA 834 (AG)8YT
M14 AGGGTCGTTC 840 (GA)8YT
P08 ACATCGCCCA 841 (GA)8YC
857 (AC)8YG
888 BDB(CA)7
R07 (AC)8YT
M09 (AC)8YG
N01 CA(GT)8
TGA (TGA)6A
Notes.
Y, T or C;B, C, G or T;D, A, G or T.
for 4 min, then 94 ◦
C—30 s, 52 ◦
C—45 s, 72 ◦
C—2 min, with a final elongation carried out at 72 ◦
C for 7 min.
Data analysis
The resulting RAPD and ISSR amplification products were separated on 2.0% agarose gel
with ethidium bromide (5µg/ml; Sigma-Aldrich) in a TAE buffer for 4–5 h. Visualization,
documentation and analysis of the results were carried out using Gel DocTMXR+and
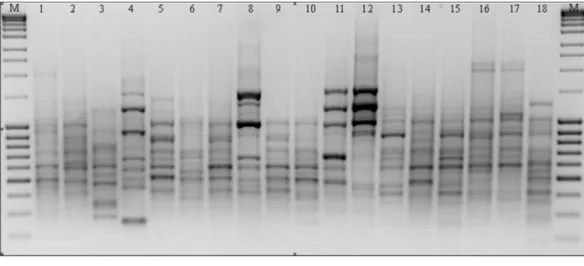
Figure 2 RAPD patterns amplified with primer M14 forP. pratensis. M, MassRulerTMLadder mix, ready-to-use (Thermo Scientific); 1, pom06 175; 2, zap00 240; 3, lbs05 170; 4, lbs05 628; 5, dos01 333; 6, dos01 405; 7, dos01 468; 8, bes03 373; 9, bes03 379; 10, bes03 354; 11, ora03 178; 12, bie04 189; 13, pod02 215; 14, pod02 172; 15, pod02 317; 16, ‘Alicia’; 17, ‘Limousine’; 18, ‘Eska 46.’
location of the place of origin of particular ecotypes, was used as the target matrix. These analyses were carried out using the STATISTICA 10.0 PL statistical package.
RESULTS
RAPD analysisIn the course of RAPD analysis, in total 246 amplification products were obtained for
which 100% polymorphism was demonstrated (Table 3). The primers chosen to evaluate
polymorphism generated bands in a wide size range: from 149 bp to 2,367 bp in the presence of primer C16. The greatest number of amplicons (43) was obtained as the result of reactions with primers G19 and M14 (Fig. 2). The primers used for the analysis initiated the synthesis of 79 specific amplification products which differentiated the studied forms ofP. pratensis. Of these, the largest number of DNA fragments (16) which had a unique composition were obtained in reaction with the M14 primer (Fig. 2). As many as 68 specific products were found for the ecotypes, with the largest number of them in a population from Silesia (bes03 373). In the presence of six primers, we were able to generate 15 products with a unique composition, ranging in size from 149 bp (for C16) to 1478 bp (for M14). Unique DNA fragments of approximately the same size were identified in amplification reactions with different primers. A significant number of specific bands were also identified for two ecotypes, one from Podkarpacie (bie04 189) and the other originating from the borderland region of Lubuskie and Lower Silesian voivodships (provinces) (lbs05 628) 11 and 10 bands respectively.
ISSR analysis
Table 3 RAPD and ISSR primers used, total number of scored bands (NSB), number of polymor-phic bands (NPB), their unique bands (NUB) and percentage of polymorphism bands (PPB) for each primer.
Name of primer Size range (bp) NSB NPB NUB PPB
RAPD
B10 213–1,867 35 35 11 100
B17 209–1,483 32 32 7 100
C16 149–2,367 33 33 15 100
F05 316–2,366 34 34 11 100
G19 201–1,902 43 43 9 100
M14 226–2,243 43 43 16 100
P08 179–1,173 26 26 10 100
Total 149–2,367 246 246 79 –
ISSR
807 341–1,974 23 23 1 100
808 325–3,105 43 43 17 100
810 338–2,523 35 35 8 100
811 303–2,748 40 40 10 100
834 404–2,686 35 34 7 97
840 373–2,967 50 50 8 100
841 373–2,504 37 36 7 97
857 380–2,577 46 45 7 98
888 501–2,414 26 24 5 92
R07 576–2,327 37 37 13 100
M09 353–2,096 47 47 9 100
N01 404–2,256 51 51 15 100
TGA 362–2,209 44 43 17 98
Total 303–3,105 514 508 124 –
generated (51 and 50 respectively), whereas in the presence of primer 807 only 23 products (the smallest number) were obtained. A high level of polymorphism was observed in the amplified DNA fragments and in the presence of eight primers only polymorphic products were obtained. We identified a total of 124 specific amplification products in the ecotypes and cultivars ofP. pratensisanalyzed in this study. The largest number (17) was obtained in reaction with primer 808, while in the presence of primer 807 only one product with a unique composition (649 bp) for ecotype lbs05 170 was obtained (Fig. 3). In total, 95 such products were identified for the ecotypes. The largest numbers were recorded for populations lbs05 170 (15 bands) and lbs05 628 (13 bands), and for ecotype pom06 175. Specific products of similar molecular size were identified in the presence of different primers. A significant number of unique bands were also identified for the lawn cultivars, including the German ‘Limousine’ (11).
Evaluation of RAPD and ISSR polymorphisms
Figure 3 ISSR patterns amplified with primer 808 forP. pratensis.M, MassRulerTMLadder mix, ready-to-use (Thermo Scientific); 1, pom06 175; 2, zap00 240; 3, lbs05 170; 4, lbs05 628; 5, dos01 333; 6, dos01 405; 7, dos01 468; 8, bes03 373; 9, bes03 379; 10, bes03 354; 11, ora03 178; 12, bie04 189; 13, pod02 215; 14, pod02 172; 15, pod02 317; 16, ‘Alicia’; 17, ‘Limousine’; 18, ‘Eska 46.’
those obtained in RAPD reactions were 100% polymorphic (Table 3). A large number
of products were obtained using both methods in the presence of single primers (on
average 30 products for each method) (Table 4). For both RAPD and ISSR methods the
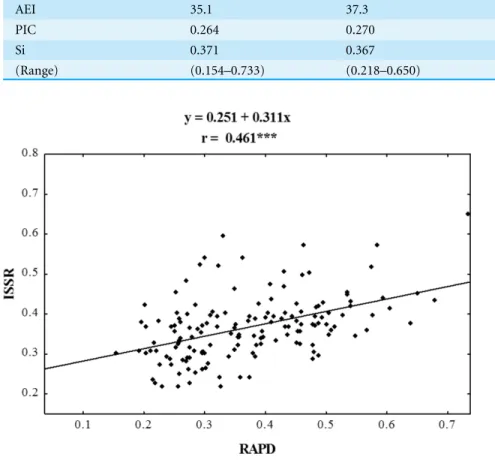
polymorphism information content (PIC) was calculated; the average PIC value for each method was almost identical and was 0.264 for RAPD and 0.270 for ISSR. The value of the assay efficiency index, which indicates the average number of polymorphic products identified in the presence of a single primer, was also calculated for both RAPD and ISSR marker systems. The obtained AEI value was higher for ISSR markers. Specific DNA
fragments were obtained for almost all the studied populations (Tables 3and4); RAPD
primers were more effective in identifying them. In a reaction with a single RAPD primer, we were able to identify as many as 11 unique bands. Dice’s genetic similarity matrix was determined for all the studied forms ofP. pratensis. Independently of each other, the RAPD and ISSR methods revealed little genetic relationship between the studied populations and cultivars (Table 4). On average Dice’s coefficient for RAPD was 0.371, while it was 0.367 for ISSR markers. The greatest genetic relationship was demonstrated between two populations from Podlaskie voivodship, pod02 215 and pod02 317 (0.733 for RAPD, 0.650 for ISSR and
0.678 for RAPD+ISSR). The lowest values of Dice’s coefficient for RAPD (0.154) were
obtained for populations lbs05 170 and bie04 189, while in the cases of ISSR and RAPD+
Table 4 Evaluation of RAPD and ISSR polymorphisms.The average Number of Scored Bands (NSB) including Number of Unique Bands (NUB) obtained in the presence of a single primer, the value of Poly-morphism Information Content (PIC), Assay Efficiency Index (AEI), and Genetic Similarity (Si).
Parameter/Index RAPD ISSR RAPD+ISSR
NSB 35.1 38.0 36.8
NUB 11.3 7.7 9.3
AEI 35.1 37.3 36.4
PIC 0.264 0.270 0.268
Si 0.371 0.367 0.369
(Range) (0.154–0.733) (0.218–0.650) (0.222–0.678)
Figure 4 Correlation analysis of similarity matrices obtained using RAPD and ISSR markers in eco-types ofP. pratensis. The symbol *** indicates that the value is significant assumingP=0.001 as the level of significance.
Cluster analysis
The applied measure of genetic similarity was used to construct UPGMA dendrograms (Fig. 5). There was greater compatibility with respect to the clustered forms for the ISSR
and RAPD+ISSR dendrograms. Regardless of which method was used, two asymmetrical
and distinct major clusters were clearly distinguishable in each dendrogram. The majority of the studied forms were assigned to the second cluster, within which two subclusters
of similarity were distinguishable 11 forms for RAPD and RAPD+ISSR and 12 forms
for ISSR. In the ISSR dendrogram, the first main cluster included two ecotypes from Kujawsko-Pomorskie (pom06 175) and from West Pomerania voivodships (zap00 240).
The combined RAPD+ISSR analysis also included ecotype dos01 405 from Lower Silesia.
and to both common subclusters (Fig. 5). Two ecotypes from Lubuskie voivodship (lbs05 170 and lbs05 628) turned out to be genetically most distant. These were not assigned to any pair or subcluster; this is visible in all the dendrograms (Fig. 5). These populations also differed among themselves; this was confirmed by the value of Dice’s similarity index
(0.224 for RAPD+ISSR). In the ISSR and RAPD+ISSR dendrograms, other genetically
different forms included an ecotype from Podkarpacie region (bie04 189), while in the RAPD dendrogram, a form from Silesia (bes03 373) was genetically different. Among the cultivars, ‘Eska 46’ was the most distinctly different: in the RAPD and ISSR dendrograms, it
was connected loosely with the second cluster, while the image obtained for RAPD+ISSR
depicted it as an unpaired form. In each of the dendrograms the ecotypes from Podlasie and the lawn cultivars ‘Alicia’ and ‘Limousine’ formed a common subcluster of forms. In the RAPD dendrogram, the Silesian population bes03 354 joined them, whereas in the ISSR
and RAPD+ISSR dendrograms this form was included in the second subcluster together
with other ecotypes from Silesia and populations from Lesser Poland and Lower Silesia. In the ISSR diagram, dos01 405 was placed with ecotypes from Lower Silesia, while in the
RAPD diagram it was only loosely connected with the second cluster and in the RAPD+
ISSR diagram it was included in a different cluster.
Principal component analysis
We examined the position of the ecotypes ofP. pratensisin two-dimensional space using
principal component analysis (PCA), which was carried out on the geographical coordinates
of the habitats from which the surveyed populations had come.Figure 6A depicts this
analysis, which was used as a reference template for the selection of primers with the highest differentiating power. PCA was performed independently for RAPD and ISSR, using the amplification products generated in the presence of individual primers. For each of the methods the four starters were chosen which most clearly and coherently revealed the relationship between the geographic location of the assessed ecotypes and their genetic variability. Subsequently all possible combinations of the selected primers were analyzed
for their main components; this was done separately for RAPD, ISSR and (RAPD +
ISSR). A total of 60 PCAs were performed for the RAPD and ISSR primers, both for their combinations within one method and also for both methods combined. For the final PCA, DNA amplification products were chosen which had been obtained from the studied ecotypes and cultivars ofP. pratensisin the presence of ISSR microsatellites 807, 808, 834
and 840; these were the dinucleotide repeat sequences (AG)n(GA)n, anchored at the end
of 3′
. The studied populations were distributed on both sides of the axis of coordinates and distinctly away from its center. They formed five separate groups, which indicates their considerable diversity. Three populations from Podlasie (13, 14, 15), and ecotypes from West Pomerania (2) and Kujawy regions (1) together with the lawn cultivar ‘Limousine’ (17), formed two clearly distinguishable groups (Fig. 6). These were distributed on the same side of the first axis (horizontal) and clearly differed from the remaining forms of
Lubuskie voivodships respectively. Populations from Silesia (10) and Lesser Poland (11) were also contained in this group. On the same side of the horizontal axis we find another group containing the fodder cultivar ‘Eska 46’ (18) and three ecotypes (3, 5, 9) from the Lubuskie, Lower Silesian and Silesian voivodships respectively. In the course of the principal component analysis, two forms ofP. pratensiswere identified (12 and 16 (‘Alicia’)), which were not included in any of the groups. As with the UPGMA dendrograms, the population from Podkarpacie (bie04 189) differed distinctly from the other ecotypes and constituted a distinct genotype (Figs. 5and6).
DISCUSSION
DNA markers have become a useful tool for breeding work and for evaluating the genetic diversity of many different plant species, including the familyPoaceae. Molecular analysis, in conjunction with the characteristics of morphological traits, may be used to classify plants and select the initial forms for creating new cultivars or breeding lines. In the case ofP. pratensis, this was confirmed byShortell, Meyer & Bonos (2009),Tamkoc & Arslan (2010),
Raggi et al. (2015)andYuan et al. (2015). In this study, two markers (RAPD and ISSR) based on DNA amplification reactions were used to assess the genetic diversity of ecotypes
and cultivars ofP. pratensis. These methods do not require any prior information on the
analyzed DNA sequence. They do not take a lot of time and are also relatively simple and therefore quite universal. Furthermore they require only a small amount of DNA; this is why they are often employed in the genetic evaluation of different plant species. They can be used either in combination (Nkongolo, Michael & Demers, 2005;Alam, Naik & Mishra, 2009;De Lima et al., 2011;Singh et al., 2011; Debajit et al., 2015) or independently of each other (Al-Humaid & Motawei, 2004;Wang, 2010;Guo et al., 2009;Bednarskaya et al., 2014). In grasses, RAPD and ISSR markers are most commonly used to evaluate genetic variability within and between populations, and for molecular characterization and identification of different species and their hybrids, cultivars and genotypes (Posselt et al., 2006;Pivorien˙e et al., 2008;Al-Humaid, Ibrahim & Motawei, 2011;Motawei & Al-Ghumaiz, 2012;Madesis et al., 2014;Yuan et al., 2014). InP. pratensis, genetic analyses employing RAPD and ISSR focus mainly on the identification of sexual and apomictic genotypes (Huff & Bara, 1993;Mazzucato et al., 1995;Barcaccia et al., 1997;Barcaccia, Veronesi & Falcinelli, 1998;
Stephens et al., 2006); the assessment of genetic variability and identification of genotypes and cultivars (Lickfeldt, Voigt & Hamblin, 2002;Ning et al., 2005;Liang et al., 2009;Fard et al., 2012;Wang et al., 2012;Yuan et al., 2015); determining the genetic relationships
between different genotypes and species belonging to the genus Poaand their hybrids
(Gostimsky, Kokaiva & Konovalov, 2005;Reddy, Sarla & Siddiq, 2002;Fernández, Figueiras & Benito, 2002;Vaillancourt et al., 2008). Similarly, in previous studies concerning the assessment of the morphological and genetic variability of domestic ecotypes ofP. pratensis
originating from the areas of Lower Silesia and Podlasie (Szenejko & Rogalski, 2015), RAPD primers F05, G19 and M14 proved to be most useful in the evaluation of polymorphisms. The highest number of DNA fragments were obtained in the presence of these primers. In the case of ISSR markers, as in the studies ofBednarskaya et al. (2014), better results were obtained in the presence of primers with dinucleotide repeat sequences (AG)2,(GA)2
and (AC)2, anchored at the end of 3’. As suggested byAl-Humaid et al. (2004)and
Al-Humaid, Ibrahim & Motawei (2011), dinucleotide and trinucleotide repeats are abundant in genomes of fodder grasses and thus might constitute potential markers for assessing their genetic diversity and identifying their fungal diseases using the ISSR method. In grasses, (CAC)n, (CTC)nand (GA)n and (CA)nare particularly abundant. In the genus
Poa,ISSR primers with dinucleotide (AC)n (CA)n (GA)n and (AG)n repeats turned out
to be particularly useful for the identification and evaluation of genetic relationships between various species, includingP. angustifolia,P. trivialis,P. arachnifera,P. pratensis,
presented in this study obtained using RAPD and ISSR markers are comparable.Budak et al. (2004), in a study examining the phylogenetic relationships between seed and vegetative
biotypes ofBuchloe dactyloides, used various systems of molecular markers (ISSR, SSR,
RAPD and SRAP), for which they determined correlations. In the case of RAPD and ISSR, the Spearman’s coefficient (0.461) calculated by Budak was similar to ours, but their results turned out to be statistically insignificant. Both RAPD and ISSR markers revealed a small genetic similarity among the studied ecotypes and cultivars ofP. pratensis.
The average value of Dice’s coefficient for both methods combined (RAPD +ISSR)
was low (0.369), which together with the high number of polymorphic products may indicate substantial genetic differences between the studied populations and their low level of relatedness. It can be speculated that natural spatial barriers might have inhibited and minimized the transfer of genes among these populations; this would certainly have contributed to their diversity. At the same time, we can surmise that there were populations among the studied ecotypes in which apomixis was the main mode of reproduction. The ecotypes originating from three voivodships (Podkarpackie, Lower Silesian and Lubuskie (bie04 189, lbs05 628 and lbs05 170)), were determined to be those genetically most distant from the other forms. These populations had the lowest similarity index and included the most uncommon genotypes, for which the largest number of specific amplification products were identified. In comparison to the other cultivars, ‘Eska 46’ was clearly different in terms of its genetic structure, and, overall, few amplification products were generated for it. It should be stressed that in previous studies aimed at evaluating RAPD polymorphism in different populations ofP. pratensis, such a high genetic diversity among ecotypes had never been found, while the average Dice’s coefficient was about 0.7 (Szenejko & Rogalski, 2015). Other authors also reported significant genetic relatedness among the different genotypes and cultivars ofP. pratensis (Johnson et al., 2002;Ning et al., 2005;Tamkoc & Arslan, 2010;Fard et al., 2012). UPGMA dendrograms based on genetic similarity matrices revealed discrepancies in the mode of clustering of the studied forms ofP. pratensis. Greater similarity in that respect was demonstrated for the ISSR and
RAPD+ISSR methods. This difference in the clustering process between the RAPD and
ISSR dendrograms was also demonstrated in research byBhattacharya, Bandopadhyay &
Ghosh (2010), who were assessing the genetic diversity ofCymbopogon winterianusand bySouframanien & Gopalakrishna (2004), who were studying genotypes ofVigna mungo. Similarly to our results, these authors found greater clustering conformity for ISSR and
RAPD+ISSR. Looking at the distribution in individual UPGMA dendrograms, it appears
Pomerania and Kujawy clearly differed from the ecotypes originating from the western and southern parts of the country and were located on the opposite side of the horizontal axis of coordinates. They also differed from one another, which can be seen in their arrangement on both sides of the vertical axis. Some discrepancies were found between the UPGMA and PCA clusters of the studied forms, which were related, inter alia, to the distribution of the cultivars. Only a modest relationship between genetic divergence and geographical origin in
P. pratensiswas reported by several authors (Johnson et al., 2002;Fard et al., 2012;Raggi et al., 2015). For comparison,Abbaszade et al. (2013), who were studying the genetic diversity ofLolium multiflorum, andRahmati et al. (2013), who were studyingFestuca arundinacea, demonstrated a greater result consistency between UPGMA and PCA. However, neither of these research teams was able to demonstrate a correlation between the genetic variability of the grass genotypes they analyzed and their geographical origin.
CONCLUSIONS
Our results suggest that both the systems of dominant RAPD and ISSR markers that were used in our research can be used to assess the genetic variability of selected ecotypes and cul-tivars ofP. pratensis. However, given their better reproducibility of results, greater efficiency in detecting polymorphic amplification products in the presence of a single primer and also their differentiating properties (which make them capable of distinguishing studied forms with respect to their genetic structure), ISSR markers seem to be a more useful and reliable tool for this kind of analysis. The plant material evaluated in this study was characterized by a high genetic variability, which seems to confirm the hypothesis that ecotypes of
P. pratensisoriginating from different parts of Central Europe, each with different terrain structures and habitat conditions, can provide great genetic variability and a large collection of alleles. Microsatellites with dinucleotide repeat sequences (AG)n, (GA)n anchored at
the end of 3’ proved particularly useful for assessing the genetic diversity of these ecotypes and determining their main directions of variability. PCA helped to establish a correlation between the geographical origin of the studied ecotypes and their genetic variation.
ACKNOWLEDGEMENTS
We wish to express our gratitude to Anna Kalinka, PhD from the Department of Cell Biology, Faculty of Biology, University of Szczecin for sharing with us her invaluable advice and knowledge regarding the development and interpretation of RAPD and ISSR results.
ADDITIONAL INFORMATION AND DECLARATIONS
Funding
The authors received no funding for this work.
Competing Interests
Author Contributions
• Magdalena Szenejko conceived and designed the experiments, performed the
experiments, analyzed the data, contributed reagents/materials/analysis tools, wrote the paper, prepared figures and/or tables, reviewed drafts of the paper.
• Przemysław Śmietana analyzed the statistical data, prepared figures and/or tables,
reviewed drafts of the paper.
• Edyta Stępień analyzed the data.
Data Availability
The following information was supplied regarding data availability: The raw data has been supplied asData S1.
Supplemental Information
Supplemental information for this article can be found online athttp://dx.doi.org/10.7717/ peerj.2489#supplemental-information.
REFERENCES
Abbaszade S, Jafari AA, Safari H, Shirvani H. 2013.Genetic diversity ofLolium
multiflo-rumaccessions using ISSR molecular markers.International Journal of Farming and
Allied Sciences2:1217–1222.
Alam MDA, Naik PK, Mishra GP. 2009.Congruence of RAPD and ISSR markers
for evaluation of genomic relationship among 28 populations ofPodophyllum
hexandrumroyle from Himachal Pradesh, India.Turkish Journal of Botany33:1–12
DOI 10.3906/bot-0711-10.
Albertini E, Marconi G, Barcaccia G, Raggi L, Falcinelli M. 2004.Isolation of candidate
genes for apomixis inPoa pratensisL.Plant Molecular Biolology56:879–894
DOI 10.1007/s11103-004-5211-y.
Albertini E, Marconi G, Reale L, Barcaccia G, Porceddu A, Ferranti F, Falcinelli M.
2005.SERK and APOSTART. Candidate genes for apomixis inPoa pratensis.Plant
Physiology138:2185–2199DOI 10.1104/pp.105.062059.
Albertini E, Porceddu A, Ferranti F, Reale L, Barcaccia G, Romano B, Falcinelli M.
2001.Apospory and parthenogenesis may be uncoupled inPoa pratensis: a
cytologi-cal investigation.Sexual Plant Reproduction14:213–217
DOI 10.1007/s00497-001-0116-2.
Al-Humaid A, Ibrahim GH, Motawei MI. 2011.Molecular identification of some
turfgrass cultivars and their resistance toFusarium graminearum.Australian Journal of Crop Science5:1754–1759.
Al-Humaid A, Motawei MI. 2004.Molecular characterization of some turfgrass cultivars
using randomly amplified polymorphic DNA (RAPD) markers.Journal of Food,
Agriculture and Environment 2:376–380.
Al-Humaid A, Motawei MI, Abdalla MY, Mana F. 2004.Detection of genetic variation
and Fusarium resistance in turfgrass genotypes using PCR-based markers (ISSR and
Arslan E, Tamko¸c A. 2011.The application of ISSR-PCR to determine the genetic relationship and genetic diversity between narrow leaved bluegrass (Poa angustifolia) and rough bluegrass (Poa trivialis) accessions.Turkish Journal of Botany 35:415–423
DOI 10.3906/biy-0912-31.
Barcaccia G, Mazzucato A, Belardinelli A, Pezzotti M, Lucretti S, Falcinelli M. 1997. Inheritance of parental genomes in progenies ofPoa pratensisL. from sexual and
apomictic genotypes as assessed by RAPD markers and flow cytometry.Theoretical
and Applied Genetics95:516–524DOI 10.1007/s001220050592.
Barcaccia G, Veronesi F, Falcinelli M. 1998.Mapping of AFLP and RAPD markers
linked to apomeiosis inMedicago falcataand to parthenogenesis inPoa pratensis.
Apomixis Newsletter 10:2–7.
Bednarskaya IA, Popov VN, Dugar YUN, Akinina GE, Dolgova TA. 2014.ISSR
analysis of some species ofAngustifoliate Fescue.Cytology and Genetics48:364–370
DOI 10.3103/S0095452714060024.
Bhattacharya S, Bandopadhyay TK, Ghosh PD. 2010.Efficiency of RAPD and ISSR
markers in assessment of molecular diversity in elite germplasms ofCymbopogon
winterianusacross West Bengal, India.Emirates Journal of Food Agriculture22:13–24
DOI 10.9755/ejfa.v22i1.4903.
Budak H, Shearman RC, Parmaksiz I, Dweikat I. 2004.Comparative analysis of seeded
and vegetative biotype buffalograsses based on phylogenetic relationship using
ISSRs, SSRs, RAPDs, and SRAPs.Theoretical and Applied Genetics109:280–288
DOI 10.1007/s00122-004-1630-z.
Carneiro VTC, Dusi DMA, Ortiz JPA. 2006. Apomixis: occurrence, applications and
improvements. In: Teixeira da Silva JA, ed.Ornamental and plant biotechnology:
advances and topical issues (I), Floriculture. Isleworth: Global Science books, 564–571.
Cichorz S, Gośka M, Litwiniec A. 2014.Miscanthus: Genetic diversity and genotype
identification using ISSR and RAPD markers.Molecular Biotechnology5:911–924
DOI 10.1007/s12033-014-9770-0.
Curley J, Jung G. 2004.RAPD-based genetic relationships in Kentucky bluegrass:
comparison of cultivars, interspecific hybrids, and plant introductions.Crop Science
44:1299–1306DOI 10.2135/cropsci2004.1299.
Da Costa MLM, Amorim LLB, Onofre AVC, De Melo LJOT, De Oliveira MBM, De
Car-valho R, Benko-Iseppon AM. 2011.Assessment of genetic diversity in contrasting
sugarcane varieties using inter-simple sequence repeat (ISSR) markers.American
Journal of Plant Sciences2:425–432DOI 10.4236/ajps.2011.23048.
De Lima RSN, Daher RF, Gon¸calves LSA, Rossi DA, Do Amaral Jr AT, Pereira MG,
Lédo FJS. 2011.RAPD and ISSR markers in the evaluation of genetic divergence
among accessions of elephant grass.Genetics and Molecular Research10:1304–1313
DOI 10.4238/vo110-3gmr1107.
Debajit S, Sukriti D, Sneha G, Mohan L, Singh BB. 2015.RAPD and ISSR based
with a distinct correlation of morpho-chemical observations.Research Journal of Biotechnology10:105–113.
Dice LR. 1945.Measures of the amount of ecological association between species.Ecology
26:297–302DOI 10.2307/1932409.
Fard JR, Zamani Z, Moghaddam MRF, Mohsen K. 2012.Evaluation of genetic diversity
among some genotypes of Kentucky bluegrass by RAPD molecular markers.
Horticulture, Environment, and Biotechnology53:298–303
DOI 10.1007/s13580-012-0120-5.
Felsenstein J. 1974.The evolutionary advantage of recombination.Genetics78:737–756.
Fernández ME, Figueiras AM, Benito C. 2002.The use of ISSR and RAPD markers for
detecting DNA polymorphism, genotype identification and genetic diversity among barley cultivars with known origin.Theoretical and Applied Genetics104:845–851
DOI 10.1007/s00122-001-0848-2.
Ghislain M, Zhang D, Fajardo D, Huamann Z, Hijmans RH. 1999.Marker-assisted
sampling of the cultivated Andean potatoSolanum phurejacollections using RAPD
markers.Genetic Resources and Crop Evolution46:547–555
DOI 10.1023/A:1008724007888.
Goldman JJ. 2008.The use of ISSR markers to identify Texas bluegrass interspecific
hybrids.Plant Breeding 127:644–646DOI 10.1111/j.1439-0523.2008.01526.x.
Goldman J. 2013.Genetic relationships in advanced generation hybrids derived from
crosses between Texas (Poa arachnifera) and Kentucky (Poa pratensis) bluegrass using ISSR markers.American Journal of Plant Sciences4:2440–2443
DOI 10.4236/ajps.2013.412303.
Gostimsky SA, Kokaiva G, Konovalov FA. 2005.Studying plant genome variation using
molecular markers.Russian Journal of Genetics41:378–388
DOI 10.1007/s11177-005-0101-1.
Guo HB, Huang KY, Zhou TS, Wu QH, Zhang YJ, Liang ZS. 2009.DNA isolation,
optimization of ISSR-PCR system and primers screening ofScutellaria baicalensis.
Journal of Medicinal Plant Research3:898–901.
Hampl V, Pavliček A, Flegr J. 2001.Construction and bootstrap analysis of DNA
fingerprinting-based phylogenetic trees with the freeware program Free Tree: application to trichomonad parasites.International Journal of Systematic and Evolutionary Microbiology51:731–735 DOI 10.1099/00207713-51-3-731.
Hsiang T, Ma XL, Yang L, Cook S. 2000.Analyses of RAPD data for detection of host
specialization in Sclerotina homoecarpa.Plant Pathology 49:269–275
DOI 10.1046/j.1365-3059.2000.00445.x.
Huff DR, Bara JM. 1993.Determining genetic origins of aberrant progeny from
apomic-tic Kentucky bluegrass using a combination of flow cytometry and silver stained
RAPD markers.Theoretical and Applied Genetics87:201–208
DOI 10.1007/BF00223765.
Johnson RC, Johnston WJ, Golob CT, Nelson MC, Soreng RJ. 2002.Characterization of
the USDPoa pratensiscollection using RAPD markers and agronomic descriptors.
Kashi Y, King D. 2006.Simple sequence repeats as advantageous mutators in evolution.
Trends in Genetics22:253–259DOI 10.1016/j.tig.2006.03.005.
Liang M, Gao L, Chen YJ, Zhang ZY. 2009.Classification and genetic diversity of
Ken-tucky bluegrass by using RAPD markers.Journal Northeast Agricultural University
16:9–13 (English Edition).
Lickfeldt DW, Voigt TB, Hamblin AM. 2002.Cultivar composition and spatial patterns
in Kentucky bluegrass blends.Crop Science42:842–847
DOI 10.2135/cropsci2002.0842.
Madesis P, Abraham EM, Kalivas A, Ganopoulos I, Tsaftaris A. 2014.Genetic diversity
and structure of naturalDactylis glomerataL. populations revealed by morphological
and microsatellite-based (SSR/ISSR) markers.Genetics and Molecular Research
13:4226–4240DOI 10.4238/2014.June.9.8.
Matzk F, Prodanovic S, Bäumlein H, Schubert I. 2005.The inheritance of apomixis in
Poa pratensisconfirms a five locus model with differences in gene expressivity and
penetrance.The Plant Cell17:13–24DOI 10.1105/tpc.104.027359.
Mazzucato A, Barcaccia G, Pezzotti M, Falcinelli M. 1995.Biochemical and molecular
markers for investigating the mode of reproduction in the facultative apomictsPoa pratensisL.Sexual Plant Reproduction8:133–138DOI 10.1007/BF00242256.
Mazzucato A, Den Nijs APM, Falcinelli M. 1996.Estimation of parthenogenesis
frequency in Kentucky bluegrass with auxin-induced parthenocarpic seeds.Crop
Science36:9–16DOI 10.2135/cropsci1996.0011183X003600010002x.
Mirek Z, Pi¸eknoś-Mirkowa H. 2007. Grasses mountains. In: Frey L, ed.The book of
polish grasses. Kraków: W. Szafer Institute of Botany PAS, 203–228 (in Polish).
Motawei MI, Al-Ghumaiz NS. 2012.Genetic diversity in some introduced pasture grass
cultivars revealed by inter-simple sequence repeats (ISSR) markers.African Journal of Biotechnology11:3531–3536DOI 10.5897/AJB11.2577.
Muller HJ. 1964.The relation of recombination to mutational advance.Mutation
Research1:2–9DOI 10.1016/0027-5107(64)90047-8.
Müntzing A. 1933.Apomictic and sexual seed formation inPoa.Hereditas17:133–154
DOI 10.1111/j.1601-5223.1933.tb02584.x.
Naik PK, Alam MDA, Singh H, Goyal V, Parida S, Kalia S, Mohapatra T. 2010.
Assess-ment of genetic diversity through RAPD, ISSR and AFLP markers inPodophyllum
hexandrum: a medicinal herb from the Northwestern Himalayan region.Physiology and Molecular Biology of Plants16:135–148DOI 10.1007/s12298-010-0015-9.
Nei M, Li WH. 1979.Mathematical model for studying genetic variation in terms of
restriction endonucleases.Proceedings of National Academy of Sciences of the USA Genetics76:5269–5273DOI 10.1073/pnas.76.10.5269.
Ning TT, Zhang ZJ, Jin CZ, Zhu YG. 2005.Genetic polymorphism of bluegrass cultivars
detected by RAPDs.Hereditas27:605–610.
Nkongolo KK, Michael P, Demers T. 2005.Application of ISSR, RAPD and cytological
markers to the certification ofPicea mariana, P. glaucaandP. engelmanniitrees, and
Pamilo P, Nei M, Li WH. 1987.Accumulation of mutations in sexual and asexual
populations.Genetics Research43:135–146DOI 10.1017/S0016672300026938.
Patterson JT, Larson SR, Johnson PG. 2005.Genome relationships in polyploidyPoa
pratensisand otherPoa speciesinferred from phylogenetic analysis of nuclear and
chloroplast DNA sequences.Genome48:76–87DOI 10.1139/g04-102.
Pavlíček A, Hrdá Š, Flegr J. 1999.FreeTree—freeware program for construction of
phylogenetic trees on the basis of distance data and bootstrap/jackknife analysis of the tree robustness. Application in the RAPD analysis of genusFrenkelia.Folia Biologica45:97–99.
Pejic I, Ajmone-Marsan P, Morgante M. 1998.Comparative analysis of genetic similarity
among maize inbred lines detected by RFLPs, RAPDs, SSRs and AFLPs.Theoretical
and Applied Genetics97:1248–1255DOI 10.1007/s001220051017.
Pivorien˙e O, Pašakinskien˙e I, Brazauskas G, Lideikyt˙e L, Jensen LB, Lübberstedt T.
2008.Inter-simple sequence repeat (ISSR) loci mapping in the genome of perennial
ryegrass.Biologija54:17–21DOI 10.2478/v10054-008-0004-x.
Posselt UK, Barre P, Brazauskas G, Turner LB. 2006.Comparative analysis of genetic
similarity between perennial ryegrass genotypes investigated with AFLPs, ISSRs,
RAPDs and SSRs.Czech Journal of Genetics and Plant Breeding 42:87–94.
Raggi L, Bitocchi E, Russi L, Marconi G, Sharbel TF. 2015.Understanding genetic
diversity and population structure of aPoa pratensisworldwide collection through
morphological, nuclear and chloroplast diversity analysis.PLoS ONE10:1–22
DOI 10.1371/journal.pone.0124709.
Rahmati H, Farshadfar M, Safari H, Shirvani H. 2013.Application of ISSR molecular
markers in genetic diversity ofFestuca arundinacea.International Journal of Agricul-ture and Crop Sciences6:286–291.
Rajasekar S, Fei S, Christians NE. 2005.Analysis of genetic diversity in rough bluegrass
determinate by RAPD markers.Crop Science46:162–167
DOI 10.2135/cropsci2005.04-0008.
Reddy MP, Sarla N, Siddiq EA. 2002.Inter simple sequence repeat (ISSR) polymorphism
and its application in plant breeding.Euphytica128:9–17
DOI 10.1023/A:1020691618797.
Shortell RR, Meyer WA, Bonos SA. 2009.Classification and inheritance of
morpho-logical and agronomic characteristics in Kentucky bluegrass (Poa pratensisL.).
HortScience44:274–279.
Singh DR, Srivastava AK, Srivastava A, Srivastava RC. 2011.Genetic diversity among
threeMorindaspecies using RAPD and ISSR markers.Indian Journal of Biotechnology
10:285–293.
Souframanien J, Gopalakrishna T. 2004.A comparative analysis of genetic diversity
in blackgram genotypes using RAPD and ISSR markers.Theoretical and Applied
Genetics109:1687–1693DOI 10.1007/s00122-004-1797-3.
Spillane C, Steimer A, Grossniklaus U. 2001.Apomixis in agriculture: the quest for
Stephens LC, Fei SZ, Xiong Y, Hodges CF. 2006.Plants regenerated from embryo cultures of an apomictic clone of Kentucky bluegrass (Poa pratensisL. ‘Baron’) are
not apomictic in origin.Euphytica147:383–388DOI 10.1007/s10681-005-9034-y.
Szenejko M. 2014.Kentucky bluegrass—a small but valuable cultivated grass of the
temperate climate zone. Kosmos.Problems of Biological Sciences63:107–116 (in Polish).
Szenejko M, Filip E, Słominska-Walkowiak R. 2009. Relationship between habitat
conditions and the degree of genetic diversity of ecotypes ofPoa pratensisL. In: Naganowska B, Kachlicki P, Krajewski P, eds.Genetics and genomics to improve crops. Poznań: Institute of Plant Genetics PAS, 343–350 (in Polish).
Szenejko M, Rogalski M. 2015.Characterization of morphological traits and RAPD
poly-morphism in selected forms of Kentucky bluegrass (Poa pratensisL.).Biodiversity Research and Conservation37:1–10DOI 10.1515/biorc-2015-0005.
Tamkoc A, Arslan E. 2010.Comparison of agronomic characters, total seed storage
proteins and their use for genotypes discrimination in the Kentucky bluegrass (Poa pratensisL.).Biotechnology & Biotechnological Equipment 24:1573–1576
DOI 10.2478/V10133-010-0007-5.
Vaillancourt A, Nkongolo KK, Michael P, Mehes M. 2008.Identification,
characteri-sation, and chromosome locations of rye and wheat specific ISSR and SCAR markers useful for breeding purposes.Euphytica159:297–306
DOI 10.1007/s10681-007-9492-5.
Wang XM. 2010.Optimization of DNA isolation, ISSR-PCR system and primers
screening of genuine species of rhubarb, an important herbal medicine in China.
Journal of Medicinal Plant Research4:904–908.
Wang CH, Li X, Gao LN, Zhang L, Liu W, Liu HM, Chen YJ. 2012.Study on
classifica-tion and genetic diversity of Kentucky bluegrass by using RAPD markers.Journal
Northeast Agricultural University19:37–41 (English Edition).
Williams JGK, Kubelik AR, Livak KJ, Rafalski JA, Tingey SV. 1990.DNA
polymor-phisms amplified by arbitrary primers are useful as genetic markers.Nucleic Acids Research18:6531–6535DOI 10.1093/nar/18.22.6531.
Yuan X, Bao Z, He Y, Chen Q, Wang G. 2014.Development of SCAR marker related to
summer stress tolerance in tall fescue (Festuca arundinacea).Notulae Botanicae Horti Agrobotanici Cluj-Napoca42:81–87DOI 10.15835/nbha4219381.
Yuan X, He Y, Huang J, Hu W, Zhou H, Gao Q, Zhou S. 2015.Development of a SCAR
marker for rapid identification of new Kentucky bluegrass breeding lines.Notulae
Botanicae Horti Agrobotanici Cluj-Napoca43:79–85DOI 10.15835/nbha4319664.
Zi¸etkiewicz E, Rafalski A, Labuda D. 1994.Genome fingerprinting by simple
se-quence repeat (SSR)-anchored polymerase chain reaction amplification.Genomics