Printed version ISSN 0001-3765 / Online version ISSN 1678-2690 http://dx.doi.org/10.1590/0001-3765201820170523
www.scielo.br/aabc | www.fb.com/aabcjournal
Genetic diversity of promising ‘conilon’ coffee clones based on morpho-agronomic variables
JOÃO ANTONIO D. GILES1
, FÁBIO L. PARTELLI1
, ADÉSIO FERREIRA2
, JOICE P. RODRIGUES1
, GLEISON OLIOSI1 and
FERNANDO H. LIMA E SILVA3
1
Centro Universitário Norte do Espírito Santo, Universidade Federal do Espírito Santo/UFES, Rodovia BR 101 Norte, Km 60, Bairro Litorâneo, 29932-540 São Mateus, ES, Brazil
2
Centro de Ciências Agrárias, Universidade Federal do Espírito Santo/UFES, Alto Universitário, s/n, Guararema, 29500-000 Alegre, ES, Brazil
3
Instituto Federal Goiano, Campus Rio Verde, Rodovia Sul Goiana, Km 01, s/n, Zona Rural, 75901-970 Rio Verde, GO, Brazil
Manuscript received on July 9, 2017; accepted for publication on August 7, 2017
ABSTRACT
Knowledge of the genetic variability of a population is essential to guide its preservation and maintenance in addition to increasing the efficiency of genetic breeding programs. On this basis, this study was conducted to evaluate the genetic diversity of Coffea canephora genotypes using multivariate statistical procedures applied to a set of morpho-agronomic variables. The materials employed in this study constitute a crop located in Vila Valério - ES, Brazil, where the genotypes are arranged in a randomized-blocks experimental design with four replicates. Significant differences were detected by the F test at the 1% or 5% probability levels among the genotypes for all evaluated traits, demonstrating heterogeneity of genetic constitution in the studied population, which is favorable to breeding, as it indicates the possibility to identify superior and divergent individuals. Based on the generalized Mahalanobis distance, the most divergent combinations were obtained between genotypes 23 and 10 (256.43) and 23 and 17 (250.09). The clusters formed by Tocher’s optimization and the UPGMA hierarchical method agreed, both similarly grouping the genotypes into three clusters. Of the analyzed traits, mature fruit weight (19.08%), yield (15.50%), plant diameter (12.42%), and orthotropic-shoot internode length (10.94%) were the most efficient to explain the dissimilarity among the genotypes.
Key words: Coffea canephora, dissimilarity, multivariate analysis, plant breeding.
Correspondence to: João Antônio Dutra Giles E-mail: [email protected]
* Contribution to the centenary of the Brazilian Academy of Sciences.
INTRODUCTION
The coffee crop occupies over 11 million hectares,
and its product is one of the most valuable of the world economy, with a production sector involving more than 80 countries (Denoeud et al. 2014,
Mohanan et al. 2014). The plant that originates this commodity belongs to the family Rubiaceae, which in turn comprises over 11,000 species, ordered
into 550 genera (Robbrecht and Manen 2006), one of which is Coffea. According to Davis et al.
(2011), this genus has at least 124 species, wherein C. arabica Linnaeus and C. canephora Pierre ex A. Froehner are the two of highest commercial
and 42% of the 148 bags of 60 kg produced in 2016
across the globe (ICO 2017).
Today, the species C. canephora, also known
as ‘conilon’ or ‘robusta’ coffee, is cultivated at low
to medium elevations in the intertropical regions of Africa, America, and Asia. It adapts well to warmer climates without major variations in temperature, with precipitation greater than 2,000 mm yr-1
(Montagnon et al. 2012, Cubry et al. 2013).
The species C. canephora is diploid (2n = 2x = 22) and mostly allogamous, of gametophytic self-incompatibility (Carvalho et al. 1991) of monogenic nature; i.e., it is bound to a single “S” locus, with at least three alleles interacting (Conagin and Mendes 1961). This mechanism prevents the pollen grain carrying a certain allele from fertilizing any ovule carrying the same allele, thereby preventing self-pollination and/or cross of individuals with similar alleles.
Therefore, the natural reproduction of the species generates highly heterozygous individuals and populations with high genetic variability. In this regard, the characterization and exploitation of genetic variability within the species C. canephora may reveal genetic resources of great value both for production systems and for its use in genetic breeding programs. Rodrigues et al. (2014)
reported that the coffee breeding programs aiming
at productivity, aggregating agronomic traits for resistance to pests and diseases, and plants of short height and adapted to local climate and soil conditions.
Genetic variability, the raw material of breeding programs, can be estimated by multivariate analyses,
which are based on differences between accessions,
simultaneously integrating multiple pieces of information from a set of traits. In this sense, the analysis of genetic diversity is important in that it provides parameters for the identification of the parents whose cross produces a greater heterotic effect, to heighten the possibilities of obtaining
offspring with superior features (Cruz et al. 2014).
Studies on the genetic diversity of coffee adopting multivariate analyses have been carried out by many researchers, both for C. canephora (Fonseca et al. 2006, Ivoglo et al. 2008, Rocha et al. 2013, Dalcomo et al. 2015, Silva et al. 2015, Covre et al. 2016), and C. arabica (Dias et al. 2005, Guedes et al. 2013, Silva et al. 2013, Teixeira et al. 2013, Moura et al. 2015, Rodrigues et al. 2016). Information in this regard provides bases to be used in breeding programs for the species.
Given the above-described scenario, this study was carried out to investigate the genetic diversity of promising registered C. canephora genotypes using multivariate statistical procedures employed on a set of morpho-agronomic traits.
MATERIALS AND METHODS
STUDIED POPULATION AND DESCRIPTION OF THE EXPERIMENT
We evaluated 30 C. canephora genotypes, 29 of which were propagated vegetatively via cuttings and one via seminiferous tubules (Table I).
The crop was implemented in May 2012 in the municipality of Vila Valério - ES, Brazil (18°58’05’’ S latitude and 40°20’02’’ W longitude; 150 m asl), with an average annual temperature of 23 ºC. The climate in the region is tropical, characterized by hot and wet summers and dry
winters, classified as an Aw type, according to the Köppen classification (Alvares et al. 2013), The
average annual precipitation in 2015 was 1,200 mm (ANA 2015).
The genotypes were arranged in randomized-blocks experimental design with four replicates in
which the treatments corresponded to the different
MORPHO-AGRONOMIC CHARACTERIZATION
The following 15 morpho-agronomic traits were evaluated: height (PH) and diameter (PD) of the plant at 477 days after planting (DAP); orthotropic-shoot internode length (OSI), measured after the plant reached its adult stage, in full production; weight (WMF), volume (VMF), and density (DMF) of the mature fruit, measured in fruits collected in the second harvest; grain processing rate (PR), corresponding to the ratio between mature fruit and
processed grain (% w/w); average yield of the 2014
and 2015 crops (YLD), expressed in bags (60 kg) per hectare; total chlorophyll index (CI), obtained
using a manual chlorophyll meter (clorofiLOG®
); leaf length (LL), width (LW), and area (LA), the last of which was estimated by the methodology proposed by Partelli et al. (2006); leaf dry mass
(LDM); and leaf specific mass (LSM), calculated
as the ratio between dry mass and leaf area. For these leaf morphology assessments, we collected ten leaves per plot from the third and/or fourth pair of newly developed leaves from plagiotropic shoots located at the middle third of the plants. Collections took place when the plants were at approximately two years and eight months of age.
STATISTICAL ANALYSIS
The data were subjected to analysis of variance, and the existence of variability was tested by the F test. For the study of genetic diversity, we determined the generalized Mahalanobis (D2) distance matrix, which was used as a dissimilarity measure for the cluster analysis of the genotypes by Tocher’s optimization method and the UPGMA (Unweighted Pair Group Method using Arithmetic Averages) hierarchical method. We also obtained the relative contribution of the traits for the genetic diversity among the C. canephora genotypes by Singh (1981)’s method. All of the aforementioned analyses were performed using the resources of Genes software (Cruz 2013).
RESULTS AND DISCUSSION
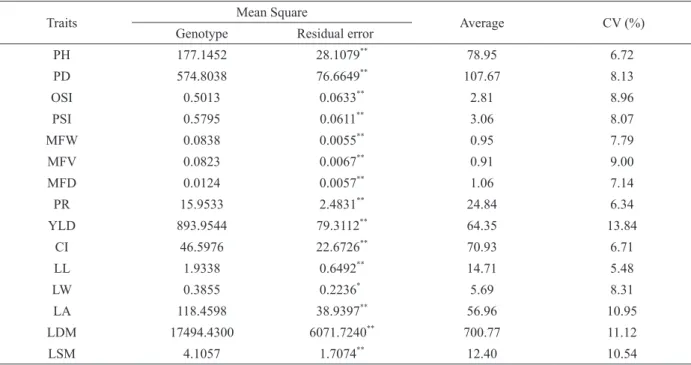
According to the analysis of variance, significant differences were detected by the F test at the 1% or 5% probability levels among the C. canephora
genotypes for all the morpho-agronomic traits assessed (Table II).
This fact reveals heterogeneity in the genetic composition of the studied population, which is important for analyses of genetic diversity and also TABLE I
Coffea canephora genotypes evaluated in Vila Valério - ES, Brazil. Promising registered
genotypes.
Number Genotype Number Genotype Number Genotype
1 Vitória V1 11 Beira Rio 6 21 18a
2 Vitória V2 12 Beira Rio 8 22 Baiano 4a
3 Vitória V4 13 Beira Rio 9 23 Pirata
4 Vitória V5 14 Beira Rio 10 24 Cownga
5 Vitória V7 15 Bamburral 25 Verdim 1
6 Vitória V8 16 Clementino 26 Verdim R
7 Vitória V9 17 P.Seminífera 27 P2
8 Vitória V10 18 Emcapa 153 28 P1
9 Beira Rio 3 19 Emcapa 143 29 LB1
10 Beira Rio 5 20 22a 30 A1
favorable to breeding, as it indicates the possibility of discriminating superior and divergent genotypes.
The coefficient of variation (CV), which expresses the residual standard deviation as a
percentage of the overall mean, is frequently used to estimate the precision of experiments. In this study,
values between 5.48 and 13.84% were found, with an average of 8.61% (Table II). According to Pimentel-Gomes (2009), all of these are classified as low (CVe < 10%) or medium (CVe < 20%), demonstrating good
experimental precision in the evaluations performed, as stated by Cruz et al. (2014).
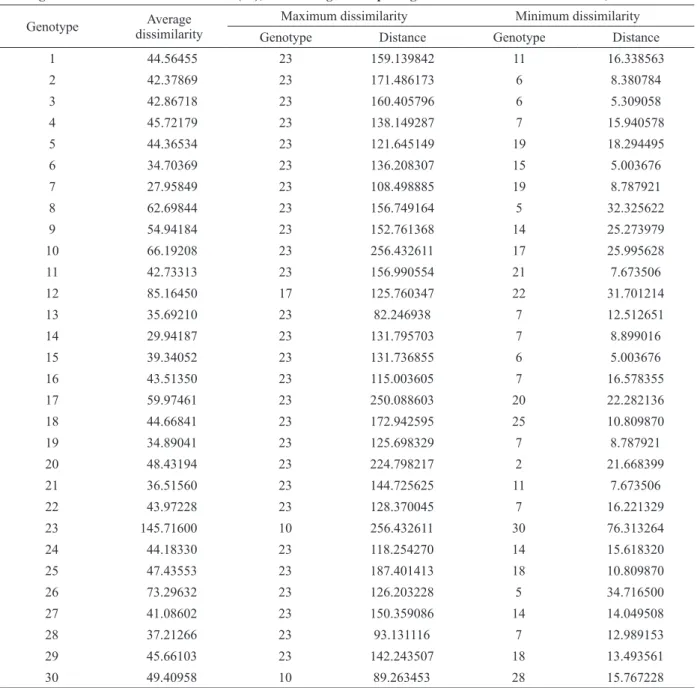
The maximum and minimum dissimilarity values for each one of the 30 C. canephora
genotypes, obtained based on the generalized Mahalanobis (D2) distance, showed varied
magnitude, with values ranging between 5.003 and
256.433, indicating broad genetic diversity in the studied population (Table III).
Dalcomo et al. (2015) evaluated 22 genotypes
of conilon coffee from the breeding program of
Incaper and also found elevated magnitude for genetic dissimilarity, with values between 7.32 and
168.37.
The highest average dissimilarity (145.72) was
observed in genotype 23 (Pirata), which was present
in 93.3% of the most dissimilar pairs; i.e., it was the
genotype most distant from 28 of the total 30 under evaluation. The most divergent combinations were
obtained between genotypes 23 and 10 (256.43) and between 23 and 17 (250.09). Genotypes 6 and
15, on the other hand, were the most similar, as they exhibited the shortest distance (5.00) between
the least dissimilar pairs. TABLE II
Summary of analysis of variance for 15 morpho-agronomic traits evaluated in 30 promising registered Coffea canephora
genotypes Vila Valério - ES, Brazil.
Traits Mean Square Average CV (%)
Genotype Residual error**
PH 177.1452 28.1079**
78.95 6.72
PD 574.8038 76.6649**
107.67 8.13
OSI 0.5013 0.0633** 2.81 8.96
PSI 0.5795 0.0611**
3.06 8.07
MFW 0.0838 0.0055**
0.95 7.79
MFV 0.0823 0.0067**
0.91 9.00
MFD 0.0124 0.0057**
1.06 7.14
PR 15.9533 2.4831**
24.84 6.34
YLD 893.9544 79.3112**
64.35 13.84
CI 46.5976 22.6726**
70.93 6.71
LL 1.9338 0.6492**
14.71 5.48
LW 0.3855 0.2236**
5.69 8.31
LA 118.4598 38.9397**
56.96 10.95
LDM 17494.4300 6071.7240** 700.77 11.12
LSM 4.1057 1.7074**
12.40 10.54
**
and *, significant at the 1 and 5% probability levels, respectively, by the F test. PH: plant height at 477 DAP (cm); PD: plant diameter at 477 DAP (cm); OSI: orthotropic-shoot internode length (cm); PSI: plagiotropic-shoot internode length (cm); MFW:
mature fruit weight (g); MFV: mature fruit volume (mL); MFD: mature fruit density; PR: grain processing rate (% w/w); YLD:
It should be stressed that the genotypes belonging to variety Vitoria (V1, V2, V4, V5, V7, V8, V9, V10, and Emcapa 153) did not necessarily show the lowest distances, combining with each other, which corroborates the results obtained
by Fonseca et al. (2006) in an evaluation of 32 genotypes of conilon coffee belonging to three clonal varieties. These authors remarked that crosses of greater interest are not always found among germplasms of distinct varieties.
TABLE III
Average, maximum, and minimum dissimilarity for 30 promising registered Coffea canephora genotypes based on generalized Mahalanobis distance (D2), considering 15 morpho-agronomic traits1. Vila Valério - ES, Brazil.
Genotype Average
dissimilarity
Maximum dissimilarity Minimum dissimilarity
Genotype Distance Genotype Distance
1 44.56455 23 159.139842 11 16.338563
2 42.37869 23 171.486173 6 8.380784
3 42.86718 23 160.405796 6 5.309058
4 45.72179 23 138.149287 7 15.940578
5 44.36534 23 121.645149 19 18.294495
6 34.70369 23 136.208307 15 5.003676
7 27.95849 23 108.498885 19 8.787921
8 62.69844 23 156.749164 5 32.325622
9 54.94184 23 152.761368 14 25.273979
10 66.19208 23 256.432611 17 25.995628
11 42.73313 23 156.990554 21 7.673506
12 85.16450 17 125.760347 22 31.701214
13 35.69210 23 82.246938 7 12.512651
14 29.94187 23 131.795703 7 8.899016
15 39.34052 23 131.736855 6 5.003676
16 43.51350 23 115.003605 7 16.578355
17 59.97461 23 250.088603 20 22.282136
18 44.66841 23 172.942595 25 10.809870
19 34.89041 23 125.698329 7 8.787921
20 48.43194 23 224.798217 2 21.668399
21 36.51560 23 144.725625 11 7.673506
22 43.97228 23 128.370045 7 16.221329
23 145.71600 10 256.432611 30 76.313264
24 44.18330 23 118.254270 14 15.618320
25 47.43553 23 187.401413 18 10.809870
26 73.29632 23 126.203228 5 34.716500
27 41.08602 23 150.359086 14 14.049508
28 37.21266 23 93.131116 7 12.989153
29 45.66103 23 142.243507 18 13.493561
30 49.40958 10 89.263453 28 15.767228
1
Plant height and diameter at 477 DAP; length of the orthotropic - and plagiotropic- shoot internodes; weight, volume, and density
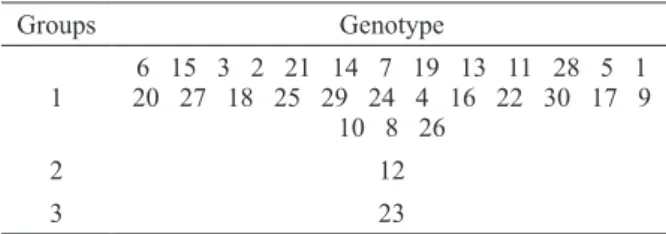
Clustering by Tocher’s optimization method, using the generalized Mahalanobis distance (D2) as the genetic dissimilarity measure, for 15 morpho-agronomic traits, separated the 30 genotypes into three groups (Table IV).
The first group consisted of 28 genotypes,
including approximately 93% of the total genotypes
studied. This fact is related to the high dissimilarity presented by genotype 23, which was higher by
the order of 192.4% as compared with the overall
mean of the average dissimilarity (Table III). Similar results were found by Silva et al. (2015), who evaluated 56 genotypes of the genus Robusta
and also found 91% of the individuals associated with the first group.
Genotypes 12 (Beira Rio 8) and 23 (Pirata) were, separately, the second and the third groups, respectively, indicating that these are the most divergent. Tocher’s optimization method minimizes the intra-group distance and maximizes the inter-group distance (Cruz et al. 2014); in this way, more divergent combinations should be obtained with genotypes allocated in distinct groups.
Studies reporting the use of Tocher’s method for clustering C. canephora genotypes were also conducted by Fonseca et al. (2006), who worked with 32 clones of three clonal varieties; by Ivoglo et al. (2008), with 21 progenies of half-siblings; and by Covre et al. (2016), with 34 promising genotypes, who reported the formation of three, four, and eight groups, respectively.
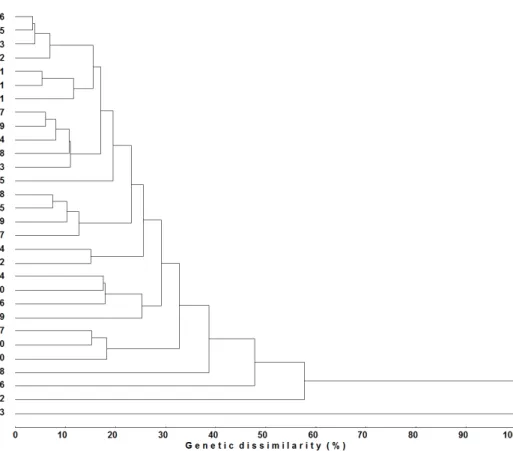
Clustering by the UPGMA hierarchical method, using the generalized Mahalanobis distance (D2) as a measure of genetic dissimilarity, enabled the generation of the dendrogram illustrating the genetic distance among the studied genotypes. When the maximum dissimilarity limit
of 50% was established among genotypes for them
to be included in the same group, three groups were formed (Figure 1).
The groups formed by the UPGMA method,
assuming a maximum dissimilarity limit of 50%
among the genotypes, were formed similarly to those generated by Tocher’s method, increasing the consistency between the clustering methods. Similarities between Tocher’s and UPGMA hierarchical method were also observed by Ivoglo et al. (2008), Guedes et al. (2013), and Covre et al. (2016), who established the maximum limits of
dissimilarity among genotypes as 15%, 45%, and 50%, respectively
Except for genotypes 30 and 10, all the others that represented the most dissimilar parents based on the generalized Mahalanobis distance (D2)
(Table III) were allocated in distinct groups by both Tocher’s optimization (Table IV) and the UPGMA hierarchical method (Figure 1), increasing the reliability in the use of clusters to establish divergent combinations. Motta et al. (2014) evaluated C. arabica and C. canephora genotypes and also observed that the most dissimilar genotypes based on Jaccard’s index were mostly allocated in distinct groups by UPGMA.
The study of the relative contribution of the 15 morpho-agronomic traits for genetic diversity among the 30 C. canephora genotypes, according to Singh (1981)’s method, showed values between
0.015 and 19.080% (Table V).
The traits that most contributed were mature
fruit weight (19.08%), average yield (15.50%), plant diameter (12.42%), and orthotropic-shoot internode length (10.94%); these four variables accounted for 58% of the genetic divergence
TABLE IV
Clusters formed from 30 promising registered Coffea canephora genotypes, obtained by Tocher’s method, based
on generalized Mahalanobis distance (D2), considering 15 morpho-agronomic traits. Vila Valério - ES, Brazil.
Groups Genotype
1
6 15 3 2 21 14 7 19 13 11 28 5 1 20 27 18 25 29 24 4 16 22 30 17 9
10 8 26
2 12
among the studied genotypes. Guedes et al. (2013)
evaluated 27 traits in 12 accessions of coffee (C. arabica L.) var. Maragogipe and Ivoglo et al. (2008) evaluated 14 traits in 21 progenies of C.
canephora half-siblings and observed yield as one of the traits that most contributed to divergence
among the studied genotypes, with 22.7 and 10.5%,
respectively.
Fruit density (0.015), in turn, was the trait that least contributed to genetic diversity, and
when it was discarded, it did not lead to significant
alterations in the clusters obtained by Tocher’s method; therefore, in subsequent evaluations, less importance can be assigned to this trait.
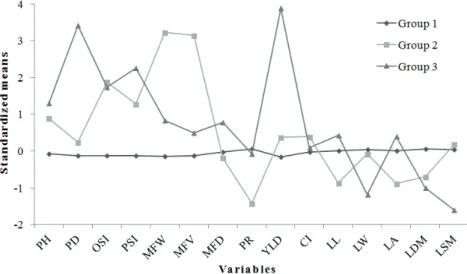
Figure 2 shows the standardized means for morpho-agronomic traits in each group formed by Tocher’s optimization method. This graph allows
us to know the traits that differentiate each group.
It is clear that among the traits of greatest relative contribution (Table V), those which characterize group 2 are fruits of larger weight and volume and lower grain processing rate. Group 3, in turn is characterized by plants with larger diameter and higher yield (Figure 2).
Despite the genetic diversity detected among the genotypes, breeders are usually interested only in the superior individuals with respect to some
traits, with sufficient diversity to generate variability
in the segregating population (Guedes et al. 2013). In C. canephora breeding programs, breeders aim at genotypes that, among other features, provide higher yields and produce larger grains (Ferreira et al. 2005). In this scenario, the genotypes from groups 2 and 3 showed to be promising, because in addition to their genetic diversity, they exhibit traits of agronomic interest (Figure 2).
Figure 1 - Dendrogram representing the genetic dissimilarity among 30 promising registered
Coffea canephora genotypes, obtained by the UPGMA cluster method, using generalized Mahalanobis distance (D2
), considering 15 morpho-agronomic traits. Note: cophenetic correlation
After the evaluations, the materials called Beira Rio 8, Bamburral, Clementino, Pirata, Verdin R and A1 constituted a new variety called Tributum, which is registered by UFES. The average of four harvests of the six genotypes was 90.87 bags
benefited (60 kg) per hectare.
CONCLUSIONS
There is genetic diversity among the 30 promising registered C. canephora evaluated here, indicating high potential for use in future breeding actions; genotypes Pirata (promising) and Beira Rio 8 (promising) were the most divergent. Tocher’s and UPGMA hierarchical methods showed consistency in the grouping of genotypes, separating them similarly into two groups; of the analyzed traits, mature fruit weight, average productivity, plant diameter, and orthotropic-shoot internode
length were the most efficient in explaining the
dissimilarity among the genotypes.
ACKNOWLEDGMENTS
The authors would like to thank the Conselho Nacional de Desenvolvimento Científico e Tecnológico (CNPq) and Coordenação de Aperfeiçoamento de Pessoal de Nível Superior TABLE V
Relative contribution of 15 morpho-agronomic traits
for genetic diversity in 30 promising registered Coffea
canephora genotypes based on Singh (1981)’s method, using generalized Mahalanobis distance (D2). Vila Valério
- ES, Brazil.
Traits S.j Value (%)
MFW 4125.755056 19.080
YLD 3352.028483 15.502
PD 2685.260696 12.418
OSI 2366.094264 10.942
PSI 1893.711330 8.758
PR 1728.743733 7.995
LDM 1542.608442 7.134
PH 1299.638652 6.010
MFV 968.399258 4.478
CI 602.932788 2.788
LA 382.716226 1.770
LW 272.011552 1.258
LSM 211.840563 0.980
LL 188.668397 0.872
MFD 3.284616 0.015
PH: plant height at 477 DAP; PD: plant diameter at 477 DAP; OSI: orthotropic-shoot internode length; PSI: plagiotropic-shoot internode length; MFW: mature fruit weight; MFV: mature fruit volume; MFD: mature fruit density; PR: grain processing rate; YLD: average yield of the 2014 and 2015 crops; CI: chlorophyll index; LL: leaf length; LW: leaf width;
LA: leaf area; LDM: leaf dry mass; LSM: leaf specific mass.
(CAPES) for financial support, as well as the owner
of the land.
REFERENCES
ALVARES CA, STAPE JL, SENTELHAS PC, GONÇALVES JLM AND SPAROVEK G. 2013. Köppen’s climate classification map for Brazil. Meteorol Z 22: 711-728. ANA - AGÊNCIA NACIONAL DE ÁGUAS. 2015. A bacia
do Rio Doce: características da bacia. Available at: <http://www.ana.gov.br/cbhriodoce/bacia/caracterizacao. asp#clima>. Accessed on Jan 19, 2015.
CARVALHO A, MEDINA FILHO HP, FAZUOLI LC, GUERREIRO FILHO O AND LIMA MMA. 1991. Aspectos genéticos do cafeeiro. Rev Bras Genet 14: 135-183.
CONAGIN CHTM AND MENDES AJT. 1961. Pesquisas citológicas e genéticas em três espécies de Coffea. Auto-incompatibilidade em Coffea canephora Pierre ex Froehner. Bragantia 20: 787-804.
COVRE AM, CANAL L, PARTELLI FL, ALEXANDRE RS, FERREIRA A AND VIEIRA HD. 2016. Development of clonal seedlings of promising Conilon coffee (Coffea
canephora) genotypes. Aust J Crop Sci 10: 385-392. CRUZ CD. 2013. GENES - a software package for analysis in
experimental statistics and quantitative genetics. Acta Sci Agron 35: 271-276.
CRUZ CD, CARNEIRO PCS AND REGAZZI AJ. 2014. Modelos biométricos aplicados ao melhoramento genético, 3rd
ed., Viçosa: UFV, 668 p.
CUBRY P, BELLINS F, POT D, MUSOLI P AND LEROY T. 2013. Global analysis of Coffea canephora Pierre ex Froehner (Rubiaceae) from the Guineo-Congolese region reveals impacts from climatic refuges and migration effects. Genet Resour Crop Evol 60: 483-501.
DALCOMO JM, VIEIRA HD, FERREIRA A, LIMA WL, FERRÃO RG, FONSECA AFA, FERRÃO MAG AND PARTELLI FL. 2015. Evaluation of genetic divergence among clones of conilon coffee after scheduled cycle pruning. Genet Mol Res 14: 15417-15426.
DAVIS, AP, TOSH J, RUCH N AND FAY MF. 2011. Growing coffee: Psilanthus (Rubiaceae) subsumed on the basis of molecular and morphological data; implications for the size, morphology, distribution and evolutionary history of
Coffea. Bot J Linn Soc 167: 357-377.
DENOEUD F, CARRETERO-PAULET L, DEREEPER A, DROC G, GUYOT R, PIETRELLA M, ZHENG C, ALBERTI A, ANTHONY F AND APREA G. 2014. The coffee genome provides insight into the convergent evolution of caffeine biosynthesis. Science 345: 1181-1184.
DIAS FP, SOUZA CAS, MENDES ANG, CARVALHO SPN, RASO BSM AND BOTELHO CE. 2005. Caracterização
de progênies do cafeeiro (Coffea arabica L.) selecionadas em Minas Gerais. Rev Ceres 299: 101-114.
FERREIRA A, CECON PR, CRUZ CD, FERRÃO RG, SILVA MF, FONSECA AFA AND FERRÃO MAG. 2005. Seleção simultânea de Coffea canephora por meio da combinação de análise de fatores e índices de seleção. Pesq Agropec Bras 40: 1189-1195.
FONSECA AFA, SEDIYAMA T, CRUZ CD, SAKAIYAMA NS, FERRÃO MAG, FERRÃO RG AND BRAGANÇA SM. 2006. Divergência genética em café conilon. Pesq Agropec Bras 41: 599-605.
GUEDES JM, VILELA DJM, REZENDE JC, SILVA FL, BOTELHO CE AND CARVALHO SP. 2013. Divergência genética entre cafeeiros do germoplasma Maragogipe. Bragantia: 72: 127-132.
ICO - INTERNATIONAL COFFEE ORGANIZATION. 2017. Dados Históricos. Available at: <http://www.ico.org/ prices/po-production.pdf>. Accessed on Jan 25, 2017. IVOGLO MG, FAZUOLI LC, OLIVEIRA ACB, GALLO
PB, MISTRO JC, SILVAROLLA MB AND TOMA-BRAGHINI M. 2008. Divergência genética entre progênies de café robusta. Bragantia 67: 823-831.
MOHANAN S, SATYANARAYANA KV, SRIDEVI V, GOWDA K, GIRIDHAR P, CHANDRASHEKAR A AND RAVISHANKAR GA. 2014. Evaluating the effect and effectiveness of different constructs with a conserved sequence for silencing of Coffea canephora N-methyltransferases. J Plant Biochem Biotechnol 23: 399-409.
MONTAGNON C, CUBRY P AND LEROY T. 2012. Amélioration génétique du caféier Coffea canephora Pierre: connaissances acquises, stratégies et perspectives. Cah Agric 23: 143-153.
MOTTA LB, SOARES TC, FERRÃO MAG, CAIXETA ET, LORENZONI RM AND SOUZA NETO JD. 2014. Molecular characterization of Arabica and Conilon coffee plants genotypes by SSR and ISSR markers. Braz Arch Biol Technol 57: 728-735.
MOURA WM, SOARES YJB, AMARAL JÚNIOR AT, LIMA PC, MARTINEZ HEP AND GRAVINA GA. 2015. Genetic diversity in arabica coffee grown in potassium-constrained environment. Ciênc Agrotec 39: 23-31.
PARTELLI FL, VIEIRA HD, DETMANN E AND CAMPOSTRINI E. 2006. Estimativa da área foliar do cafeeiro a partir do comprimento da folha. Rev Ceres 53: 204-210.
PIMENTEL-GOMES P. 2009. Curso de Estatística Experimental. 15th
ed., Piracicaba: FEALQ, 451 p. ROBBRECHT E AND MANEN JF. 2006. The major
atpB-rbcL data. A new classification in two subfamilies, Cinchonoideae and Rubioideae. Syst Geogr Pl 76: 85-146. ROCHA RB, SANTOS DV, RAMALHO AR AND TEIXEIRA
AL. 2013. Caracterização e uso da variabilidade genética de banco ativo de germoplasma de Coffea canephora Pierre ex Froehner. Coffee Sci 8: 478-485.
RODRIGUES WP, VIEIRA HD, BARBOSA DHSG, SOUSA FILHO GR AND PARTELLI FL. 2014. Agronomic performance of arabica coffee genotypes in northwest Rio de Janeiro State. Genet Mol Res 13: 5664-5673.
RODRIGUES WP, VIEIRA HD, TEODORO PE, PARTELLI FL AND BARBOSA DHSG. 2016. Assessment of genetic divergence among coffee genotypes by Ward-MLM procedure in association with mixed models. Genet Mol Res 15:1-7.
SILVA FL, BAFFA DCF, OLIVEIRA ACB, PEREIRA AA AND BONOMO VS. 2013. Integração de dados quantitativos e multicategóricos na determinação da divergência genética entre acessos de cafeeiro. Bragantia 72: 224-229.
SILVA FL, BAFFA DCF, REZENDE JC, OLIVEIRA ACB, PEREIRA AA AND CRUZ CD. 2015. Variabilidade genética entre genótipos de café robustas no estado de Minas Gerais. Coffee Sci 10: 20-27.
SINGH D. 1981. The relative importance of characters affecting genetic divergence. Indian J Genet Pl Br 41: 237-245.