Annales
Geophysicae
Persistence of the planetary wave type oscillations in
fo
F2 over
Europe
J. Laˇstoviˇcka, P. Kriˇzan, P. ˇSauli, and D. Novotn´a
Institute of Atmospheric Physics, Acad. Sci. Czech Rep., Boˇcn´ı II, 141 31 Prague 4, Czech Republic Received: 30 September 2002 – Revised: 26 November 2002 – Accepted: 3 December 2002
Abstract.Planetary waves are oscillations of very predomi-nantly tropospheric origin with typical periods of about 2–30 days. Their dominant zonal wave numbers are 1, 2 and 3, i.e. the waves are of large-scale (global) character. The plan-etary wave type oscillations have been observed in the lower and middle atmosphere but also in the ionosphere, includ-ing the ionospheric F2-layer. Here, we deal only with the oscillations analyzed for four European stations over a solar cycle with the use of the Meyer and Morlet wavelet trans-forms. Waves with periods near 5, 10 and 16 days are stud-ied. Only events with a duration of three wave-cycles and more are considered. The 5-day period wave events display a typical duration of 4 cycles, while 10- and 16-day wave events are less persistent, with a typical duration of about 3.5 cycles and 3 cycles, respectively. The persistence pattern in terms of number of cycles and in terms of number of days is different. In terms of number of cycles, the typical persis-tence of oscillations decreases with increasing period. On the other hand, in terms of number of days the typical persistence evidently increases with increasing period. The spectral dis-tribution of event duration is too broad to allow for a reason-able prediction of event duration. Thus, the predictability of the planetary wave type oscillations infoF2 seems to be very questionable.
Key words. Ionosphere (ionosphere-atmosphere interac-tion, mid-latitude ionosphere, ionospheric disturbances) – Meteorology and atmospheric dynamics (waves and tides)
1 Introduction
Planetary waves are oscillations with typical periods of about 2–30 days. Their dominant zonal wave numbers are 1, 2 and 3, i.e. the waves are of large-scale (global) character, and they are very predominantly of tropospheric origin (e.g. Vincent, 1990). The planetary waves are divided into two Correspondence to:J. Laˇstoviˇcka
groups, the stationary planetary waves, associated with the quasi-stable meteorological structures, such as the Icelandic pressure low, etc., and the transient planetary waves, which propagate predominantly westward, even though sometimes (rarely) the eastward propagation dominates (Pancheva and Laˇstoviˇcka, 1998). The planetary waves, together with the tidal and gravity waves, appear to be the most important and persistent components of the effects on the ionosphere from “below”.
The planetary waves propagating upwards from the tro-posphere have to pass through the lower ionosphere (h <
100 km). Investigations of the transient planetary wave ac-tivity in the lower ionosphere (in its ionized component) are based on the long-term measurements of the radio-wave absorption in the lower ionosphere over Europe by the A3 method (continuous wave, oblique incidence on the iono-sphere). The planetary wave activity has been studied in the period range of 3–15 days. The best-developed and most persistent spectral peaks in the range of 3–15 days over the 1980s occurred near 5 and 10 days (Laˇstoviˇcka and Pancheva, 1991). They are consistent with the eigenperi-ods of the atmosphere of about 2, 5, 10 and 16 days. The planetary wave type oscillations were shown to be caused by the planetary wave type oscillations in the neutral atmo-sphere, and not by solar or geomagnetic activity (Pancheva et al., 1989; Pancheva and Laˇstoviˇcka, 1989). Model compu-tations confirmed adequate transformation of planetary wave type oscillations in the neutral atmosphere into waves in the radio-wave absorption (Laˇstoviˇcka et al., 1994). The plane-tary wave type oscillations in the lower ionosphere have been studied in a series of papers, e.g. Laˇstoviˇcka and Pancheva (1991), Laˇstoviˇcka et al. (1994), Laˇstoviˇcka (1997, 2001 and references herein), Pancheva and Laˇstoviˇcka (1998). The planetary wave activity in the lower ionosphere is higher in winter than in summer due to the different conditions of the upward penetration of planetary waves, and it exhibits a slight trend of increasing amplitude (e.g. Laˇstoviˇcka, 2001)
e.g. Forbes and Leveroni (1992), Canziani (1994), Pancheva et al. (1994), Apostolov et al. (1995, 1998), Altadill and Laˇstoviˇcka (1996), Laˇstoviˇcka and Mlch (1996), Laˇstoviˇcka (1997), Meyer and Forbes (1997), Laˇstoviˇcka and ˇSauli (1999), Forbes et al. (2000), Altadill et al. (2001). Altadill and Apostolov (1998, 2001) analyzed six events of both the upward propagation and the downward propagation of the wave-type oscillations with periods of 2 and 6.5 days. They attributed all three upward propagating events to plane-tary waves observed simultaneously in the mesosphere/lower thermosphere region. The downward propagating events had a different relation between group and phase velocities. One of these events was attributed to a periodic geomagnetic ac-tivity. Thus, not every oscillation in the period range 2–30 days in the F-region can be considered a planetary wave os-cillation, even though the majority of such oscillations can be attributed to planetary waves. There is a strong solar-origin oscillation with periods near 27 days (the solar rotation), and partly also at 13–14 days (half of the solar rotation), there-fore, these periods are not analyzed herein.
Some studies report simultaneous observations of plane-tary waves in the lower and upper ionosphere, as, for in-stance, Pancheva et al. (1994), for some 2-day events (but not all events) and Yi and Chen (1994) for low latitudes. How-ever, such observations create a problem for theory, because the planetary waves in the neutral atmosphere cannot propa-gate directly upwards to the F2-region peak heights due to the atmospheric viscosity and other factors. Therefore, we need to look for indirect ways of propagation. One possibility is the planetary wave modulation of the upward propagating tides in the mesosphere and lower thermosphere (MLT) re-gion. Such a modulation has been observationally confirmed to occur in the wind in the MLT region in correspondence with theoretical expectations (Mitchell et al., 1996; Beard et al., 1999; Pancheva, 2001 and references herein). Laˇstoviˇcka and ˇSauli (1999) investigated the variability offoF2 from two Central European stations, Juliusruh and Pr˚uhonice, and the tides inferred from wind measurements in the MLT region at nearby station Collm. They found that the planetary wave modulation of the upward propagating tides in the MLT re-gion did not play a dominant role, but it might contribute to the planetary wave type oscillations infoF2.
Another possibility is the planetary wave modulation of the upward propagating gravity waves (Meyer, 1999). Ob-servational confirmation and quantification of the role of the “gravity wave” mechanism remains difficult due to data problems; we need to find a gravity wave parameter which is persistent on time scales of days (Laˇstoviˇcka, 1999). Other possibilities of an indirect upward propagation via planetary wave modulation of various upward propagating agents at the upper mesospheric/lower thermospheric heights are: (i) the vertical plasma drift due to the planetary wave modula-tion of the E-region dynamo (Pancheva et al., 1994), and (ii) modulation of the turbopause height and turbopause region properties.
The quasi-two-day oscillations in foF2 have some spe-cific features that are different from longer periods. Their
behaviour was studied , for example, by Apostolov et al. (1995) and Pancheva et al. (1994). One of these specific features is a combination of three different types of oscil-lations: the westward travelling wave with the wave num-ber one (this oscillation has the wave numnum-ber three in the MLT region), the stationary planetary wave, and more lo-cal oscillations. Therefore, we shall deal with the 5-, 10-and 16-day oscillations, 10-and not with the 2-day oscillations. If we assume that spectral peaks of the F2-region ionizing radiation are similar to those of the Lyman-alpha flux, then the three selected periods cannot be caused by solar radia-tion variability, as follows from the results of Pancheva and Laˇstoviˇcka (1989). Some oscillations nearT =5 days might
be of geomagnetic activity origin (Pancheva et al., 1989; Al-tadill and Apostolov, 1998, 2001). However, we analyze only oscillation events of duration of at least three wave-cycles, where the probability of oscillations of other than the plane-tary wave origin is very low, practically negligible.
All observed planetary wave periods are unstable and/or quasi-periods, therefore, we use data from the period bands of 4–6, 9–11 and 15–18 days as representative for the 5-, 10-and 16-day periods, respectively. This migration of periods was also confirmed by wind measurements at similar heights (e.g. Williams and Avery, 1992; Beard et al., 2001). The background wind is probably responsible for the migration of periods (Beard et al., 2001).
The transient planetary waves in the atmosphere and iono-sphere seem to occur in the form of bursts of a couple of waves with limited persistence. Potential predictability of planetary wave effects for the sake of predictions of the iono-spheric radio-wave propagation conditions needs some in-formation about the persistence of the planetary wave type events in the ionosphere. In the stratosphere, the waves with periods of 4–5 days occur as bursts of several cycles, as de-duced from satellite measurements of temperature fields. In the mesosphere, satellite measurements of winds at altitudes of 50–100 km reveal the transient 5-day wave with a life-time of 10–20 days (Wu et al., 1994). In the mesopause region the tidal winds observed in Central Europe (Collm) in the first half of 1984 were dominated by oscillations with typical periods of 5–6 days, with a typical persistence of 6 cycles for meridional and 4 cycles for zonal component (Laˇstoviˇcka and ˇSauli, 1999). Also, meteor radar wind mea-surements from Sheffield confirm the episodic nature of plan-etary waves (Beard et al., 2001). An analysis of two long data sets of the radio-wave absorption in the lower ionosphere over Central Europe showed that in the lower ionosphere, the typical persistence of waves with period (T) of about 5
days was about 5 cycles,T =10 days for 3–4 cycles, and for
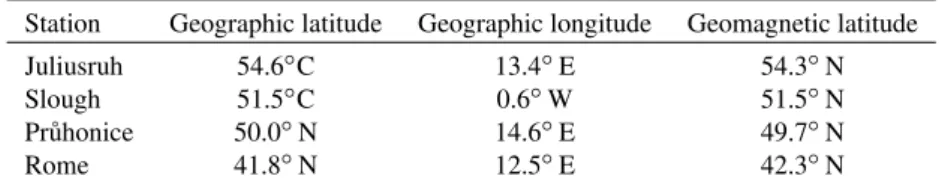
oscilla-Table 1.Coordinates of ionospheric stations
Station Geographic latitude Geographic longitude Geomagnetic latitude
Juliusruh 54.6◦C 13.4◦E 54.3◦N
Slough 51.5◦C 0.6◦W 51.5◦N
Pr˚uhonice 50.0◦N 14.6◦E 49.7◦N
Rome 41.8◦N 12.5◦E 42.3◦N
tions with a period of 6.5 days. It should be mentioned that Lindzen et al. (1984) already suggested that the existence of propagating external Rossby modes in the atmosphere was episodic.
We investigate the persistence of the planetary wave type oscillations over Europe, among others, in order to clarify the possible predictability of such oscillations with applications to the radio-wave propagation conditions (e.g. in project COST271), and for a better understanding of the coupling of the lower and upper atmosphere. A brief description of data and methods in Sect. 2 is followed by the Meyer wavelet analysis results in Sect. 3 and the Morlet wavelet analysis re-sults in Sect. 4. The rere-sults are briefly discussed in Sect. 5 and summarized in Conclusions.
2 Data and method
As the analyzed ionospheric parameter we use the basic char-acteristics of the F2-region, the widely available critical fre-quency foF2. Data from four stations, which are typical for the European area (except Russia), Juliusruh, Slough, Pr˚uhonice and Rome, are used over the period 1979–1989 (from maximum to maximum of the solar cycle). The coor-dinates of those four stations are listed in Table 1. Noontime (10:00–14:00 UT) average values offoF2 are used. Some-times there are problems with the quality and availability of foF2 data with some stations for some periods (Bureˇsov´a, 1997). The above stations and the analyzed period were se-lected by taking such problems into account. Therefore, good quality data with minimum gaps are used in the paper. Sin-gle data gaps were interpolated with the use of data of the same station at other local times and/or from neighbouring stations at the same time, or a combination of both, based on the availability of data. Nevertheless, Rome, January–June 1979 and Pr˚uhonice 1989 data have not been taken into anal-ysis due to more data gaps.
In our previous study of the persistence of the plane-tary wave type oscillations in the F2-region (Laˇstoviˇcka and ˇSauli, 1999) we used the autocorrelation method. The auto-correlation can yield information about the persistence only for a dominant wave, if a well-dominant wave exists. If not, this method does not reveal reasonable information about the persistence. To overcome this problem, the wavelet analy-sis applied to consecutive 1-year long intervals, shifted by half a year, was used in searching for the persistence of the planetary wave oscillation events in the lower ionosphere by
Laˇstoviˇcka et al. (2002). Time series were analyzed by a continuous wavelet transform. The Meyer wavelet was used from the family of wavelet functions.
The wavelet analysis is a powerful tool for analysing lo-calised variations of power within a time series. The method allows for the decomposition of one-dimensional series into the time-period space, where it is possible to determine both the dominant modes of variability and how those modes vary in time. The wavelet analysis can be used to analyze time se-ries that contain non-stationary power at many different fre-quencies. The continuous wavelet transform is defined as the convolution of signal with a scaled and translated ver-sion of wavelet function. By varying the wavelet scale and translating along the localised time it is possible to construct a picture showing both the amplitude of any feature versus the scale and how this amplitude varies with time. In the paper we apply two types of continuous wavelet analysis, the Meyer wavelet and the Morlet wavelet analyses. The Meyer wavelet is an infinitely regular orthogonal symmetric wavelet. Its definition and scaling functions are more com-plicated than for most of the other famous wavelets, so inter-ested readers should look for details in Daubechies (1994). A commercial MATLAB-Wavelet software has been used to compute Meyer wavelet transform.
The Morlet wavelet consists of a plane wave modulated by Gaussian (Torrence and Compo, 1998). The Morlet wavelet function is a complex function and the corresponding wavelet transform is also complex. The Morlet wavelet with param-eter 7 is used. As a source Matlab code the wavelet soft-ware for Morlet wavelet computations provided by Torrence and Compo was used. Matlab codes are available at URL: http://paos.colorado.edu/research/wavelets/.
The wavelet analysis is applied to consecutive 1-year long intervals, shifted by half a year (January–December 1979, July 1979–June 1980, January–December 1980, etc.). Thus, for Slough and Juliusruh we have 21 partly overlapping in-tervals for the period 1979–1989, for Rome 20 inin-tervals and for Pr˚uhonice 19 intervals.
3 Results of the Meyer wavelet analysis
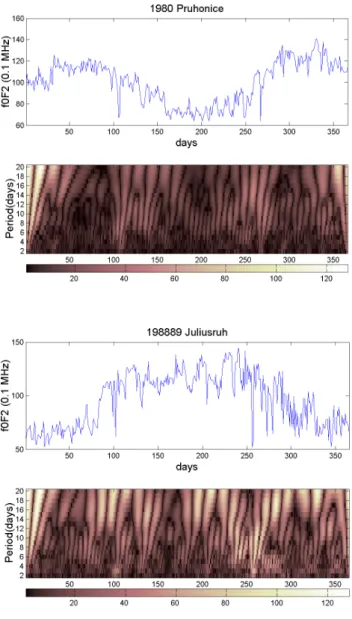
January-Fig. 1.Planetary wave activity inferred
from foF2 for Pr˚uhonice, January–
December 1980, Meyer wavelet trans-form. Top panel, time series of rawfoF2 data. Bottom panel, wavelet transform of the planetary wave activity changing by colour from black-brown (minimum value) to white (maximum value).
Fig. 2. Planetary wave activity in-ferred from foF2 for Juliusruh, July 1988–June 1989, Meyer wavelet trans-form. Top panel, time series of rawfoF2 data. Bottom panel, wavelet transform of the planetary wave activity changing by colour from black-brown (minimum values) to white (maximum values).
December, whereas Fig. 2 is for July–June. Top panels in Figs. 1–3 show time series of the rawfoF2 data with a well-developed seasonal variation with summer minimum, partic-ularly under high solar activity conditions (Figs. 1 and 2). Bottom panels in Figs. 1–3, the results of the Meyer wavelet analysis, must be interpreted taking into account the sea-sonally variable level of the backgroundfoF2 shown in top panels. Two planetary waves of the same amplitude in the neutral atmosphere will transfer into two planetary waves in foF2 with different amplitudes due to the different level of the backgroundfoF2. In other words, we need to consider the kind of “relative” amplitudes and/or power.
The most pronounced feature of Figs. 1–3 is a large tem-poral and partly spectral variability of the planetary wave ac-tivity. The migration of periods of planetary wave activity is also well visible. The large temporal variability of the plane-tary wave activity means, in other words, the limited persis-tence of the individual planetary wave events. Furthermore, we focus on well-developed wave events, i.e. events with a persistence of at least 3 wave cycles. The colours in Figs. 1–
3 represent the events of relative brightening of a duration of at least three cycles with respect to their vicinity. This is a bit of a non-precise definition, but in view of the above effect of variable backgroundfoF2, it seems to be better than to fix a level of brightness for such a search. We have to consider relative brightening with respect to the vicinity of the events. The brightening at the edges of Figs. 1–3 are artifacts caused by border effects.
The statistics of duration of individual events of the en-hanced planetary wave activity for all yearly intervals and period bands centred at 5, 10 and 16 days is summarized in Table 2: number of events together with their mean, median and the most often occurring number of cycles for individual stations and the average values for all four stations. Due to the overlap of half-year shifted intervals, the majority of the events occur twice in these statistics.
Fig. 3. Planetary wave activity in-ferred fromfoF2 for Slough, January– December 1986, Meyer wavelet trans-form. Top panel, time series of rawfoF2 data. Bottom panel, wavelet transform of the planetary wave activity changing by colour from black-brown (minimum values) to white (maximum values).
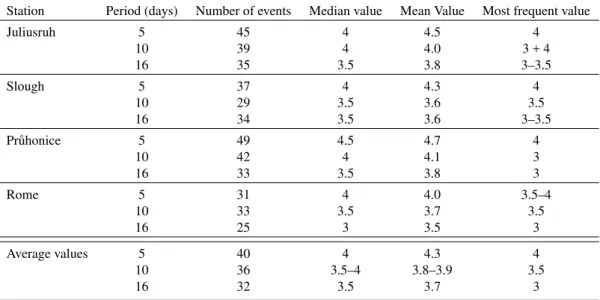
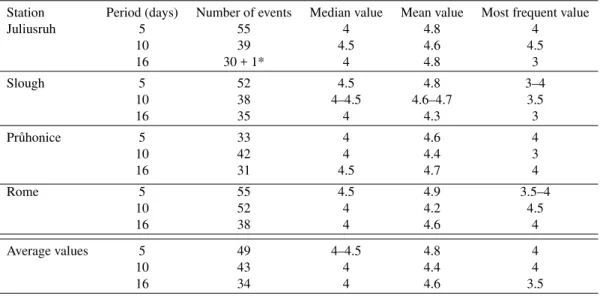
Table 2.Statistics of persistence of planetary wave type oscillations infoF2 over Europe, 1979–1989, based on the Meyer wavelet transform. The average values for medians and the most frequent values are presented with step 0.5
Station Period (days) Number of events Median value Mean Value Most frequent value
Juliusruh 5 45 4 4.5 4
10 39 4 4.0 3 + 4
16 35 3.5 3.8 3–3.5
Slough 5 37 4 4.3 4
10 29 3.5 3.6 3.5
16 34 3.5 3.6 3–3.5
Pr˚uhonice 5 49 4.5 4.7 4
10 42 4 4.1 3
16 33 3.5 3.8 3
Rome 5 31 4 4.0 3.5–4
10 33 3.5 3.7 3.5
16 25 3 3.5 3
Average values 5 40 4 4.3 4
10 36 3.5–4 3.8–3.9 3.5
16 32 3.5 3.7 3
by Laˇstoviˇcka and ˇSauli (1999) for a very limited data set. The coincidence of mean, median and the most often occur-ring number of cycles is slightly worse for the longer periods of 10 and 16 days, where all these characteristics provide the persistence smaller than 4 cycles. For 10 days, the me-dian value and the most frequent occurrence point to a typical persistence of 3.5 cycles. For 16 days, all values point to a typical persistence of 3–3.5 cycles. However, if we consider the most frequent value of 3 cycles and we also imagine the occurrence of events shorter than 3 cycles, then the typical persistence of events with periods around 16 days seems to be no more than 3 cycles. The spectrum of duration of the planetary wave events peaks near its lower cutoff duration of 3 cycles and has a relatively long tail in longer duration; therefore, the mean duration cannot be considered
represen-tative and/or close to the typical duration.
Thus, in terms of the number of cycles in the planetary wave events, the 5-day period wave events display the typical duration of 4 cycles, while 10- and 16-day events display 3.5 and no more than 3 cycles, respectively. However, in terms of days it means that there is a typical duration of 20 days forT =5 days, about 35 days forT =10 days and no more
than 48 days forT =16 days. In other words, the duration of
wave events in terms of days is not shorter for longer periods, but rather it seems to be longer. We are not going to analyze bursts shorter than 3 cycles, since the physical understanding of such variations and/or events as waves may be questioned. On the other hand, one season (90 days) is equal to 5.5 cycles withT =16 days. This means that for long periods we can
Prohonice January-December 1980
Day
Day
fo
F2
(0
.1
M
H
z)
Pe
rio
d
(d
ay
)
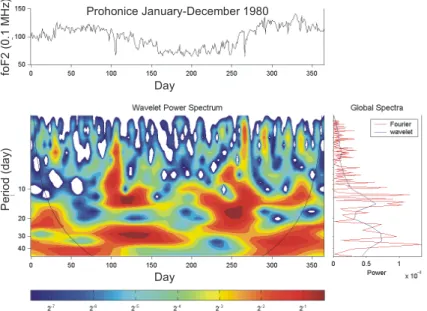
Fig. 4.Planetary wave activity inferred fromfoF2 for Pr˚uhonice, January–December 1980, Morlet wavelet transform. Top panel, time series of rawfoF2 data. Bottom left panel, wavelet transform power spectrum of the planetary wave activity changing by colour from white and black-blue (minimum values) through green to red and black-red (maximum values). Power spectrum is normalized to 1. Bottom right panel, global (over 365 days) Morlet wavelet and Fourier spectrum; horizontal axis – power; vertical axis – period of oscillations in days.
cycles. It has to be destroyed by the seasonal variation of the atmosphere and by various sporadic effects.
4 Results of the Morlet wavelet analysis
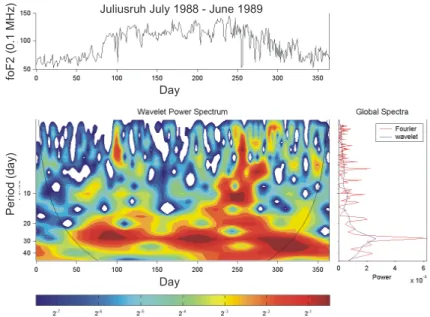
Figures 4–6 show examples of results of the Morlet wavelet power spectra normalized to a peak amplitude equal to 1. Again, 81 such pictures have been obtained for the four tions. Figures 4, 5 and 6 are for the same intervals and sta-tions as Figs. 1, 2 and 3. Figures 4 and 5 represent peri-ods of high solar activity, while Fig. 6 is for the solar cycle minimum year. Figures 4 and 6 are for January–December, whereas Fig. 5 is for July–June. Top panels in Figs. 4–6 show time series of the rawfoF2 data with a well-developed seasonal variation with summer minimum, particularly under high solar activity conditions.
Bottom left panels in Figs. 4–6 provide the results of the Morlet wavelet analysis. While the Meyer wavelet transform results (Figs. 1–3) are more suitable for the evaluation of the relative amplitudes/power with respect to the vicinity of the analyzed interval, the Morlet wavelet transform results are more suitable for the evaluation of the normalized absolute amplitude/power, i.e. a search for intervals with values larger than a fixed value. Even though the values shown in Figs. 4– 6 are normalized, their interpretation with respect to a fixed level, and not to vicinity of the given interval, is hereafter called “absolute amplitudes”. This allows us, among oth-ers, to compare the results of the relative and absolute ampli-tude/power approach to interpretation of the results. Bottom right panels in Figs. 4–6 show global (over 365 days) Mor-let waveMor-let transform and Fourier transform spectra, with the horizontal axis representing the power and the vertical axis
representing the period of oscillations in days. The Mor-let waveMor-let analysis reveals much better resolution in time and allows for the study of events of a (very) limited persis-tence/duration. The Fourier spectral analysis has in global values better resolution in periods but does not enable one to study events of limited duration and to localize their position. The most pronounced feature of Figs. 4–6 is again a large temporal and spectral variability of the planetary wave ac-tivity. The migration of periods of planetary wave activity is visible, even better than in Figs. 1–3. We again deal only with the well-developed wave events, i.e. events with a per-sistence of at least 3 waves. With Morlet wavelets we con-sider the normalized absolute amplitudes. In Figs. 4–6 we are not interested in the change in colour. We only consider intervals with a yellow or red colour of the duration of at least three wave cycles. Only results inside of the conus of significance (black thin curve) are taken into account. The border effects affect the information out of the thin curve. Figures 4–6 display a well developed and reasonably persis-tent∼27-day variation (particularly Fig. 5), which, however, is of solar origin and, therefore, out of the scope of the paper. The statistics of the duration/persistence of individual events of enhanced planetary wave activity for all yearly in-tervals and period bands centred at 5, 10 and 16 days is sum-marized in Table 3, as is the Meyer wavelet in Table 2: num-ber of events together with their mean, median and the most often occurring number of cycles for individual stations, and average values for all four stations. Numbers of events in Table 3 versus Table 2 differs due to the difference in their definition.
Juliusruh July 1988 - June 1989
Day
Day
Pe
riod
(d
ay)
foF
2
(0.
1
M
H
z)
Fig. 5. Planetary wave activity inferred fromfoF2 for Juliusruh, July 1988–June 1989, Morlet wavelet transform. Top panel, time series of rawfoF2 data. Bottom left panel, wavelet transform power spectrum of the planetary wave activity changing by colour from white and black-blue (minimum values) through green to red and black-red (maximum values). Power spectrum is normalized to 1. Bottom right panel - global (over 365 days) Morlet wavelet and Fourier spectrum; horizontal axis - power; vertical axis – period of oscillations in days.
Slough January-December 1986
Day Day
Pe
riod
(D
ay)
fo
F2
(0.
1
M
H
z)
Fig. 6. Planetary wave activity inferred fromfoF2 for Slough, January–December 1986, Morlet wavelet transform. Top panel, time series of rawfoF2 data. Bottom left panel, wavelet transform power spectrum of the planetary wave activity changing by colour from white and black-blue (minimum values) through green to red and black-red (maximum values). Power spectrum is normalized to 1. Bottom right panel - global (over 365 days) Morlet wavelet and Fourier spectrum; horizontal axis - power; vertical axis – period of oscillations in days.
more, based on median and the most frequent values. This is consistent with the persistence obtained from the Meyer wavelet transform by another way of evaluation, “relative” instead of “absolute” amplitudes. For the 10-day wave, both the median value and the most frequent occurrence provide the typical persistence of just 4 cycles. For the 16-day wave, the median and most frequent values point to a typical persis-tence of 3.5 cycles or slightly more. Thus, the persispersis-tence in terms of the number of cycles slightly decreases with
Table 3.Statistics of persistence of planetary wave type oscillations infoF2 over Europe, 1979–1989, based on the Morlet wavelet transform. The average values for medians and the most frequent values are presented with step 0.5
Station Period (days) Number of events Median value Mean value Most frequent value
Juliusruh 5 55 4 4.8 4
10 39 4.5 4.6 4.5
16 30 + 1* 4 4.8 3
Slough 5 52 4.5 4.8 3–4
10 38 4–4.5 4.6–4.7 3.5
16 35 4 4.3 3
Pr˚uhonice 5 33 4 4.6 4
10 42 4 4.4 3
16 31 4.5 4.7 4
Rome 5 55 4.5 4.9 3.5–4
10 52 4 4.2 4.5
16 38 4 4.6 4
Average values 5 49 4–4.5 4.8 4
10 43 4 4.4 4
16 34 4 4.6 3.5
1* –∼220 day long period of persistent occurrence in 1980
extremely long (≈220 days) event, which is not the case for the Meyer wavelet analysis (Table 2).
In terms of days the typical duration for the Morlet wavelet transform is 20 days or a little bit more, for T = 5 days,
about 40 days forT =10 days and about 54 days or a little
bit more forT = 16 days. In other words, the duration of
wave events in terms of days is not shorter for longer peri-ods, but rather it again seems to be longer. We are not going to analyze bursts shorter than 3 cycles, since the physical un-derstanding of such variations and/or events as waves may be questioned.
In order to exclude the possibility of some difference in the results due to a difference between the Meyer and Morlet wavelet techniques, the results of the Morlet wavelet trans-form (Figs. 4–6) are also interpreted in the same way as the results of the Meyer wavelet transform, i.e. in terms of rel-ative changes in power. For the 16-day wave, the results are the same as in Table 2. For shorter periods, particularly for
T =5 days, the number of wave events is slightly lower and
the average duration is slightly lower for the Morlet wavelet transform results, whereas median values are mostly identi-cal, with some by 0.5 lower, and the most typical values for the Morlet wavelet transform results are identical to those in Table 2. Thus, the overall pattern remains the same for both the Meyer and Morlet wavelet transform results. The minor differences observed might result from partly subjective eval-uation in the “relative” amplitude approach. The difference between the “absolute” amplitude and “relative” amplitude interpretation of the results is even slightly higher when we use the Morlet wavelet transform results instead of the Meyer wavelet transform results for the “relative” amplitudes. Nev-ertheless, the gross features of the results obtained by both means of interpretation are generally consistent.
5 Discussion
The foF2 data of four stations representative for the mid-latitudinal Europe, Juliusruh, Slough, Pr˚uhonice and Rome, were used to study the persistence of planetary wave events in the maximum of the F2-region of the ionosphere. The gen-eral pattern of persistence of the planetary wave type oscilla-tions is similar for all four staoscilla-tions in Tables 2 and 3 and, therefore, may be considered representative for European middle latitudes (except Russia). Slight differences may be caused by a slightly different data set, a limited amount of the analysed data, perhaps some local effects, as well as a different approach to the persistence evaluation in Tables 2 and 3. However, these differences appear to be within the ac-curacy of determination of persistence of the planetary wave type events.
Some planetary wave events have a sharp beginning and end. Then, the accuracy of the determination of persistence is given basically by the resolution of the software used. How-ever, the beginning and end of most events is not so sharp and the accuracy of the determination of persistence in such cases is between half and one wave cycle. Therefore, we can consider that the accuracy of determination of the typical per-sistence of planetary wave events is not worse than one wave cycle, but rather close to half a cycle. We are aware of the fact that such determination of accuracy does not look very scientific but by taking into account a partly vague definition of persistence and the accuracy of the input data, such an ap-proach that is a bit like “fuzzy mathematics” seems to be the right approach.
ˇSauli (1999) and Altadill et al. (2001) for very limited data sets. Also, in the lower ionosphere the typical persistence was found to be 5 cycles by Laˇstoviˇcka et al. (2002). This indicates the possibility of the persistence of 4–5 cycles to be typical for the 5-day wave oscillations in the upper atmo-sphere and ionoatmo-sphere over Central Europe. Wu et al. (1994) reported shorter persistence for the 5-day wave events in the mesospheric winds as observed by HRDI/UARS. This might be caused either by different criteria for persistence, or by a difference in latitudes (UARS observations of planetary waves concern predominantly low latitudes). On the other hand, Laˇstoviˇcka and ˇSauli (1999) found the typical per-sistence of the 5-day wave events in the tidal wind in the mesopause region in Central Europe to be 4 cycles for the zonal component and 6 cycles for the meridional component. As for the persistence of oscillations with periods near 10 and 16 days, we have no available information about the persis-tence of such oscillations in other parameters.
The pattern for the persistence in terms of number of cy-cles and in terms of number of days is different. In terms of number of cycles, the persistence of oscillations decreases with increasing period. On the other hand, in terms of num-ber of days, the persistence increases with increasing period. Both these results may be intuitively expected, taking into ac-count seasonal variation that creates a problem mainly for the longer periods, and the occurrence of sporadic events, which disturb the shorter periods more.
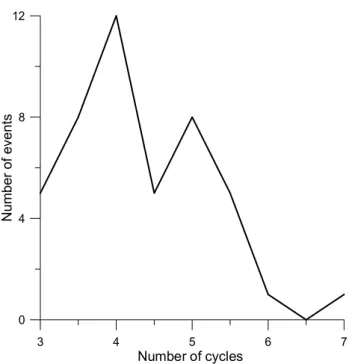
We investigate the persistence of the planetary wave type oscillations over Europe, among others, in order to clarify the possible predictability of such oscillations with applica-tions to the predicapplica-tions of the radio-wave propagation condi-tions. For the sake of predictions, not only typical values of the persistence of planetary wave type events, but also spec-tral distribution of persistence (= event duration) is necessary. An example of the spectral distribution of event duration is shown in Fig. 7. The spectral distribution is too broad to allow for a reasonable prediction of event duration. More-over, Figs. 1–6 display many events with a duration shorter than three cycles, which was the lower limit of events stud-ied. Thus, the predictability of the planetary wave type os-cillations infoF2 seems to be very questionable. Unfortu-nately, we will probably be unable to separate these effects from the prediction noise, thereby improving the quality of radio-wave propagation predictions in such a way.
6 Conclusions
The basic characteristics of the F2-region, the critical fre-quency foF2, was analyzed for four European stations, Juliusruh, Slough, Pr˚uhonice and Rome over the period 1979–1989 (one solar cycle). Noontime average values (10:00–14:00 UT) offoF2 were used. The persistence of the planetary wave type oscillations at periods near 5, 10 and 16 days was studied with the use of the Meyer and Morlet wavelet transforms. Only events with a duration of three cy-cles or more were considered.
3 4 5 6 7
Number of cycles
0 4 8 12
Number
of
event
s
Fig. 7. Spectral distribution of the duration of the planetary wave type oscillation events (= persistence) in terms of number of cycles for the 5-day wave, station Juliusruh, 1979–1989.
The Meyer wavelet transform results were evaluated from the point of view of the relative enhancement of oscillation intensity with respect to surrounding “background” level (i.e. relative amplitudes of oscillations). The 5-day period wave events displayed a typical duration of 4 cycles, while 10- and 16-day wave events displayed 3.5 and no more than 3 cycles, respectively.
The Morlet wavelet transform results evaluated in the same way as the Meyer wavelet transform revealed almost identical results. However, the Morlet wavelet transform re-sults were also evaluated from another point of view, as the increase in oscillation intensity above a fixed level (i.e. nor-malized absolute amplitudes of oscillations). Such evalua-tion provides for the 5-day wave a typical persistence of 4 cycles or a little bit more. For the 10-day wave, the typical persistence seems to be just 4 cycles. For the 16-day wave, the typical persistence is 3.5 cycles or slightly more. Thus, the persistence slightly decreases with increasing period, but less than that for the Meyer wavelet transform interpreted in terms of relative, not absolute amplitudes.
The pattern of the persistence in terms of the number of cy-cles and in terms of the number of days is different. In terms of tha number of cycles, the typical persistence of oscilla-tions decreases with increasing period. On the other hand, in terms of the number of days, the typical persistence evidently increases with increasing period.
oscillations infoF2 seems to be very questionable. We will probably be unable to predict them for improving the quality of the radio-wave propagation predictions.
Acknowledgements. This work has been supported by the Ministry
of Education, Youth and Sports of the Czech Republic under grant No. OC 271.10 and by the Grant Agency of the Czech Republic under grant No. 205/02/P077/A.
Topical Editor, M. Lester thanks T. Xenos and another referee for their help in evaluating this paper.
References
Altadill, D. and Apostolov, E. M.: Vertical development of the 2-day wave in the midlatitude ionospheric F-region, J. Geophys. Res., 103, 29 199–29 206, 1998.
Altadill, D. and Apostolov, E. M.: Vertical propagation signatures of wave-type oscillations (2- and 6.5-days) in the ionosphere ob-tained from electron density profiles. J. Atmos. Solar-Terr. Phys., 63, 823–834, 2001.
Altadill, D., Apostolov, E. M., Sole, J. G., and Jacobi, Ch.: Origin and development of vertical propagating oscillations with peri-ods of planetary waves in the ionospheric F-region, Phys. Chem. Earth, 26, Part C, 387–393, 2001.
Altadill, D. and Laˇstoviˇcka, J.: Quasi-five- and ten-day oscillations
infoF2 and their possible connection with oscillations at lower
ionospheric heights, Ann. Geofisica, 39, 705–712, 1996. Apostolov, E. M., Altadill, D., and Alberca, L. F.: Characteristics of
quasi-2-day oscillations in thefoF2 at northern middle latitudes, J. Geophys. Res., 100. 12 163–12 171, 1995.
Apostolov, E. M., Altadill, D., and Hanbaba, R.: Spectral energy contributions of quasi periodic oscillations (2–35 days) to the variability offoF2, Ann. Geophysicae, 16, 168–175, 1998. Beard, A. G., Mitchell, N. J., Williams, P. J. S., and Kunitake, M.:
Non-linear interactions between tides and planetary waves result-ing in periodic tidal variability, J. Atmos. Solar-Terr. Phys., 61, 363–376, 1999.
Beard, A. G., Williams, P. J. S., Mitchell, N. J., and Muller, H. G.: A spectral climatology of planetary waves and tidal variability, J. Atmos. Solar-Terr. Phys., 63, 801–811, 2001.
Bureˇsov`a, D.: Results offoF2 data testing with the UNDIV pro-gram, Studia geoph. et geod., 41, 82–87, 1997.
Canziani, P. O.: On tidal variability and the existence of planetary wave-like oscillations in the upper thermosphere I. Observations of tidal variability, J. Atmos. Terr. Phys., 56, 901–912, 1994. Daubechies, I.: Ten lectures on wavelets. CBMS, SIAM, 61, 117–
119, 1994.
Forbes, J. M. and Leveroni, S.: Quasi 16-day oscillation in the iono-sphere, Geophys. Res. Lett., 19, 981–984, 1992.
Forbes, J. M., Palo, S. E., and Zhang, X.: Variability of the iono-sphere, J. Atmos. Solar-Terr. Phys., 62, 685–693, 2000. Laˇstoviˇcka, J.: Observations of tides and planetary waves in the
atmosphere-ionosphere system, Adv. Space Res., 20, 1209– 1222, 1997.
Laˇstoviˇcka, J.: Planetary wave modulation of upward propagating tides and gravity waves as contribution to planetary wave type oscillations in the F2-region, in: Proc. 4th COST251 Workshop, (Ed) A. Vernon, 142–154, RAL, Didcot, 1989.
Laˇstoviˇcka, J.: Effects of gravity and planetary waves on the lower ionosphere as obtained from radio wave absorption measure-ments, Phys. Chem. Earth, 26, 381–386, 2001.
Laˇstoviˇcka, J., Ebel, A., and Ondr`aˇskov`a, A.: On the transforma-tion of planetary waves of tropospheric origin into waves in radio wave absorption in the lower ionosphere, Studia geoph. et geod., 38, 71–81, 1994.
Laˇstoviˇcka, J., Fiˇser, V., and Pancheva, D.: Long-term trends in planetary wave activity (2–15 days) at 80–100 km inferred from radio wave absorption, J. Atmos. Terr. Phys., 56, 893–899, 1994. Laˇstoviˇcka, J., Kriˇzan, P., and Novotn`a, D.: Persistence of planetary waves in the lower ionosphere, Studia geoph. et geod., accepted, 2002.
Laˇstoviˇcka, J. and Mlch, P.: Solar cycle effects on oscillations in the period range of 2–20 days in the F-region of the ionosphere, Ann. Geofisica, 39, 783–790, 1996.
Laˇstoviˇcka, J. and Pancheva, D.: Changes in characteristics of plan-etary waves at 80–100 km over Central and Southern Europe since 1980, Adv. Space Res., 11, 3, 31–34, 1991.
Laˇstoviˇcka, J. and ˇSauli, P: Are planetary wave type oscillations in the F2 region caused by planetary wave modulation of upward propagating tides? Adv. Space Res., 24, 1473–1476, 1999. Lindzen, R., Strauss, D., and Katz, B.: An observational study of
large-scale atmospheric Rossby waves during FGGE, J. Atmos. Sci., 41, 1320–1335, 1984.
Meyer, C. K.: Gravity wave interactions with mesospheric plane-tary waves: A mechanism for penetration into the thermosphere-ionosphere system, J. Geophys. Res., 104, 28 181–28 196, 1999. Meyer, C. K. and Forbes, J. M.: A 6.5-day westward propagating wave: Origin and Characteristics, J. Geophys. Res., 102, 26 173– 26 178, 1997.
Mitchell, N. J., Williams, P. S. J., Beard, A. G., Buesnel, G. R., and Muller, H. G.: Nonlinear planetary/tidal wave interactions in the lower thermosphere observed by meteor radar, Ann. Geophysi-cae, 14, 364–366, 1996.
Pancheva, D.: Non-linear interaction of tides and planetary waves in the mesosphere and lower thermosphere: observations over Europe, Phys. Chem. Earth, 26, 411–418, 2001.
Pancheva, D., Alberca, L. F., and de la Morena, B. A.: Simultane-ous observation of the quasi-two day variations in the lower and upper ionosphere, J. Atmos. Terr. Phys., 56, 43–50, 1994. Pancheva, D., Apostolov, E., Laˇstoviˇcka, J., and Boˇska, J.:
Long-period fluctuations of meteorological origin observed in the lower ionosphere, J. Atmos. Terr. Phys., 51, 381–388, 1989. Pancheva, D. and Laˇstoviˇcka, J.: Planetary wave activity in
the lower ionosphere during CRISTA I campaign in autumn (October–November), Ann. Geophysicae, 16, 1014–1023, 1998. Pancheva, D. and Laˇstoviˇcka, J.: Solar or meteorological control of lower ionospheric fluctuations (2–15 and 27 days) in middle latitudes, Handbook for MAP, 29, 210–214, 1989.
Torrence, C. and Compo, G. P.: A Practical Guide to Wavelet Anal-ysis, Bull. Amer. Met. Soc., 79, 61–78,1998.
Williams, C. R. and Avery, S. K.: Analysis of long-period waves using the Mesosphere-Stratosphere-Troposphere radar at Poker Flat, Alaska, J. Geophys. Res., 97, 20 855–20 861, 1992. Wu, D. L., Hays, P. B., and Skinner, W. R.: Observations of the
5-day wave in the mesosphere and lower thermosphere, Geophys. Res. Lett., 21, 2733–2736, 1994.
Yi., L. and Chen, P. R.: Evidence for the coincident long-period oscillations in the equatorial ionisation anomaly with the zonal neutral wind in the mesosphere, J. Atmos. Terr. Phys., 56, 1609– 1618, 1994.