Annales
Geophysicae
Climatological studies of the quasi 16-day oscillations in the
mesosphere and lower thermosphere at Yamagawa (31.2
◦
N,
130.6
◦
E), Japan
S. P. Namboothiri, P. Kishore, and K. Igarashi
Communications Research Laboratory, Tokyo, Japan
Received: 2 October 2001 – Revised: 15 March 2002 – Accepted: 22 March 2002
Abstract. The 16-day wave climatology at Yamagawa (31.2◦N, 130.6◦E) is investigated by analyzing the meso-sphere and lower thermomeso-sphere (MLT) wind data collected with the recently installed MF radar. We have utilized the continuous data gathered during the five-year period 1996– 2000. The wave climatology clearly shows some seasonal variations. The period of late autumn-spring is marked with larger wave activity, with the strongest waves being served in the winter months. The maximum amplitude ob-served at Yamagawa is about 20 m/s, which is comparatively larger than the amplitudes observed at mid-latitude stations. The height dependence of the 16-day wave suggests that the maximum amplitude is observed at altitudes below 80 km. The summer months are characterized with much weaker wave activity. The vertical wavelength appears to be larger in the winter months and shorter in the summer months. The present analysis again confirms that the 16-day wave is highly sensitive to the background mean winds. Eastward motion of the background winds is a more favourable con-dition for the 16-day wave penetration to the MLT heights. The wave features show some signs of interannual variabil-ity. Overall, the observed features of the 16-day wave at Ya-magawa, which is located at the edge of the subtropical lat-itudes, show some correspondence with the results reported for mid-latitude stations.
Key words. Meteorology and atmospheric dynamics (cli-matology; thermospheric dynamics)
1 Introduction
Many reports of long-period oscillations in the mesosphere and lower thermosphere (MLT) region have appeared in the scientific literature for the past 2–3 decades. It has been rec-ognized that these waves with planetary scale size contribute Correspondence to:S. P. Namboothiri
(nambooth@crl.go.jp)
significantly to the variability of atmospheric parameters in the middle atmosphere. They also play an important role in the dynamics of the MLT region and its coupling to re-gions above and below. Planetary waves with a range of wave periods have been identified, but the most commonly reported periods fall into three well-defined intervals which are 1.9 to 2.2 days, 4 to 7 days and 10 to 20 days. These are often termed as the “2-day”, “5-day” and “16-day” oscil-lations, respectively. Radar measurements of neutral winds from different locations reported these waves (Manson et al., 1981; Vincent, 1990; Williams and Avery, 1992; Meek et al., 1996; Thayaparan et al., 1997; Jacobi et al., 1998; Mitchell et al., 1999; Luo et al., 2000; Namboothiri et al., 2002; to state a few). Ozone measurements in the stratosphere and temperature measurements in the mesopause region also ob-served planetary waves of different periodicities (Rodgers and Prata, 1981; Rosenlof and Thomas, 1990; Espy et al., 1997). Simulation studies further contributed significantly in our understanding of long-period motions in the MLT re-gion (Salby, 1981a; Wu and Miyahara, 1988; Miyahara et al., 1991; Hagan et al., 1993; Forbes et al., 1995). The gen-eral presumption is that these waves originate in the tropo-sphere/stratosphere and penetrate to the MLT region. Since the 16-day wave has smaller phase speed, it will be trapped in the strong westward flow of the summer stratosphere and can only propagate into the upper heights through the winter stratospheric eastward jet.
1240 S. P. Namboothiri et al.: The 16-day oscillations in mesosphere and lower thermosphere at Yamagawa, Japan been proposed to explain the presence of the quasi 16-day
wave in the summer mesosphere. The first mechanism pro-poses that the 16-day wave is generated in the winter hemi-sphere, then propagated vertically and toward the summer pole following the westerly mean winds. Numerical simu-lations (Wu and Miyahara, 1988; Forbes et al., 1995) show evidence of this mechanism, in agreement with the wind and temperature amplitudes of the 16-day wave measured in the summer mesosphere (Williams and Avery, 1992; Espy et al., 1997). The additional mechanism that has been suggested is the oscillatory deposition of energy and momentum into the summer mesosphere due to the breaking of gravity waves whose transmission through the stratosphere has been mod-ulated by the 16-day wave in the summer troposphere and lower stratosphere (Holton, 1984; Forbes et al., 1995). Radar observations at Molodezhnaya, Antarctica further show the year-round presence of wave motions of periods of near 2 days, 3–5 days and 15–20 days near 95 km (Yu. I. Portnya-gin, Private Communication, 1986).
We present here observations of the quasi 16-day oscilla-tion in the ground-based measurements of MLT winds made from Yamagawa (31.2◦N, 130.6◦E), Japan. The data from 1996 to 2000 have been used in the present study. The anal-ysis is expected to provide more information on the climato-logical behaviour and the year-to-year variability of the 16-day wave. In the next section, a brief description of our data collection and analysis procedure is given. Results and dis-cussion are given in the subsequent section. Finally, our re-sults are summarized in Sect. 4.
2 Data and analysis
The wind data used in the present study were collected by the spaced antenna MF radar observations at Yamagawa in west-ern Japan. Continuous observations at Yamagawa started in August 1994. However, due to major interference problems, observations were not made for several months in 1994 and 1995 and hence, there are a lot of data gaps in the initial data set. So, in our analysis, we have not included those scattered data sets. Fairly continuous data are available for the period 1996–2000 and this data set is used in the present analysis. Details of the radar system configuration and tech-nical features are well described elsewhere (Igarashi et al., 1996; Kishore et al., 2000; Namboothiri et al., 2000). Briefly, the radar operates at a frequency of 1.955 MHz with a peak power of 50 kW. The soundings involve samplings at 2 km intervals from∼60 to 98 km, with a time resolution of 2 min. The height range from 60 to 98 km is covered during the day and from 70 to 98 km at night. The wind data are calculated by means of a “full correlation analysis” (FCA) algorithm of the University of Adelaide (Briggs, 1984).
It is important to consider a number of points when we concentrate on the data analysis. Since we are interested in the 16-day wave, in the present analysis we have used the daily mean winds, which enables us to smooth out variations due to short-period waves and turbulence with periods less
than a day (Luo et al., 2000). First the hourly mean winds are obtained from the 2-min samplings and are only consid-ered valid when there are at least two wind values within an hour. This will provide equal weight to data throughout the day and reduce the effect of inhomogeneous distribution on the daily average. It should be mentioned that the number of wind values per hour is much more than 2 for the alti-tudes above 70 km (more on the data rate and reliability can be seen in Namboothiri et al. 2000). To determine the daily mean winds, we have used the criterion that there should be at least 3 hourly mean wind values per day. Although we used this criterion, actually the real situation is far better. It is found that at most of the height bins, the number of hourly values is greater than 12, which can significantly reduce the tidal contamination. The number of hourly values reaches the maximum of 24 at altitudes around 80 km. Regarding the tidal contribution, Luo et al. (2002) suggest that since the tidal phases do not change significantly day by day, the vari-ability of the daily means is mainly due to planetary waves, with minimal tidal contamination. They confirmed this by comparing wind spectra using all available hours with spec-tra using an artificially restricted number (6–12) of hours. There were no significant differences for the spectral range including the 16-day wave.
We have used the Lomb-Scargle (L-S) periodogram method (Scargle, 1982) of spectral analysis for the determi-nation of the wave amplitudes. The L-S technique is equiva-lent to a pure harmonic least-squares analysis. The advantage of this method is that the input data do not have to be evenly spaced (Press et al., 1992). Compared to other methods, the L-S method weights the data on a per point basis, instead of a per time interval basis. Also, the L-S periodogram can provide an estimate of the significance of each peak by exam-ining the probability of its arising from a random fluctuation (Luo et al., 2002).
The daily mean wind data were examined and it was found that there were not many long data gaps. When the length of the data gap is small (≤5 days), the gaps are filled with linear interpolation. However, when the gap is longer (6 days and above, i.e. greater than 1/3 of the period of interest) we kept the gaps unfilled and no further analysis was done. By fill-ing the gaps, it is possible to avoid the arbitrarily large false disturbance in the gap span when applying spectral analysis methods (Luo et al., 2002).
3 Results and discussion
Fig. 1.Daily mean zonal winds at Yamagawa for the year 1997. The solid curves represent the winds for the 6 km layer centered at 62, 68, 74, 80, 86, and 90 kms. The dotted curves denote the band-pass filtered 16-day oscillations. Data were segmented to 1–120, 121–240, and 241–365 days of the year. For detrending, the daily mean winds, a polynomial fitting of the order of 2 was applied and the fitted values are shown by dashed curves.
Ja
n-9
6
Ja
n
-9
7
Ja
n-9
8
Ja
n
-9
9
Ja
n-0
0
Ja
n
-0
1
-10 -5 0 5 10 -10 -5 0 5 10
A
m
plitude (
m
/s
)
-10 -5 0 5 10 -10 -5 0 5
10 Yamagawa 1996-2000 Zonal and Meridional 16-d wave (BP filter: order:48 days, bp:13-20d)
Meridional Zonal
68-74 km 76-82 km 84-90 km 92-98 km
Year
Fig. 2. The band-pass filtered 16-day oscillations at four altitude layers at Yamagawa during 1996–2000. The solid and dashed curves represent the zonal and meridional components, respectively.
the output is multiplied by the filter function. Finally, an in-verse Fourier transform is performed to get back the filtered data set in the time domain. Before applying the filter, it is important to detrend all the data by a polynomial fitting of the order of 2. This will reduce the effect of very long-term trends (Espy et al., 1997; Luo et al., 2000). The data are fur-ther modulated by a Hanning window before spectral analy-sis, to reduce the effect of spectral leakage and to suppress the side-lobe effects. In Fig. 1, the dashed lines represent the
1242 S. P. Namboothiri et al.: The 16-day oscillations in mesosphere and lower thermosphere at Yamagawa, Japan
1996 1997 1998 1999 2000 5
10 15 20
Peri
od
(
d
ay
s
)
A
m
pl
it
ude (
m
/
s
)
Year 5
10 15 20
Pe
ri
od
(
d
ay
s
)
A
m
pl
it
ude (m/s
)
1996 1997 1998 1999 2000
1 3 5 7 9 11 Yamagawa Zonal Average: 70-80 km
Yamagawa Meridional Average: 70-80 km
> 11 < 21
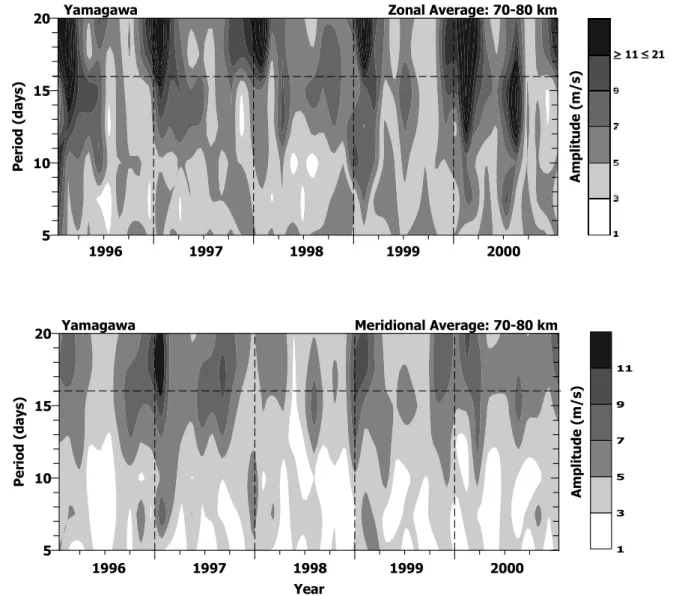
Fig. 3.Averaged (70–80 km) Lomb-Scargle periodograms (5–20 days) of the Yamagawa zonal and meridional daily mean winds during the period 1996–2000.
In Fig. 2, we illustrate the 16-day band-pass filtered zonal and meridional wind components for the period 1996–2000 at Yamagawa. Here, we show the results for 4 height layers of 8 km in thickness. The filtered values of zonal (solid curve) and meridional (dashed curve) wind compo-nents show some distinct features. In the majority of the height layers and the years shown, the zonal component gen-erally shows larger amplitudes than the meridional compo-nent. One should remember that the filtered amplitude may be suppressed due to the transition band effect around the cutoff frequencies. There is a tendency to have larger ampli-tudes in the lower altiampli-tudes. There is evidence of some burst type wave occurrence. Similar wave occurrences with com-paratively bigger amplitudes for the zonal component were reported for Saskatoon and London (Luo et al., 2002), and they also observed larger amplitudes at lower altitudes. It is generally observed that the wave activity is stronger dur-ing the fall-sprdur-ing period. In most of the years, the wave attains its maximum amplitude in the winter season. There
is also some indication of reasonable wave amplitude during the summer season of some years. For example, during sum-mer of 1999 and 2000, the wave amplitudes show more than 5 m/s. The phase relationship between the two components is not well understood from this figure.
60 70 80 90
Altit
u
de
(k
m)
Amplit
u
d
e (
m
/s)
5 7 9 11 13 15 17
60 70 80 90
Al
ti
tud
e
(
k
m)
1996 1997 1998 1999 2000
Year
Yamagawa
Fig. 4.Climatological presentation of the zonal 16-day waves (color scale) at Yamagawa during 1996–2000. The background wind is also shown in solid (eastward) and dashed (westward) contours.
(1999) selected a similar window and suggested that the 48-day window length is a best compromise between spectral resolution and response to changes in the composition of the field of low-frequency motions. The 16-day wave is shown with a dashed horizontal line. In the process, we have es-timated the confidence levels of the periodograms and only considered those spectral peaks with more than a 90% sig-nificance. The annual pattern shown in the figure demon-strates a larger presence of oscillations with a period from 10 to 20 days. It seems there are some significant oscillations with periods longer than 20 days in both components. The figure indicates that the behaviour of the oscillation in the zonal and meridional components is dissimilar. The wave activity is more pronounced in the zonal component than the meridional component. In the majority of the years, the zonal component clearly demonstrates larger amplitudes for oscil-lations with a period of more than 15 days. The maximum amplitude is found to be almost twice that of the meridional component. The winter season is marked with stronger wave activity. A somewhat dominant oscillation with a period of 10–15 days is seen in the zonal component of summer 2000. Figure 4 presents the climatology of the zonal 16-day waves in the MLT region over Yamagawa for the period 1996–2000. Using the periodogram analysis, we have es-timated the amplitudes of the 16-day wave in the height re-gion 60–98 km and those amplitudes are used to produce the height-time structure. The color contours represent the 16-day wave amplitudes. The background winds (zonal) are also shown in line contours. The solid (dashed) contours repre-sent the eastward (westward) winds. The mean zonal wind is characterized by a clear annual variation at altitudes below 82 km. Examination of the 16-day wave reveals consistent characteristics of the wave. Climatological structure indi-cates that at altitudes below 70 km, the wave activity has a
prolonged duration from the fall to the spring season. Above 70 km it is found that winter months are featured with larger wave activity. The observed maximum amplitude is 19 m/s. The summer 16-day wave is comparatively weaker and it is not as consistent as the winter conditions. The observed max-imum amplitude is between 9–13 m/s and is generally found above ∼80 km. Of the 5 years of data presented here, the strongest 16-day wave activity is found during the 1996 win-ter. There is little indication of interannual variability of the 16-day wave amplitude. However, it is noteworthy that the height-time structure demonstrates some differences in their year-to-year pattern. It seems that the wave amplitude maxi-mizes near the heights where the eastward winds maximize.
1244 S. P. Namboothiri et al.: The 16-day oscillations in mesosphere and lower thermosphere at Yamagawa, Japan
0 10 20
Amplitude (m/s)
60 70 80 90 100
A
ltitu
d
e
(km)
-50-25 0 25 50 Mean wind (m/s)
0 180 360
Phase (deg)
0 10 20 -50-25 0 25 50
0 180 360 0 10 20 -50-25 0 25 50
0 180 360 0 10 20 -50-25 0 25 50
0 180 360 0 10 20 -50-25 0 25 50
0 180 360 0 10 20 -50-25 0 25 50
0 180 360
0 10 20
Amplitude (m/s)
60 70 80 90 100
Alt
itu
de
(
k
m
)
-50-25 0 25 50 Mean wind (m/s)
0 180 360
Phase (deg)
0 10 20 -50-25 0 25 50
0 180 3600 10 20
-50-25 0 25 50
0 180 360 0 10 20 -50-25 0 25 50
0 180 360 0 10 20 -50-25 0 25 50
0 180 360 0 10 20 -50-25 0 25 50
0 180 360
Jan'97 Feb'97 Mar'97 Apr'97 May'97 Jun'97
Jul'97 Aug'97 Sep'97 Oct'97 Nov'97 Dec'97
Fig. 5.Height profiles of the monthly amplitudes (solid circle) and phases (open circle) of the 16-day waves at Yamagawa in 1997. The thick solid lines represent the monthly mean zonal winds.
such double maximum of the wave amplitude. The summer months are marked with comparatively smaller amplitudes; the maximum amplitude is mainly in the range of 10–15 m/s. Below 80 km, the amplitude decreases with altitude. It is interesting to note that the minimum amplitude during the summer months occurs at an altitude near the reversal (from westward to eastward) of the zonal wind, and then the am-plitude generally increases with the increased eastward wind flow. This clearly documents the sensitivity of the 16-day wave to the background wind condition.
The phase profiles (denoted with open circles) basically show regular variations in most months. In December, it has a complicated structure. The vertical wavelength of the wave appears to be greater in the winter months than that in the summer months.
Figure 6 shows the annual climatology of the 16-day wave in the MLT at Yamagawa. Here, we show the mean pic-ture of the 16-day wave amplitude (zonal) for the five-year period. The mean climatology has been developed by av-eraging all annual plots shown in Fig. 4. Annual clima-tology of the mean zonal wind for the same period is also shown in solid and dashed contours. The 16-day wave cli-matology presented in color contours basically illustrates the features that are seen in the yearly structure (Fig. 4). It is well indicated that the 16-day wave is dominant when the background winds are eastward. The maximum amplitude of nearly 20 m/s is observed in February at 69–74 km. However, there is also some evidence of comparatively weaker 16-day
wave amplitudes (maximum of 12 m/s) during the summer months.
Using five years of MLT wind data from Yamagawa, the 16-day wave climatology has been studied and compared with the observations at other sites. The present analysis basically reveals similar features that are reported for some midlatitude stations. However, we have observed some dif-ferences as well. It is seen that the amplitude of the 16-day wave observed at Yamagawa is comparatively larger than the amplitudes observed at mid-latitude stations, such as Saska-toon, Collm or Sheffield (Jacobi et al., 1998; Mitchell et al., 1999; Luo et al., 2000). In a detailed study for Saska-toon, Luo et al. (2000) reported maximum amplitudes of only 12 m/s. Similarly, LF drift measurements from Collm and meteor radar measurements from Sheffield also reported maximum amplitudes of 15 and 14 m/s, respectively. How-ever, earlier measurements at Sheffield show amplitudes of 10–20 m/s (Kingsley et al., 1978). The Yamagawa data also show some signs of interannual variability of the 16-day wave. Although the maximum amplitude observed every year is roughly around 20 m/s, the height structure of the amplitude shows some year-to-year variations. There were some other reports of interannual variability of the 16-day wave. Espy et al. (1997) found interannual variability of the 16-day wave in polar mesospheric summer temperatures. The 16-day wave characteristics reported from Saskatoon and London also revealed some year-to-year variability.
60 65 70 75 80 85 90 95
A
lti
tu
de
(
k
m
)
2 4 6 8 10 12 14 16 18
2 4 6 8 10 12 Yamagawa (1996 - 2000)
Month 60
65 70 75 80 85 90 95
Am
pl
itude
(
m
/
s
)
Fig. 6. Average climatology of the 16-day wave amplitudes (color scale) at Yamagawa for the five-year period 1996–2000. The solid (eastward winds) and dashed contours (westward winds) represent the mean zonal winds for the same period.
is also consistent with the pattern seen at mid-latitude sites. In summer the observed amplitude at Yamagawa is gener-ally smaller. The waves genergener-ally cannot propagate into the mesopause region when the summer zonal wind flow is west-ward. However, as noted in the Introduction, there is also evidence for larger wave activity during the summer season. Espy et al. (1997) observed a 16-day wave in the summer mesopause region at the polar region and interpreted it as the propagation of the wave from the winter to summer hemi-sphere, which is modulated by the QBO phase. Earlier, VHF radar measurements from Poker Flat also indicated summer time maximum for the 16-day wave amplitude (Williams and Avery, 1992). They propose that ducting from the win-ter to summer hemisphere can be a good reason for such behaviour. Simulation studies by Miyoshi (1999) demon-strated weaker 16-day wave activity in the stratosphere and mesosphere of the summer hemisphere. However, near the mesopause region, the amplitude increases with height, and the 16-day wave demonstrates a global structure. He fur-ther showed that the penetration of the 16-day wave from the winter hemisphere into the summer hemisphere occurs near the mesopause region. In another study, Forbes et al. (1995) suggested that the 16-day wave penetration into the summer hemisphere is sensitive to the zonal background winds, and they found no significant penetration of the 16-day oscilla-tion above about 100 km.
4 Conclusion
In the present study, the planetary wave (mainly quasi 16-day wave) in the MLT over Yamagawa has been investigated by analyzing the MF radar wind data. The analysis focused on the climatological aspects of the wave and compared then with the recent results reported for mid-latitude stations. Ba-sically the results of the present analysis support the theory and models that predicted that the 16-day wave vertical prop-agation is dominant when the zonal background wind is east-ward. The Yamagawa data revealed the dominance of the 16-day wave in the zonal wind component. Analysis of the multi-year data indicates that the wave amplitude attains its maximum value during the winter months. At Yamagawa, the maximum amplitude observed is about 20 m/s. This value is comparatively larger than the values observed at a num-ber of mid-latitude sites. The interannual variability in the strength of the wave amplitude is less evident in the Yama-gawa data. However, the vertical structure of the wave ampli-tude shows some signs of variability. The wave occurrence in the summer months is less intense; the observed ampli-tude is mostly around 12 m/s. The study well establishes the sensitivity of the 16-day wave to the background zonal wind variations.
struc-1246 S. P. Namboothiri et al.: The 16-day oscillations in mesosphere and lower thermosphere at Yamagawa, Japan ture and propagation, QBO modulation, hemispheric
differ-ences, etc. Extensive information and clarifications on such features can be derived only through collective efforts by us-ing the data from a number of stations located at a wider longitudinal/latitudinal separation. Another study on extra long-period oscillations in the MLT winds over Yamagawa is in progress and we hope to derive information on the solar-geomagnetic influences on the planetary waves in the MLT region.
Acknowledgements. Our colleagues at the Yamagawa observatory deserve special thanks for the operation and maintenance of the MF radar system. The second author (P. K.) acknowledges the financial support from the Telecommunications Advancement Organization (TAO) of Japan.
Topical Editor D. Murtagh thanks Ch. Jacobi and another referee for their help in evaluating this paper.
References
Briggs, B. H.: The analysis of spaced sensor records by correlation technique, MAP Handb., 13, 166–184, 1984.
Espy, P. J., Stegman, J., and Witt, G.: Interannual variations of the quasi-16-day oscillation in the polar summer mesospheric tem-perature, J. Geophys. Res., 102, 1983–1990, 1997.
Forbes, J. M., Hagan, M. E., Miyahara, S., Vial, F., Manson, A. H., Meek, C. E., and Portnyagin, Y. I.: Quasi 16-day oscillation in the mesosphere and lower thermosphere, J. Geophys. Res., 100, 9149–9163, 1995.
Hagan, M. E., Forbes, J. M., and Vial, F.: Numerical investigation of the propagation of the quasi-two-day wave into the lower ther-mosphere, J. Geophys. Res., 98, 23 193–23 205, 1993.
Holton, J. R.: The generation of mesospheric planetary waves by zonally asymmetric gravity wave breaking, J. Atmos. Sci., 41, 3427–3430, 1984.
Igarashi, K., Nishimuta, Y., Murayama, Y., Tsuda, T., Nakamura, T., and Tsutsumi, M.: Comparison of wind measurements be-tween the Yamagawa MF radar and the MU radar, Geophys. Res. Lett., 23, 3341–3344, 1996.
Jacobi, C., Schminder, R., and Kuerschner, D.: Planetary wave activity obtained from long-period (2–18 days) variations of mesopause region winds over Central Europe (52◦N, 15◦E), J. Atmos. Solar-Terr. Phys., 60, 81–93, 1998.
Kingsley, S. P., Muller, H. G., Nelson, L., and Scholefield, A.: Me-teor winds over Sheffield, J. Atmos. Terr. Phys., 40, 917–922, 1978.
Kishore, P., Namboothiri, S. P., and Igarashi, K.: Study of meso-sphere lower thermomeso-sphere (MLT) mean winds over Yamagawa (31.2◦N, 130.6◦E) during 1996–1998, J. Geophys. Res., 105, 24 863–24 870, 2000.
Luo, Y., Manson, A. H., Meek, C. E., Meyer, C. K., and Forbes, J. M.: The quasi 16-day oscillations in the mesosphere and lower thermosphere at Saskatoon (52◦N, 107◦W), J. Geophys. Res., 105, 2125–2138, 2000.
Luo, Y., Manson, A., Meek, C., Thayaparan, T., MacDougall, J., and Hocking, W.: The 16-day wave in the mesosphere and lower thermosphere: simultaneous observations at Saskatoon (52◦N, 107◦W) and London (43◦N, 81◦W), Canada, J. Atmos. Solar-Terr. Phys. (in press), 2002.
Manson, A. H. and Meek, C. E.: Dynamics of the middle
atmo-sphere at Saskatoon (52 N, 107 W): A spectral study during 1981, 1982, J. Atmos. Terr. Phys., 48, 1039–1055, 1986.
Manson, A. H., Gregory, J. B., and Meek, C. E.: Atmospheric waves (10 min–30 days) in the mesosphere and lower thermo-sphere at Saskatoon (52◦N, 107◦W) October 1978–September 1979, Planet. Space Sci., 29, 615–625, 1981.
Meek, C. E., Manson, A. H., Franke, S. J., Singer, W., Hoffmann, P., Clark, R. R., Tsuda, T., Nakamura, T., Tsutsumi, M., Ha-gan, M., Fritts, D. C., Isler, J., Portnyagin, Y. I.: Global study of northern hemisphere quasi-2-day wave events in recent summers near 90 km altitude, J. Atmos. Solar-Terr. Phys., 58, 1401–1411, 1996.
Mitchell, N. J., Middleton, H. R., Beard, A. G., Williams, P. J. S., and Muller, H. G.: The 16-day planetary wave in the meso-sphere and lower thermomeso-sphere, Ann. Geophysicae, 17, 1447– 1456, 1999.
Miyahara, S., Portnyagin, Y. I., Forbes, J. M., and Solovjeva, T. V.: Mean zonal acceleration and heating of the 70- to 100-km region, J. Geophys. Res., 96, 1225–1238, 1991.
Miyoshi, Y.: Numerical simulation of the 5-day and 16-day waves in the mesopause region, Earth Planets Space, 51, 763–772, 1999.
Namboothiri, S. P., Kishore, P., Igarashi, K., Nakamura, T., and Tsuda, T.: MF radar observations of mean winds over Yamagawa (31.2◦N, 130.6◦E) and Wakkanai (45.4◦N, 141.7◦E), J. Atmos. Solar-Terr. Phys., 62, 1177–1187, 2000.
Namboothiri, S. P., Kishore, P., and Igarashi, K.: Observations of the quasi-two-day wave in the mesosphere and lower ther-mosphere over Yamagawa and Wakkanai, J. Geophys. Res. (in press), 2002.
Press, W. H., Teukolsky, S. A., Vetterling, W. T., and Flannery, B. P.: Numerical Recipes in C, Cambridge Univ. Press, New York, 1992.
Rodgers, C. D. and Prata, A.: Evidence for a traveling 2-day wave in the middle atmosphere, J. Geophys. Res., 86, 9661–9664, 1981. Rosenlof, K. H. and Thomas, R. J.: Five-day mesospheric waves observed in Solar Mesosphere Explorer ozone, J. Geophys. Res., 95, 895–900, 1990.
Salby, M. L.: Rossby normal modes in nonuniform background configurations, Part I, Simple fields, J. Atmos. Sci., 38, 1803– 1826, 1981a.
Salby, M. L.: Rossby normal modes in nonunoform background configurations, Part II, Equinox and solstice conditions, J. At-mos. Sci., 38, 1827–1840, 1981b.
Scargle, J. D.: Studies in astronomical time series analysis. II, Sta-tistical aspects of spectral analysis of unevenly spaced data, As-trophys. J., 263, 835–853, 1982.
Thayaparan, T., Hocking, W. K., MacDougall, J. W.: Amplitude, phase, and period variations of the quasi-2-day wave in the meso-sphere and lower thermomeso-sphere over London, Canada (43◦N, 83◦W) during 1993 and 1994, J. Geophys. Res., 102, 9461– 9478, 1997.
Vincent, R. A.: Planetary and gravity waves in the mesosphere and lower thermosphere, Adv. Space Res., 10, 93–101, 1990. Williams, C. R. and Avery, S. K.: Analysis of long-period waves
us-ing the mesosphere-stratosphere-troposphere radar at Poker Flat, Alaska, J. Geophys. Res., 97, 20 855–20 861, 1992.