www.ocean-sci.net/11/921/2015/ doi:10.5194/os-11-921-2015
© Author(s) 2015. CC Attribution 3.0 License.
Evaluating the surface circulation in the Ebro delta (northeastern
Spain) with quality-controlled high-frequency radar measurements
P. Lorente1, S. Piedracoba2, J. Soto-Navarro1, and E. Alvarez-Fanjul1 1Puertos del Estado, Avenida del Partenón 10, 28042, Madrid, Spain 2University of Vigo, Marcosende s/n, 36310, Vigo, Pontevedra, Spain
Correspondence to:P. Lorente ([email protected])
Received: 16 July 2015 – Published in Ocean Sci. Discuss.: 24 August 2015
Revised: 28 October 2015 – Accepted: 12 November 2015 – Published: 26 November 2015
Abstract.The Ebro River delta is a relevant marine protected area in the western Mediterranean. In order to promote the conservation of its ecosystem and support operational deci-sion making in this sensitive area, a three-site standard-range (13.5 MHz) CODAR SeaSonde high-frequency (HF) radar was deployed in December 2013. The main goal of this work is to explore basic features of the sea surface circulation in the Ebro deltaic region as derived from reliable HF radar sur-face current measurements. For this aim, a combined qual-ity control methodology was applied: firstly, 1-year long (2014) real-time web monitoring of nonvelocity-based diag-nostic parameters was conducted to infer both radar site sta-tus and HF radar system performance. The signal-to-noise ratio at the monopole exhibited a consistent monthly evolu-tion, although some abrupt decreases (below 10 dB), occa-sionally detected in June for one of the radar sites, impacted negatively on the spatiotemporal coverage of total current vectors. It seemed to be sporadic episodes since radar site overall performance was found to be robust during 2014. Secondly, a validation of HF radar data with independent in situ observations from a moored current meter was at-tempted for May–October 2014. The accuracy assessment of radial and total vectors revealed a consistently high agree-ment. The directional accuracy of the HF radar was rated at better than 8◦. The correlation coefficient and root mean square error (RMSE) values emerged in the ranges [0.58– 0.83] and [4.02–18.31] cm s−1, respectively. The analysis of the monthly averaged current maps for 2014 showed that the HF radar properly represented basic oceanographic features previously reported, namely, the predominant southwestward flow, the coastal clockwise eddy confined south of the Ebro delta mouth, or the Ebro River impulsive-type freshwater
dis-charge. The EOF analysis related the flow response to lo-cal wind forcing and confirmed that the surface current field evolved in space and time according to three significantly dominant modes of variability.
1 Introduction
The circulation in the Ebro continental margin (northeast-ern Spain, Fig. 1a) is mainly thermohaline and characterized by a quasi-permanent barotropic shelf-slope jet, which flows southwestwards and is named the North Current, only altered by clockwise inertial oscillations and some short periods of current reversals. This relatively low-intensity current flow (10 cm s−1)is in geostrophic balance with the so-called Cata-lan front, which is a permanent density front associated with strong salinity gradients maintained by the Ebro River runoff (Font et al., 1988a).
The marine circulation near the delta, although dominated by the alongshore large-scale dynamics, presents a complex structure strongly influenced by the topography, the season-ality of the remarkable Ebro River discharges (Font et al., 1988b), the changing wind conditions and the water column thermal stratification (Salat et al., 2002). Nonetheless, the tidal influence in the continental shelf currents field is very weak, as expected for a microtidal and low-energy environ-ment (Jimenez et al., 2002).
do-Figure 1. (a)HF coastal radar network currently operated by
Puer-tos del Estado;(b)HF radar deployed at the Ebro delta, composed of
three sites: Salou (SALO), Alfacada (ALFA) and Vinaroz (VINA). Colored dots denote the temporal coverage in percent of HF radar surface current total vectors for the entire year of 2014. Isobath depths are labeled every 200 m. The location of the Tarragona buoy (B1) is marked with filled blue squares. HFR1 denotes the radar grid point closest to the B1 position.(c)Timelines of HF radar sites
(red) and B1 buoy (blue) current data availability for 2014.
main awareness and operational decision making in this sen-sitive area, a network of 13.5 MHz CODAR SeaSonde high-frequency (HF) radar systems has been deployed (Fig. 1b). HF radar has been steadily gaining recognition as an efficient land-based remote sensing instrument for mapping surface currents at high spatial and temporal resolutions in near real time. This technology presents a broad range of practical ap-plications, encompassing management (SAR operations, oil spill emergencies), commercial (vessel tracking, ocean en-ergy production) and research (ecology, water quality, fish-eries) uses. Other emerging uses include the validation of operational ocean forecasting systems or assimilation into numerical coastal circulation models (Marmain et al., 2014; Stanev et al., 2015).
As a consequence, there is a growing demand for quality-controlled HF radar surface current measurements. Since HF radar estimations are subject to many potential uncertainties (namely, power-line disturbances, radio frequency interfer-ences, ionosphere clutter, ship echoes, antenna pattern distor-tions or environmental noise – see Kohut and Glenn, 2003), many efforts have been recently devoted to identifying occa-sional non-realistic radar current vectors. Such artifacts (de-fined as spikes, spurious values or corrupted data) are gen-erally detected at the outer edges of the radar domain and flagged in accordance with a pre-defined protocol. An indi-vidual quality control (QC) index, based on an integer num-ber derived from a battery of tests, should be assigned for
each and every single radar grid cell to indicate the quality level of each measured value (Gomez et al., 2015).
The artifacts can be subsequently eliminated from the data stream in real time (Cosoli et al., 2012b) or offline (Liu et al., 2014). Other approaches are focused, in addition, on replac-ing noisy values with more reliable estimates (Wyatt et al., 2015) by using open-boundary model analysis (Kaplan and Lekien, 2007) or statistical mapping (Barrick et al., 2012). However, the main drawback lies with the potential removal of accurate data when the discriminating algorithm is based on tight thresholds. Some fine-tuning, based on the specific local conditions of the system, is thus required to have the right tradeoff between confirmed outlier identification and false alarm rate, maximizing the benefit of the applications of these methods (Gomez et al., 2014).
Whereas some quality indexes are assigned according to velocity-based QC schemes, other approaches intend to use nonvelocity-based metrics related to the characteristics of the received signal in order to implement advanced quality con-trols and reduce the systematic errors in radar current esti-mates (Kirincich et al., 2012). One of the radial metrics that offers the most potential benefits as a reliability indicator is the signal-to-noise ratio of sea echo at the monopole (SNR3), since it has been previously proven to be a valid proxy for both radar site status and onset of HF radar system malfunc-tion (Cosoli et al., 2012b; Roarty et al., 2012). Complemen-tarily, a big jump in the average state over time in antenna parameters (e.g., amplitude corrections for loops 1 and 2 to the monopole, AMP1 and AMP2, respectively) may indicate an antenna problem and should be investigated (COS, 2005). In this context, a number of previous works have focused on defining optimum threshold levels since there is still no worldwide consensus. Atwater and Heron (2011) showed that a simple thresholding of SNR3 is a good starting point, although a 20 dB limit constitutes too severe a QC criterion, with a resulting detrimental impact on coverage area. Values of SNR3 below 10 dB have been proved to be closely linked to a significant decrease in the Multiple Signal Characteri-zation (MUSIC) direction-finding algorithm skill (De Paolo and Terril, 2007). As MUSIC is employed to resolve ocean surface current structure (Schmidt, 1986), limitations in its performance are related to potentially suspect velocity out-puts. Furthermore, different combinations of dynamic thresh-olds cutoffs have been analyzed to quantify the potential for error reduction (De Paolo et al., 2015). Since the question still remains open, further studies are currently underway to shed light on it.
HF coastal radar network operated by Puertos del Estado (Fig. 1a) – PdE hereinafter – in order to quantify and lower uncertainties in radar current measurements (Alfonso et al., 2006; Lorente et al., 2014, 2015a and b).
Correlation coefficients (CORR) and root mean squared error (RMSE) have been previously found to be in the ranges [0.32–0.92] and [6–30 cm s−1], respectively (Kohut and Glenn, 2003; Paduan et al., 2006; Chapman and Graber, 1997). Relative HF radar velocity errors can vary dramati-cally with the radar transmission frequency, sensor type and location within the sampled domain, as well as the data pro-cessing scheme used (Rypina et al., 2014; Kirincich et al., 2012). In this framework, the instrumental noise and sub-grid-scale current variability have been reported to yield noise levels of 4–6 cm s−1(Emery et al., 2004; Ohlmann et al., 2007; De Paolo et al., 2015).
The main goal of this work is to explore basic features of the sea surface circulation in the Ebro River delta as derived from reliable and accurate HF radar surface current measure-ments. For this aim, a combined QC methodology is first ap-plied: 1-year long real-time web monitoring of nonvelocity-based diagnostic parameters and offline validation of HF radar-derived current data with in situ observations from a PCM installed in a buoy moored within the radar domain (B1, Fig. 1b). This integrated approach is used during 2014 in order to infer both radar site status and HF radar system over-all performance and also to provide upper bounds on both ra-dial and total radar current measurement accuracy (Lorente et al., 2015c). Once HF radar data quality is estimated, Ebro delta HF radar capabilities in reproducing well-known cir-culation features are investigated through the exploration of monthly averaged flow patterns and dominant modes of vari-ability both in time and space (Cosoli et al., 2012a and 2013; Kovaˇcevi´c et al., 2004). Lastly, the relative contribution of local wind as a forcing mechanism is evaluated.
This paper is organized as follows: Sects. 2 and 3 out-line the specific instrumentation and methods used in this study, respectively, followed in Sect. 4 by a detailed discus-sion of the results. Finally, main concludiscus-sions are summarized in Sect. 5.
2 Instrumentation 2.1 HF radar
A CODAR SeaSonde standard-range HF radar system was deployed at the Ebro delta in December 2013 within the framework of the RIADE (Redes de Indicadores Ambien-tales del Delta del Ebro) project. The HF radar network con-sists of an array of three remote shore-based sites: Salou, Vinaroz and Alfacada. They will hereafter be referred to by their four letter site codes: SALO, VINA and ALFA, respec-tively (Fig. 1b).
The HF radar technology, founded on the principle of Bragg scattering of the electromagnetic radiation over a rough sea (Crombie, 1955), infers the radial current com-ponent from the Doppler shift of radio waves backscattered by surface gravity waves of half their electromagnetic wave-length. Each single radar site is configured to estimate ra-dial currents moving toward or away from the receive an-tenna. Since the speed of the wave is easily derived from linear wave theory, the velocity of the underlying ocean sur-face currents can be computed by subtraction. The distance to the backscattered signal is determined by range-gating the returns and the angle of origin is inferred, in the case of CO-DAR SeaSonde radars, by a direction-finding process (Bar-rick and Lipa, 1986) using three collocated receive antennas (two orthogonal crossed loops and a single monopole) and the MUSIC algorithm (Schmidt, 1986).
Each site is operating at a nominal frequency of 13.5 MHz with a 90 KHz bandwidth, providing hourly radial measure-ments with a cut-off filter of 100 cm s−1and representative of current velocities in the upper first meter of the water column. Only calibrated (measured) antenna beam patterns (hereinafter APMs) were employed by the software supplied by the manufacturer to process radial data used in the present study, with the aim of maximizing HF radar usefulness for operational applications (Lipa et al., 2006; Kohut and Glenn, 2003). In regions of overlapping coverage from two or more sites, radial current measurements are geometrically com-bined using a least-squares fit technique (Barrick and Lipa, 1986) with the averaging radius set to 6 km in order to es-timate hourly averaged total current vectors on a predefined Cartesian regular grid with 3×3 km horizontal resolution. The maximum horizontal range is set to 80 km and the angu-lar resolution is 5◦.
HF radar-derived data used in this study were collected from 1 January to 31 December 2014 (Fig. 1c). During this period the three sites were simultaneously operational and radar coverage was as its maximum extent. Temporal data coverage was quantified by computing the percent of total possible vector returns at each radar grid point (Fig. 1b). Per-cent coverage decreases rapidly near the outer edges of the domain where error levels are higher due to poor intersecting beam geometry (Chapman and Graber, 1997) and quantified by larger geometric dilution of precision (GDOP, Chapman et al., 1997). GDOP is a unit-less coefficient of uncertainty that characterizes how radar geometry may impact on mea-surement accuracy and position determination errors, owing to the angle at which the radials intersect and also to uncer-tainties in the radial vectors geometrically combined (Lev-anon, 2000; Trujillo et al., 2004).
study. The selected coverage areas present associated GDOP values of 1.5 or less.
2.2 Buoy B1
The domain of the Ebro delta HF radar array includes an ocean Seawatch buoy deployed since August 2004 in the eastern waters of the Iberian Peninsula: Tarragona buoy (40.68◦N, 1.47◦E, 688 m depth), hereafter referred to as B1 (Fig. 1b). This buoy is equipped with an acoustic point-wise current meter manufactured by Falmouth Scientific Inc., pro-viding quality-controlled hourly averaged current velocity vectors at a nominal depth of 3 m. A wind speed and direction sensor manufactured by R. M. Young Company measures hourly wind data at a nominal height of 3 m. It should be noted that current and wind records are only available from 1 May to 31 October 2014 (Fig. 1c). B1 suffered from brief communication outages during this period and subsequent short gaps (2–3 h) in data time series have been linearly in-terpolated.
3 Methods
3.1 Online quality control of HF radar measurements In order to ensure the reliability of the HF radar products delivered, maintenance and quality control (QC) procedures must be performed at various stages on the data generation pipeline. The manufacturer software package integrates a set of QC routines and thresholding techniques in the data pro-cessing chain (e.g., limits for maximum vector magnitude and maximum GDOP).
This section presents a simplistic approach based on ad-ditional data quality checks at the post-processing stage and devoted to examining a variety of nonvelocity-based diag-nostic parameters provided by the manufacturer (CODAR Ocean Sensors, COS) and listed in Table 1. Such indicators include hardware, antenna, radial and total parameters, em-ployed here as diagnostic tools for evaluating HF radar in-tegrity and health (Roarty et al., 2012; Emery and Washburn, 2007). A dedicated online website has been developed to op-erationally monitor in real time radar site status since anoma-lous values, inconsistencies or sharp fluctuations in the indi-cators might be related to potential malfunctions. This au-tomated quality control web tool runs in background with a cron job, being updated on an hourly basis.
One-year long (2014) real-time monitoring has been per-formed in order to inspect the temporal evolution and consis-tency of the aforementioned parameters, obtain estimates of their standard ranges and evaluate Ebro delta radar site per-formance according to them (Lorente et al., 2015a). Abrupt or gradual degradation and failures can be easily detected, triggering alerts for troubleshooting when defined thresholds (initially set to 2 standard deviations above/below the mean) are persistently exceeded. Particular emphasis has been de-voted to SNR3 and the number of radial vectors provided.
Finally, automated quality checks have been implemented at the second level within the hierarchy defined for QC proce-dures, referred to as total vectors. Temporal and spatial cov-erages of the Ebro delta radar system are separately analyzed on a monthly basis and later compared to each other to check whether HF radar systems operate within tolerance ranges, fulfilling the recommended level of data provision: 80 % of the spatial region over 80 % of the time (Roarty et al., 2012).
3.2 HF radar validation
Since the Ebro delta HF radar footprint overlooks a moored PCM within its spatial coverage, an accuracy assessment of radar surface currents is performed for a 6-month period May–October 2014 of concurrent radar–PCM measurements (Fig. 1c). The present section builds on previous investiga-tions devoted to the determination of measurement errors, the evaluation of direction-finding capabilities and the angu-lar distribution of radial velocity uncertainties (Emery et al., 2004; Paduan et al., 2006; Cosoli et al., 2010; De Paolo and Terrill, 2007).
For this aim, the radar radial arc geographically closest to the B1 buoy location has been selected for each HF radar site and radial current vectors estimated at each arc point have been compared with the radial projection of PCM velocities. The B1–HF radar comparative analysis allows the compu-tation of statistical parameters (e.g., CORR and RMSE) as a function of the angle comprised between B1 and the arc grid point position. In the absence of direction-finding errors (DF), maximum CORR and minimum RMSE values should be found over the arc point closest to the B1 location. In the presence of DF, the bearing offset is thus expressed as the angular difference between the arc point with maximum cor-relation and the buoy location.
Radial current time series have been filtered to remove all tidal, diurnal and inertial fluctuations (the inertial period is 18.4 h at the B1 location latitude) from the velocity data. Fil-tered time series, obtained after applying a tenth-order dig-ital low-pass Butterworth filter with a cut-off period of 30 h (Emery and Thomson, 2001), have been compared to evalu-ate the discrepancies in subinertial currents.
Complementarily, HF radar total vector hourly estimations at the grid point closest to the B1 location (HFR1; 1.48◦E 40.69◦N, Fig. 1b) have been compared with PCM velocities to provide upper bounds on the radar current measurement accuracy. Comparisons have been undertaken using zonal (U) and meridional (V) components in order to evaluate the
Table 1.Diagnosed parameters used to operationally monitor Ebro delta HF radar status in real time. The HF radar system’s performance is routinely evaluated through the analysis of the indicators listed below at different frequencies (daily/weekly/monthly).
Site status
Type Parameter Description
Receiver MTMP, RTMP Chassis and board temperatures.
Transmitter XPHT, XAHT Chassis and amplifier temperatures.
Transmitter XAFW, XARW Forward and reflected powers.
Antenna SNR1, SNR2, SNR3
Signal-to-noise ratio at loop 1, loop 2 and the monopole.
Antenna AMP1, AMP2 Calculated amplitude corrections for loops 1 and 2 to the monopole.
Radial Number radi-als/u.t., range and bearing
Abrupt decrease can be related to a potential malfunction.
System status
Parameter Description
Temporal coverage Data availability (%): areas of poor data return (< 50 %) are discarded from any analysis.
Evolution of spatial coverage Monitoring of fluctuations due to the day–night cycle. Identification of time steps of sharp de-crease in spatial coverage.
Spatial coverage vs. temporal coverage
Verification of the 80–80 % recommended level of data provision.
COS uncertainty metrics (standard deviation ofU/V, covarianceU/V)
Useful resource, based on fluctuations in the data themselves.
Finally, rotatory spectral analyses (Gonella, 1972) have been performed for HF radar-derived total vectors at the HFR1 location and for current data from B1 in order to iden-tify the dominant modes of temporal variability. To ensure the continuity of the data record, small gaps detected (not larger than 6 h) in time series have been linearly interpo-lated. Spectra have been calculated by dividing time series into successive 6-day segments, with a 50 % overlap and a Hanning window (Emery and Thompson, 2001), and sub-sequently averaged to provide some smoothing. Confidence levels for spectra densities have been derived assuming a chi-squared distribution for the variance.
3.3 Characterization of the surface circulation field Maps of the Eulerian mean current field have been con-structed at a monthly timescale from the raw (unfiltered) radar time series on a subsampled grid with the aim of as-sessing the surface current dynamics in the Ebro delta. Ad-ditionally, a complex empirical orthogonal function (EOF) decomposition (Kundu and Allen, 1976) has been used to
in-fer the driving forces and spatiotemporal scales behind the variability of sea surface currents (Kaihatu et al., 1998). This method, which reduces the components of the vector field to a complex scalar, has become widespread in order to extract the dominant modes of variability. The representative spa-tial patterns (or EOF modes) and their corresponding tem-poral coefficients or principal components (PCs, which de-scribe the evolution of the modes) are determined by using the singular value decomposition of the covariance matrix. Each statistically significant EOF mode explains a limited portion of the total surface current variance.
decor-relation scales have been calculated according to North et al. (1982):
δ (λi)=λi·(2/N ) 1
2, (1)
where δi is the eigenvalue for modei, and N is the num-ber of degrees of freedom determined using a conservative 2-day decorrelation timescale, following Münchow and Chant (2000). If the confidence intervals from the error estimates of any modes overlap, the modes may be non-orthogonal and can not be considered distinct and uncorrelated. Con-sequently, such modes are excluded from the EOF analysis and hence only the first previous modes can be considered to contain a significant portion of the total variance and to properly reproduce the observed surface current fields.
Finally, the hourly wind vector data set registered at the B1 buoy has been decomposed into principal components in order to infer the main axis of variability. Particular emphasis has been placed on the relationship between wind and radar-derived current EOF modes of variability in order to derive a better statistical insight.
4 Results and discussion 4.1 Annual quality control
Boxplots of SNR3 for each radar site (Fig. 2a, b, c) exhibit a consistent monthly evolution, with a median (central mark) above 40 dB. However, a number of sharp decreases can oc-casionally be observed at the VINA site for the month of June (Fig. 2c), exceeding the previously reported threshold of 10 dB (De Paolo and Terril, 2007).
The annual time series of hourly SNR3 values for the VINA site (Fig. 2d) reveals that the thresholds proposed in the present work (2 standard deviations above/below the mean, represented by bold blue dotted lines) were abruptly exceeded several times in June. SNR3 reached extremely low values, leading to a drastic reduction in the radar spatial cov-erage presumably related to an inherent limitation of the MU-SIC algorithm, namely, the extraction of a maximum of two bearing solutions for a given range cell and a given radial current velocity. In this context, poor SNR3 values associ-ated with potential interferences or environmental noise can lead to ambiguities in the estimation of the direction of ar-rival (DOA) function performed by the MUSIC algorithm. Such ambiguities, based on the existence of more than two bearing solutions, eventually produce gaps in HF radar spa-tial coverage since additional solutions are excluded.
Consequently, the number of radial vectors (NRV) pro-vided by VINA decreased significantly in June (Fig. 2e). Leaving aside the regular high-frequency fluctuations due to the day–night cycle, NRV was several times below 500 and even equal to zero, indicating a poorer than expected per-formance of the VINA site during this month. Nonetheless, it appears to be a sporadic episode, maybe related to
radio-Figure 2.Annual quality control of Ebro delta radar sites, SALO (a), ALFA(b) and VINA(c), based on monthly boxplots of the
signal-to-noise ratio at the monopole (SNR3) for 2014. In each box, the central mark is the median, the edges of the box are the 25th and 75th percentiles, and the whiskers extend to the most extreme data points.(d)Annual time series of hourly SNR3 values for the VINA site.(e)Monthly time series of hourly radial vectors provided by
the VINA site during June 2014. The solid and dashed blue lines represent the mean and the standard deviation for the entire 2014, respectively. The bold blue dotted lines denote the thresholds of 2 standard deviations above/below the mean.
wave interferences, since VINA presented a stable perfor-mance during the second semester of 2014.
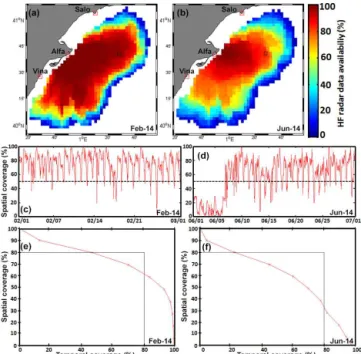
Figure 3.Evaluation of Ebro delta HF radar system performance
on a monthly basis: February (left) and June (right) 2014. A com-parative analysis is carried out for the radar data availability(a–b),
the temporal evolution of the spatial coverage(c–d)and the
rela-tionship between both the spatial and temporal coverage(e–f). The
black square represented in(a–b)denotes the B1 buoy location.
(Fig. 3b). The evolution of the spatial coverage was rather consistent in February, with sporadic decreases below 50 % (Fig. 3c). On the contrary, an irregular performance is de-tected in June as a consequence of both ALFA site outage (1–8 June) and VINA irregular behavior (Fig. 3d). The first factor yielded a dramatic and persistent drop in the areal cov-erage, lower than 20 % most of the time. The second led to a significant, albeit occasional, reduction in the radar spatial domain (below 50 %), which can be observed from 8 to 30 June 2014.
Finally, the temporal and spatial coverages have been com-pared to each other (Fig. 3e, f). The Ebro delta radar system was closer to fulfilling the required 80–80 % level of data provision in February (Roarty et al., 2012), with 64 % of the areal domain (referred to as its maximum extent) avail-able 80 % of the time. By contrast, the radar system barely reached 35 % of spatial coverage for 80 % of the time in June. Despite this occasional degradation, radar sites’ overall performance and their day-to-day operation have been found to be robust and within tolerance ranges. One year of con-tinuous operation revealed three sites up and operational in excess of 95 % of the time, with sporadic interruptions that introduced short-duration gaps in time and space (Fig. 1c).
It is noteworthy that the described methodology, at this preliminary development stage, is not able to remove suspi-cious values or outliers from the data stream in real time like Cosoli et al. (2012b), but only to detect anomalies and
cate-gorize them in order to create a historic database of flagged radial files similar to Roarty et al. (2012) for a later offline reprocessing of total vector maps when one (or more) radar site(s) is (are) considered to be working abnormally. In this context, the hourly radial vectors provided by the VINA site in June that did not satisfy the proposed QC control have been discarded from the analyses performed in the next sec-tions and the associated total vector maps have been accord-ingly reprocessed offline. Future efforts should be devoted to improving radial data quality in real time prior to the vec-tor combination process and also to assigning meaningful quality descriptor flags for all grid point data in total current fields.
4.2 Buoy–radar comparison results
The evaluation of direction-finding capabilities revealed the existence of small bearing errors (hereafter1α)in radar
ra-dial estimations, ranging between 2 and 8◦(Fig. 4) and in ac-cordance with the typical values previously reported (Emery et al., 2004; Paduan et al., 2006). Comparison of unfiltered hourly radial currents estimated by B1 and the SALO site (Fig. 4b) shows maximum CORR in a grid point (denoted by a vertical solid red line) angularly close to the B1 location (vertical dotted black line): 0.79, with an associated RMSE of 10.95 cm s−1 and1α of 3.74◦ in the counter-clockwise direction. The VINA site (Fig. 4c) presents a lower bearing offset (1α=1.82◦) but also a lower (higher) CORR (RMSE) value of 0.58 (13.31 cm s−1). It is worth mentioning that min-imum RMSE values are also located in the vicinity of the cor-relation peaks. The VINA site exhibits the largest pointing error (1α=7.82◦) and the poorest agreement with moored radial estimations as CORR is 0.58 and RMSE is fairly above 18 cm s−1(Fig. 4d).
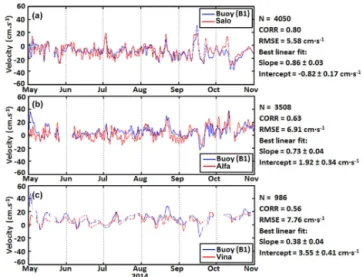
Hourly time series of low-pass filtered radial currents mea-sured by B1 and those estimated in the closest range arc point (“best match-angle”) by each HF radar site are presented in Fig. 5. Metrics derived from the accuracy assessment high-light the consistently high agreement between the SALO radar site and B1 estimations, with CORR and RMSE values of 0.80 and 5.58 cm s−1, respectively (Fig. 5a). Results de-rived from the best linear fit reveal a slope close to 1 and an intercept up to−0.82 cm s−1. The concordance between the ALFA site and B1 is moderately good, with acceptable pairs of values CORR–RMSE and slope intercept: [0.63–6.91] and [0.73–1.92] cm s−1, respectively (Fig. 5b). VINA site data show lower agreement with in situ measurements (Fig. 5c), as reflected by a lower (higher) CORR (RMSE) value of 0.56 (7.76 cm s−1). This might be partially attributable to the long site–buoy distance (i.e., the radar signal is weaker) and to the limited radar data availability due to day/night coverage fluc-tuations (i.e., the data return is more than 3 times lower, with only 986 hourly observations available).
Figure 4. (a)Angular position of Ebro delta HF radar sites with
re-spect to the B1 buoy location. Angle values are measured counter-clockwise from east, indicating arc limits and buoy direction.(b–d)
Correlation (solid line) and RMSE (dashed line) between unfiltered radial currents estimated by the B1 buoy and those measured by three HF radar sites, SALO(b), ALFA(c), and VINA(d), using
cal-ibrated antenna patterns for a 6-month period May–October 2014. The vertical dotted line represents the angular position of B1. The vertical red solid line denotes the angular position of maximum cor-relation (CORR), which is gathered with the associated RMSE and bearing offset (1α)values.
to the Ebro delta radar sites’ geometry. Radar-to-radar com-parisons along the overwater baselines (Paduan et al., 2006; Yoshikawa et al., 2006; Atwater and Heron, 2010), although valuable for exploring quantitatively intrinsic uncertainties
Figure 5.Comparison of low-pass filtered hourly time series
(cut-off period of 30 h) of radial currents measured by B1 buoy (blue line) and HF radar sites (red lines):(a)SALO,(b)ALFA and(c)
VINA in the range arc point closest to the B1 location for a 6-month period May–October 2014, using calibrated antenna patterns.N, slope and intercept represent the number of hourly radial current observations and the results derived from the best linear fits, respec-tively.
in radial velocities, are not feasible since they are positioned over land or near the coastline.
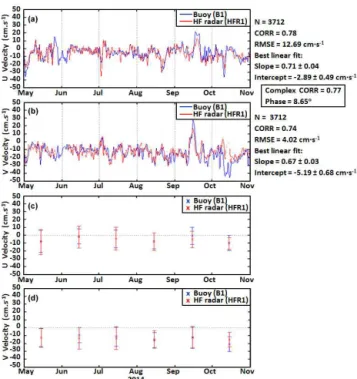
Statistical metrics derived from filtered hourly time series comparison of zonal (U) and meridional (V) components of
total vectors estimated by B1 and HFR1 for the 6-month pe-riod are presented in Fig. 6. Results reveal a good agree-ment for both components (CORR above 0.74), in accor-dance with results reported in the literature (Cosoli et al., 2010; Kaplan et al., 2005). RMSE is significantly higher for the zonal component than for the meridional: 12.69 vs. 4.02 cm s−1(Fig. 6a, b). The disparity of uncertainty levels between the east and north component vectors comes for the geometry of the radar vector combination and the prevalent south-southwestward current flow. This presumably might lead to less (more) precise radial vectors provided by the ALFA (SALO) radar site since radial measurements have proven to be more accurate when the dominant current flow moves in the same direction (Robinson et al., 2011). Since the ALFA (SALO) site contributed mainly to the HF radar zonal (meridional) current assessment in the nearby B1 re-gion, a strong relationship between radial and total vector uncertainties has been shown.
The scatterplots (not shown) and the associated best linear fits show that HF radar slightly underestimates total current velocities registered by B1 since the slopes are below 1: 0.71 and 0.67 forU andV components, respectively. The
Figure 6.Low-pass filtered (cut-off period of 30 h) hourly time se-ries of zonal (a)and meridional(b)components of total currents
measured by the B1 buoy (blue line) and HF radar at the closest grid point HFR1 (red line), for a 6-month period May–October 2014. Mean zonal(c)and meridional(d)current velocities, averaged over
individual months for both HF radar and B1 measurements, with 1 standard deviation (error bars represent the 95 % confidence inter-val).
shifted since the veering angle gives the average counter-clockwise turning of the second vector with respect to the first vector (Kundu, 1976).
The monthly mean current values were computed to char-acterize the main features of the flow in this region. The de-scriptive statistics reveal predominant negative values for the zonal speed (Fig. 6c) and a quasi-permanent average flow in the N–S direction (Fig. 6d). There is no evidence of a sea-sonal signal in both zonal and meridional velocity compo-nents of radar and B1 surface currents. Therefore, both in-struments exhibit similar monthly mean values and variabil-ity, capturing the well-known southwestward thermohaline flow and identifying episodic but intense current reversals, such as those observed by mid-September (Fig. 6a, b).
The monthly comparison of total vectors, performed on the unfiltered time series, provides a variety of metrics that are concisely summarized in a Taylor diagram (Taylor, 2001) shown in Fig. 7. The diagram compares both data sets by combining information about their relative standard devia-tions, centered RMSE and CORR, synthesizing the statis-tical information of how closely the radar measurements at the HFR1 grid point match with B1 velocities. As can be seen, the cluster of points that show the best agreement (i.e., are closest to their corresponding reference point,
la-Figure 7.Taylor diagrams, based on the law of cosines, provide a
concise statistical summary of how closely unfiltered hourly radar estimations (red filled squares) match with B1 observations (blue filled squares), considered here as the reference points of perfect agreement. Taylor diagrams for zonal(a)and meridional(b)
veloc-ity components gather the monthly statistical metrics derived from HF radar–B1 comparison. Sequential numbers refer to individual months of the analyzed period May–October 2014 (1: May; 6: Oc-tober).
beled with blue squares) are those corresponding to the pe-riod May–September (red squares, sequentially numbered 1–5). The reported correlation coefficient, standard devia-tion and RMSE values emerge in the ranges of [0.72–0.83], [10.96–14.18] and [7.48–8.75 cm s−1], respectively, for both zonal and meridional velocity components (Fig. 7a, b). How-ever, HF radar is less accurate by the last month of the ana-lyzed period, since metrics computed for October (red square 6) reflect lower (higher) CORR (RMSE) values: 0.50–0.58 (10.92–11.03).
Instrument-to-instrument comparisons present intrinsic limitations since both devices operate differently and at dis-tinct nominal depths. A fraction of observed radar–B1 dif-ferences can thus be explained in terms of different sampling strategies on disparate timescales and space scales (Ohlmann et al., 2007). In this context, many of the uncertainties associ-ated with HF radar technology are geometric in nature. Apart from the instrumental noise, other sources of potential errors in vector currents might be the sub-grid horizontal shear, the geophysical variability within the water column (Graber et al., 1997) and some specific processes, namely, the Stokes drift, the Ekman drift and baroclinity (Paduan et al., 2006).
sub-Figure 8. Spectral density of the rotary auto-spectra of the B1
buoy (blue) and HF radar at the closest grid point HFR1 (red), performed for a 6-month period May–October 2014 of concur-rent records. Clockwise (counter-clockwise) components are rep-resented by solid (dotted) lines. Vertical dashed lines indicate the frequencies of the diurnal constituent (K1)and the inertial oscilla-tions(f). Error bars indicate the 95 % confidence interval.
sequently, the importance of local wind as a forcing mecha-nism (addressed in Sect. 4.3.2). Offshore oscillations in this frequency band are a common feature in ocean circulation and their presence in the study area has been previously documented (Font et al., 1990). By contrast, the counter-clockwise component (CCW, dotted lines) is much less en-ergetic (especially in the case of B1 current estimations) and is where the main radar–B1 differences in variance distribu-tion can be found. Finally, a drop of energy and later flat-tening about 2 cpd are common for the CW components of both B1 and radar spectra, although the latter presents larger energy at that frequency band. Radar surface estimations are influenced by energetic high-frequency processes related to air–sea interaction like highly variable and strong wind gusts, which are not fully contained in sub-surface current estima-tions provided by the current meter.
4.3 Dominant features of the surface flow 4.3.1 Monthly averaged current patterns
The sequence of monthly averaged current maps in Fig. 9 shows that some of the main circulation features in the Ebro delta remain rather invariant throughout most of the year, like the southwestward slope jet, associated with the high-est velocities detected (above 30 cm s−1). The current speed diminishes toward coastal areas, except in the vicinity of the ALFA radar site, where the signal of Ebro River impulsive-type freshwater outflow is clearly evidenced during win-ter and spring (Fig. 9a, b, f). As a consequence of the re-markable seasonal variability of Ebro discharge rates, the river plume loses intensity during the warm season (Fig. 9c), becoming barely noticeable in late summer and early fall
Figure 9.Monthly averaged surface velocity fields, based on
unfil-tered hourly HF radar current data, for(a)February,(b)April,(c)
July,(d) August,(e)October, and (f)December 2014. The study
area is not uniformly covered since only radar grid points satisfying a minimum data return of 50 % over the monthly record have been considered. Only one grid point of every two is plotted for visual-ization reasons.
(Fig. 9d, e), until the beginning of the following hydrologi-cal cycle (Fig. 9f).
The weakening of the southwestward slope jet during the central part of the year is noteworthy, in agreement with re-ported short periods of current reversals (Font et al., 1990). The jet is intensified in October, perhaps as a result of the ob-served increase in the mesoscale activity (Font et al., 1995), reaching ultimately a peak strength in December. By the end of 2014, the monthly spatial patterns become rather uniform, revealing the acceleration of the jet (with a spatial propa-gation of maximum velocities, exceeding 40 cm s−1)in the eastern region of the radar domain and also the presence of two small-scale coastal meanders (Fig. 9e, f).
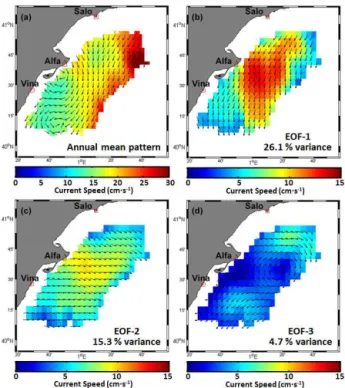
Figure 10.Spatial patterns of the (a)annual mean velocity field
and(b)first,(c)second and(d)third EOF dominant modes of
un-filtered hourly radar surface currents for 2014. Current vectors were plotted in every second grid point for clarity. Variance explained is indicated in the lower right corner of the corresponding panel.
“mistral” winds), dominant during the October–May cold season and channeled by the narrow Ebro Valley, have been reported to introduce negative vorticity in the flow south of the Ebro delta and to reinforce the long-term preservation of this small-scale eddy (Garcia and Ballester, 1984; Espino et al., 1998). Notwithstanding, this coastal clockwise rotation is eventually absent from September (not shown) to December monthly averaged current maps.
During the transition month of August, a large anticyclonic recirculation cell is evidenced, detached from the shore and located in the center of the radar domain (Fig. 9d). This cur-rent pattern is dominated by the interaction of the cross-shelf flow on the southern inner shelf with topographic obstacles, giving rise to a shift to the right of the coastal flow. The sub-sequent northeastward reversal of the inshore flow is scarcely influenced by Ebro River freshwater discharge as it reaches the lowest value at this stage of the year.
4.3.2 Empirical orthogonal function (EOF) analysis The mean and EOFs of hourly surface currents have been calculated for the entire 2014 (Fig. 10). The long-term mean flow (Fig. 10a) captures the main circulation features pre-viously reported about the North Current, characterized by a quasi-permanent shelf-slope jet oriented southwestward and a remarkable Ebro River impulsive-type freshwater
dis-Figure 11.Time coefficients of the first (blue), second (red) and
third (green) EOF modes of the hourly radar current data set evalu-ated for the entire year 2014. Time series have been filtered with a 20-day running mean.
charge (located in front of the ALFA site). The buoyancy in-put introduced by large delta outflows, together with topo-graphic effects, leads to the development of the aforemen-tioned anticyclonic coastal eddy on the southern side of the delta.
Since the EOF analysis has been performed on the unfil-tered data set containing relevant high-frequency spatiotem-poral variability, the first three EOFs cumulatively account only for 46.1 % of the total variance (26.1, 15.3 and 4.7 %, respectively). Only the first three EOF modes are statistically significant according to the mode selection rule and trunca-tion criterion suggested by North et al. (1982). The first, sec-ond and third modes are distinct and uncorrelated; however, the fourth mode is not since its error bars overlap with those of mode 5 (not shown). Therefore, higher-order modes will not be further addressed here as they represent a combination of unresolved high-frequency motions or noise (Cosoli et al., 2012a).
The first dominant EOF mode (Fig. 10b) represents a spa-tially uniform pattern, rather similar to the annual averaged current map, with a prevailing alongshore shelf-slope jet flowing mainly southwestward, basically capturing the ther-mohaline Catalan front. The second EOF (Fig. 10c) shows a homogeneous spatial structure, perpendicular to the first mode, with a well-defined offshore-directed flow. The spatial pattern of EOF3 (Fig. 10d) adds some complexity to the ba-sic uniform flows represented by the first two modes, since it introduces curvature to the current field by means of a large, albeit weak, anticyclonic recirculation cell (flow divergence) in the central (southern) region of the radar domain.
(positive EOF3) and some periods of current reversals, with maximum occurrence during the stratified warm season as reported by Font et al. (1990). Nevertheless, EOF1 becomes strongly positive again during the fall, reaching a peak by mid-December, in clear agreement with the strengthened shelf-slope jet flowing southwestwards shown in Fig. 9f. The temporal structure of EOF2 reveals a principal offshore-directed flow through the January–May period and also in late December, coincident with the cold season (October– May) that is characterized by both energetic mistral winds and Ebro River high discharge rates. Lastly, EOF3 adds clockwise curvature for most parts of the year (February– September and November). The evident enhancement of the anticyclonic gyre in August (positive EOF3), combined with the onshore-directed flow (negative EOF2) and the reversal of the main current flow (negative EOF1) during that time period, gave rise to a complex circulation scheme rather sim-ilar to the monthly averaged pattern represented in Fig. 9d.
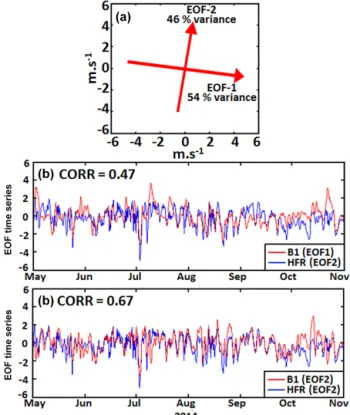
In order to define the prevalent wind directions registered at B1, the major and minor variance axes have been deter-mined (Fig. 12a). The results show that the main variability occurs along a direction 99◦azimuth containing 54 % of the total energy. This is the EOF1 mode, largely aligned with per-sistent and intense northwesterly mistral winds channeled by the narrow Ebro Valley (Font, 1990). The orthogonal EOF2 mode is oriented 9◦clockwise from north and holds the re-maining 46 % of the variance, capturing mainly the influence of alongshore winds.
Linear correlation coefficients have been computed be-tween the principal components related to the two main wind EOF modes of variability and radar-derived EOF2, since the cross-shelf circulation shown in Fig. 10c might be presum-ably driven by strong local winds. The high correlation be-tween the filtered principal components can be readily seen in Fig. 12b–c, with a value of 0.47 (0.67) for wind-PC1 (PC2) and radar-PC2, respectively. The results underline that the surface current variability in the Ebro delta can be influenced by wind action, in accordance with Espino et al. (1998), who demonstrated such a relationship when winds are strong and steady enough. The higher agreement between both wind– radar PC2 appears to be consistent with Ekman transport to the right of the wind direction. By contrast, northwesterly mistral wind events (PC1) are expected to enforce the preva-lent offshore-directed circulation regime (radar EOF2) by in-creasing the mean speed of the flow.
Equally, the influence of local wind forcing on HF radar EOF1 mode has been assessed (but not shown), with a corre-lation coefficient of 0.52 (−0.28) for wind PC1 (PC2). This finding highlights the impact of mistral winds on the predom-inant southwestward flow, by inducing an Ekman veering.
5 Concluding remarks and future work
Since the acquisition of high-quality surface current data re-mains a priority for HF radar operators and the research
com-Figure 12. (a)Main axes of variability for hourly wind data
reg-istered at the B1 buoy.(b)Principal components of the first EOF
mode of wind (m s−1, in red) and the second EOF mode of radar currents (cm s−1, in blue).(c)Principal components of the second EOF mode of wind (red) and the second EOF mode of radar cur-rents (blue). The amplitudes have been normalized by their respec-tive standard deviations and filtered with a 1-day running mean.
munity, a combined quality control (QC) methodology has been applied for a three-site standard range (13.5 MHz) CO-DAR SeaSonde HF radar network deployed at the Ebro delta (northeastern Spain). This integrated approach consists of 1-year long (2014) real-time web monitoring of nonvelocity-based diagnostic parameters, coordinated with a 6-month (May–October 2014) validation of HF radar data (at both the radial and total vector levels) with independent in situ obser-vations from a point-wise current meter installed in the B1 buoy, moored within the radar footprint.
The overall stable and accurate performance of Ebro delta HF radar during 2014, derived from the combined QC-validation approach, suggests that sites were functioning properly and that their APMs were correctly performed and integrated in the data processing. This provides ground truth to examine future radar performances.
impulsive-type freshwater discharge. It is also noteworthy that this study has been performed in a low-energy shelf where the surface currents are generally weaker than most of those referenced herein (Lorente et al., 2014). The EOF analysis related the flow response to local winds and con-firmed that the surface current field evolved in space and time according to three dominant modes of variability, which sig-nificantly account for 46.1 % of the variance.
Regarding the Ebro delta study area, active and planned efforts are devoted to an extensive description of a variety of marine processes impacting on the evolution and reshape of the nearshore deltaic area: the wave action eroding exposed wetlands, the sediment transport, the freshwater discharges and buoyancy fluxes (which further complicate water mo-tions in the Ebro delta) and ultimately the major influence of local wind forcing.
Future works should include the use of verified HF radar data for the rigorous skill assessment of operational ocean circulation systems currently running in the Ebro delta re-gion, like the IBI (Iberia–Biscay–Ireland) regional system (Sotillo et al., 2015), implemented within the framework of MyOcean projects and the Copernicus Marine Environ-ment Monitoring Service (CMEMS). A combined observa-tional and modeling approach would provide a comprehen-sive characterization of the coastal circulation and benefit from the complementary nature of both systems. HF radar observations improve the model description by resolving low-scale processes in areas with significant topographic gra-dients, whereas model outputs provide a 3-D quantitative pic-ture with vertical resolution that completes the surface radar-derived information when the quality data or the spatiotem-poral coverage are poorer.
This integrated strategy might complement and optimize the intense monitoring activity performed around the deltaic coastline through the timely and seamless delivery of high-quality operational products, devoted to supporting wise decision-making and mitigating anthropogenic hazards in the marine environment. Such products could also provide paramount information on biological connectivity between the Ebro delta marine protected area and other relevant eco-logical regions in the western Mediterranean Sea.
Acknowledgements. The authors gratefully acknowledge the
Qualitas Remos Company (a partner of CODAR Ocean Sensors) for the useful suggestions, and deeply appreciate comments provided during the paper revision process by Donald Barrick, Jeffrey Paduan and Guillaume Charria, which significantly im-proved the quality of the manuscript. The Spanish Ministerio de Economía y Competitividad supported this study through the OPErational RAdars for research in marine sciences (OPERA) project (CTM2012-33223).
Edited by: P.-Y. Le Traon
References
Alfonso, M., Álvarez-Fanjul, E., and López, J. D.: Comparison of CODAR SeaSonde HF Radar operational waves and currents measurements with Puertos del Estado buoys, Final Internal Re-port of Puertos del Estado, 1–32, 2006.
Atwater, D. P. and Heron, M. L.: HF radar two-station baseline bi-sector comparisons of radial components, Proceedings of IEEE Oceans 2010, Sydney, Australia, 1–4, 2010.
Atwater, D. P. and Heron, M. L.: A first approach to SeaSonde qual-ity control, Proceedings of IEEE Oceans 2011, Waikoloa, HI, USA, 1–5, 2011.
Barrick, D. E. and Lipa, B. J.: Correcting for distorted antenna pat-terns in CODAR ocean surface measurements, IEEE J. Oceanic Eng., OE-11, 304–309, 1986.
Barrick, D., Fernandez, V., Ferrer, M. I., Whelan, C., and Breivik, Ø.: A short-term predictive system for surface currents from a rapidly deployed coastal HF radar network, Ocean Dynam., 62, 725–740, 2012.
Chapman, R. D. and Graber, H. C.: Validation of HF radar measure-ments, Oceanography, 10, 76–79, 1997.
Chapman, R. D., Shay, L. K., Graber, H. C., Edson, J. B., Karach-intsev, A., Trump, C. L., and Ross, D. B.: On the accuracy of HF radar surface current measurements: intercomparison with ship-based sensors, J. Geophys. Res. 102, 18737–18748, 1997. Codar Ocean Sensors: SeaSonde Diagnostic Files, CODAR Internal
Document, May, 2005.
Cosoli, S., Mazzoldi, A., and Gacic, M.: Validation of surface cur-rent measurements in the Northern Adriatic Sea from High Fre-quency radars, J. Atmos. Ocean. Tech., 27, 908–919, 2010. Cosoli, S., Gacic, M., and Mazzoldi, A.: Surface current variability
and wind influence in the north eastern Adriatic Sea as observed from high-frequency (HF) radar measurements, Cont. Shelf Res., 33, 1–13, 2012a.
Cosoli, S., Bolzon, G., and Mazzoldi, A.: A Real-Time and Offline Quality Control Methodology for SeaSonde High-Frequency Radar Currents, J. Atmos. Ocean. Tech., 29, 1313–1328, 2012b. Cosoli, S., Licer, M., Vodopivec, M., and Malacic, V.: Surface circu-lation in the Gulf of Trieste (northern Adriatic Sea) from radar, model, and ADCP comparisons, J. Geophys. Res., 118, 6183– 6200, 2013.
Crombie, D. D.: Doppler spectrum of sea echo at 13.56 Mc/s, Na-ture, 175, 681–682, 1955.
De Paolo, T. and Terrill, E. J.: Skill assessment of resolving ocean surface current structure using compact-antenna-style HF radar and the MUSIC direction-finding algorithm, J. Atmos. Ocean. Tech., 24, 1277–1300, 2007.
De Paolo, T., Terril, E., and Kirincich, A.: Improving SeaSonde ra-dial velocity accuracy and variance using rara-dial metrics, IEEE Oceans 2015, Genova, Italy, 1–9, 2015.
Emery, B., Washburn, M. L., and Harlan, J. A.: Evaluating radial current measurements from CODAR high frequency radars with moored current meters, J. Atmos. Ocean. Tech., 21, 1259–1271, 2004.
Emery, B. M. and Washburn, L.: Evaluation of SeaSonde Hardware Diagnostic Parameters as Performance Metrics, NOAA IOOS fi-nal report, October 2007 CA, USA, 2007.
Espino, M., Sanchez-Arcilla, A., and Garcia, M. A.: Wind induced mesoscale circulation off the Ebro Delta, NW Mediterranean: a numerical study, J. Marine Syst., 16, 235–251, 1998.
Font, J.: A comparison of seasonal winds with currents on the con-tinental slope of the Catalan sea (Northwestern Mediterranean), J. Geophys. Res., 95, 1537–1545, 1990.
Font, J., Salat, J., and Tintore, J.: Permanent features of the circu-lation in the Catalan Sea, Pelagic Mediterranean Oceanography, Oceanol. Acta, 9, 51–57, 1988a.
Font, J., Salat, J., and Wang, D. P.: Lagrangian and Eulerian obser-vation of inertial oscillations in the shelf break offshore the Ebro River Delta (Catalan Sea, NW Mediterranean), Rapp. Comm. Int. Mer Médit, 31, p. 2, 1988b.
Font, J., Garcia-Ladona, E. and Gorriz, E. G.: The seasonality of mesoscale motion in the Northern Current of the Western Mediterranean: several years of evidence, Oceanol. Acta, 18, 207–219, 1995.
Garcia, M. A. and Ballester, A.: Notas acerca de la meteorología y la circulación local en la región del Delta del Ebro, Invest. Pesquera (now Sci. Mar.) 48, 469–493, 1984.
Gomez, R., Helzel, T., Petersen, L., Kniephoff, K., Merz, C. R., Liu, Y., and Weisberg, R. H.: Real-time quality control of current ve-locity data on individual grid cells in WERA HF radar, Oceans 2014, Taipei, Taiwan, 7–10 April 2014, 1–7, 2014.
Gomez, R., Helzel, T., Merz, C. R., Liu, Y., Weisberg, R. H., and Thomas, N.: Improvements in ocean surface radar appli-cations through real-time data quality-control, Conference: Cur-rent, Waves and Turbulence Measurement (CWTM), IEEE/OES, 2–6 March 2015, Florida, USA, 2015.
Gonella, J.: A rotary-component method for analyzing meteorolog-ical and oceanographic vector time series, Deep-Sea Res. Pt II, 19: 833–846, 1972.
Graber, H. C., Haus, B. K., Shay, L. K., and Chapman, R. D.: HF radar comparisons with moored estimates of current speed and direction: Expected differences and implications, J. Geophys. Res., 102, 749–766, 1997.
Jimenez, J. A., Guillen, J., Sanchez-Arcilla, A., Gracia, V., and Palanques, A.: Influence of benthic boundary layer dynamics on wind-induced currents in the Ebro Delta inner shelf, J. Geophys. Res., 107, 1–10, 2002.
Kaplan, D. M. and Lekien, F.: Spatial interpolation and filtering of surface current data based on open-boundary modal analysis, J. Geophys. Res.-Oceans (1978–2012), 112, 1–20, 2007.
Kaplan, D. M., Largier, J., and Botsford, L. W.: HF radar observa-tions of surface circulation off Bodega Bay (northern California, USA), J. Geophys. Res., 110, 1–25, 2005.
Kaihatu, J. M., Handler, R. A., Marmorino, G. O., and Shay, L. K.: Empirical orthogonal function analysis of ocean surface currents using complex and real-vector methods, J. Atmos. Ocean. Tech., 15, 927–941, 1998.
Kirincich, A. R., de Paolo, T., and Terrill, E.: Improving HF Radar Estimates of Surface Currents Using Signal Quality Metrics, with Application to the MVCO High-Resolution Radar System, J. Atmos. Ocean. Tech., 29, 1377–1390, 2012.
Kohut, J. T. and Glenn, S. M.: Improving HF radar surface current measurements with measured antenna beam patterns, J. Atmos. Ocean. Tech., 20, 1303–1316, 2003.
Kovaˇcevi´c, V., Gaˇci´c, M., Mancero Mosquera, I., Mazzoldi, A., and Marinetti, S.: HF radar observations in the northern Adriatic:
surface current field in front of the Venetian Lagoon, J. Marine Syst., 51, 95–122, 2004.
Kundu, P.: Ekman veering observed near the ocean bottom, J. Phys. Oceanogr., 6, 238–242, 1976.
Kundu, P. K. and Allen, J. S.: Some three-dimensional characteris-tics of low-frequency current fluctuations near the Oregon coast, J. Phys. Oceanogr. 6, 181–199, 1976.
Levanon, N.: Lowest GDOP in 2-D scenarios, IEEE Proceedings, Radar, Sonar Navigation, 147, 149–155, 2000.
Lipa, B., Nyden, B., Ullman, D. S., and Terrill, E.: SeaSonde radial velocities: derivation and internal consistency, IEEE J. Oceanic Eng., 31, 850–861, 2006.
Liu, Y., Weisberg, R. H., and Merz, C. R.: Assessment of CODAR SeaSonde and WERA HF Radars in Mapping Surface Currents on the West Florida Shelf, J. Atmos. Ocean. Tech., 31, 1363– 1382, 2014.
Lorente, P., Piedracoba, S., Soto-Navarro, J., and Alvarez-Fanjul, E.: Accuracy assessment of high frequency radar current mea-surements in the Strait of Gibraltar, Journal of Operational Oceanography, 7, 59–73, 2014.
Lorente, P., Piedracoba, S., Soto-Navarro, J., Ruiz, M. I., Alvarez-Fanjul, E., and Montero, P.: Towards the implementation of a fully operational HF coastal radar network operated by Puertos del Estado, IEEE Oceans 2015, Genova, Italy, 1–6, 2015a. Lorente, P., Piedracoba, S., and Alvarez-Fanjul, E.: Validation of
high-frequency radar ocean surface current observations in the NW of the Iberian Peninsula, Cont. Shelf Res. 92, 1–15, 2015b. Lorente, P., Piedracoba, S., Soto-Navarro, J., and Alvarez-Fanjul,
E.: A combined QC methodology in Ebro Delta HF radar system: real time web monitoring of diagnostic parameters and offline validation of current data, European Geosciences Union General Assembly (EGU), 12–17 April 2015, Vienna, Austria, 2015c. Marmain, J., Molcard, A., Forget, P., and Barth, A.: Assimilation
of HF radar surface currents to optimize forcing in the North Western Mediterranean sea, Nonlinear Proc. Geophy., 21, 659– 675, 2014.
Münchow, A. and Chant, R. J.: Kinematics of inner shelf motions during the summer stratified season off New Jersey, J. Phys, Oceanogr., 30, 247–268, 2000.
North, G. R., Bell, T. L., Cahalan R. F., and Moeng, F. J.: Sampling errors in the estimation of empirical orthogonal functions, Mon. Weather Rev., 110, 699–706, 1982.
Ohlmann, C., White, P., Washburn, L., Terril, E., Emery, B., and Otero, M.: Interpretation of coastal HF radar-derived currents with high-resolution drifter data, J. Atmos. Ocean. Tech., 24: 666–680, 2007.
Paduan, J. D., Kim, K. C., Cook, M. S., and Chavez, F. P.: Cali-bration and validation of direction-finding High-Frequency radar ocean surface current observations, IEEE J. Oceanic Eng., 31, 862–875, 2006.
Robinson, A. M., Wyatt, L. R., and Howarth, M. J.: A two year comparison between HF radar and ADCP current measurements in Liverpool Bay, Journal of Operational Oceanography, 4, 33– 45, 2011.
Roarty, H., Smith, M., Kerfoot, J., Kohut, J., and Glenn, S.: Au-tomated Quality Control of High Frequency Radar Data, IEEE Oceans 2012, 1–7, 2012.
High-Frequency Radar and Surface Drifter Data: Effects of Radar Resolution and Flow Components, J. Atmos. Ocean. Tech., 31, 945–966, 2014.
Salat, J., Garcia, M. A., Cruzado, A., Palanques, A., Arín, L., Gomis, D., Guillen, J., de León, A., Puigdefàbregas, J., Sospedra, J., and Velásquez, Z. R.: Seasonal changes of water mass struc-ture and shelf-slope exchanges at the Ebro Shelf (NW Mediter-ranean), Cont. Shelf Res., 22, 327–348, 2002.
Schmidt, R.: Multiple emitter location and signal parameter estima-tion, IEEE T. Antenn. Propag., 34, 276–280, 1986.
Solabarrieta, L., Rubio, A., Castanedo, S., Medina, R., Charria, G., and Hernández, C.: Surface water circulation patterns in the southeastern Bay of Biscay: New evidences from HF radar data, Cont. Shelf Res., 74, 60–76, 2014.
Sotillo, M. G., Cailleau, S., Lorente, P., Levier, B., Aznar, R., Ref-fray, G., Amo-Baladrón, A., and Alvarez-Fanjul, E.: The My-Ocean IBI My-Ocean Forecast and Reanalysis Systems: Operational products and roadmap to the future Copernicus Service, Journal of Operational Oceanography, 1–18, 2015.
Stanev, E. V., Ziemer, F., Schultz-Stellenfleth, J., Seemann, J., Staneva, J., and Gurgel, K. W.: Blending Surface Currents from HF Radar Observations and Numerical Modelling: Tidal Hind-casts and ForeHind-casts, J. Atmos. Ocean. Tech., 32, 256–281, 2015. Taylor, K. E.: Summarizing multiple aspects of model performance
in a single diagram, J. Geophys. Res., 106, 7183–7192, 2001. Trujillo, D. A., Kelly, F. J., Perez, J. C., Riddles, H. R., and
Bonner, J. S.: Accuracy of Surface Current Velocity Measure-ments Obtained from HF Radar in Corpus Christi Bay, Texas, IEEE/IGARSS Int. Geosci. Remote. Se., 2, 1179–1182, 2004. Wyatt, L.: Improving the quality control and accuracy of HF radar
currents, IEEE Oceans 2015, Genova, Italy, 1–9, 2015.