Murciano-Granadina Goat Performance and
Methane Emission after Replacing Barley
Grain with Fibrous By-Products
Carla Ibáñez1, Patricia Criscioni2, Haritz Arriaga3, Pilar Merino3, Francisco Juan Espinós2, Carlos Fernández2
*
1Facultad de Veterinaria y Ciencias Experimentales, Departamento de Producción Animal y Salud Pública, Universidad Católica de Valencia, 46001, Valencia, Spain,2Research Centre ACUMA, Animal Science Department, Polytechnic University of Valencia, 46022, Valencia, Spain,3NEIKER-Tecnalia, Environment Quality Department, Bizkaia Technology Park, p. 812. 48160, Derio, Bizkaia, Spain
Abstract
The aim of this experiment was to study the effects of substituting dietary barley grain with orange pulp or soybean hulls on energy, nitrogen and carbon balance, methane emission and milk performance in dairy goats. Twelve Murciano-Granadina dairy goats in
midlacta-tion were selected and divided into three groups based on similar body weight (42.1±1.2
kg) and milk yield (2.16±0.060 kg/goat/day). The experiment was conducted in an
incom-plete crossover design where one group of four goats was fed a mixed ration of barley grain (BRL), another group of four goats replaced barley grain with orange pulp (OP) and the last group of four goats with soybean hulls (SH). After adaptation to diets, the goats were allo-cated to individual metabolism cages and intake, faeces, urine and milk were recorded and analysed. Then, gas exchange measurements were recorded by a mobile open-circuit indi-rect calorimetry system using a head box. Dry matter intake was similar for all three groups (2.03 kg/d, on average). No influence of the diet was observed for energy balance and the efficiency of use of metabolizable energy for milk production was 0.61. The OP and SH
diets showed greater (P<0.05) fat mobilization (-42.8 kJ/kg of BW0.75, on average) than
BRL (19.2 kJ/kg of BW0.75). Pentadecanoic acid (15:0) and heptadecanoic acid (17:0) were
potential biomarkers of rumen function because the higher contents found in the milk of OP and SH goats than BRL suggest a negative impact of these diets on rumen bacterial metab-olism; probably linked to the lower nitrogen supply of diet OP to synthesize microbial protein and greater content of fat in diet SH. Replacement of cereal grain with fibrous by-products did not increased enteric methane emissions (54.7 L/goat per day, on average). Therefore, lactating goats could utilize dry orange pulp and soybean hulls diets with no detrimental effect on milk performance.
OPEN ACCESS
Citation:Ibáñez C, Criscioni P, Arriaga H, Merino P, Espinós FJ, Fernández C (2016) Murciano-Granadina Goat Performance and Methane Emission after Replacing Barley Grain with Fibrous By-Products. PLoS ONE 11(3): e0151215. doi:10.1371/ journal.pone.0151215
Editor:François Blachier, National Institute of Agronomic Research, FRANCE
Received:September 29, 2015
Accepted:February 23, 2016
Published:March 16, 2016
Copyright:© 2016 Ibáñez et al. This is an open access article distributed under the terms of the
Creative Commons Attribution License, which permits unrestricted use, distribution, and reproduction in any medium, provided the original author and source are credited.
Data Availability Statement:All relevant data are within the paper.
Funding:This study was supported by the Spanish National Institute for Agronomic Research (RTA2011-00107-C02) and the European Regional
Development Fund (ERDF).
Introduction
To achieve maximum milk production potential by means acceptable to consumers, feeding systems for dairy ruminants need to ensure high energy intake, among other factors. This might be accomplished by raising the dietary concentration of rapidly degraded non-fibrous carbohydrates (NFC), such as starch from cereal grain. Increasing the concentration of NFC in diets for dairy ruminants, however, can lead to undesirable ruminal fermentation, compromis-ing the nutrient supply for production of milk and milk components. The partial replacement of cereal grain with low starch by-product feeds represents a potential alternative to overcome this limitation. By-products from agriculture may be of interest not only for reducing feeding cost but also to minimize environmental problems associated with side-effect accumulation [1].
Recently, there has been increasing interest in by-products as partial substitution of tradi-tional feedstuffs in ruminant feeding. From a nutritradi-tional point of view, by-products are included in the ration to supply energy and protein, but are often also characterized by high fibre content. This is the case of orange pulp or soybean hulls, which are typically used as grain substitutes. A large number of the citrus by-products feedstuffs, including orange pulp, are suitable for inclusion in ruminant diets because of the ability of ruminants to ferment high fibre feeds in the rumen [2]. According to [3] the neutral detergent fibre (NDF) level of dry orange pulp is intermediate (25%) between barley grain (17%) and soy hulls (58%). Orange pulp contains relatively large amounts of pectin (25%) and sugars (23%) and low amounts of lignin (2%) and starch (0.5%), with a very limited amount of available nitrogen (6% of crude protein [CP]). Soybean hull has a similar CP content to that of barley grain (11%) and is high in NDF (58%, high in cellulose) but low in lignin (2%), NFC (24%) and sugars (1.5%), with no starch content (barley grain has 51% starch).
In ruminant nutrition, decreased production of methane (CH4) can represent an
improve-ment in feed efficiency, as ruminants lose between 2–12% of their gross dietary energy in the form of CH4[4]. Ruminant nutrition has been also demonstrated to be an efficient strategy to modify CH4emissions from manure [5]. Moreover, [6] concluded that diet has the greatest effect on the quantity of CH4produced from slurry.
Moreover, ruminants contribute to global warming through emission of nitrous oxide from urine and faeces. To reduce nitrogen (N) excretion and improve N efficiency in ruminants, die-tary levels of N and optimal balance between N and energy substrates in the diet should be targeted.
Our hypothesis is that orange pulp and soybean hulls could replace cereal-based concentrate in goat diets without compromising energy and protein partitioning in lactating goats. The aim of this experiment was to study the effect of replacing barley grain in the mixed diet with dry
orange pulp or soybean hulls on energy partitioning, enteric and manure derived CH4
emis-sions, carbon (C) and N balance and milk performance in dairy goats during midlactation.
Materials and Methods
Ethics statement
The experimental procedure was approved by the Animal Use and Care Committee of the Polytechnic University of Valencia (Spain) and followed the codes of practice for animals used
in experimental works proposed by the [7]. Moreover, the Animal Science Department from
by the European Union [7]. The authors declare that this manuscript does not infringe any eth-ical issues and involves no endangered or protected species.
Animal and feeding
The experiment was conducted at the Animal Science Department Experimental Farm (ACUMA Research Centre), Valencia (Spain). Twelve multiparous mature Murciano-Grana-dina dairy goats in midlactation were selected and divided into three groups based on similar body weight (BW) and milk production (42.1 ± 1.2 kg and 2.16 ± 0.060 kg/goat/day, respec-tively). The experiment was conducted in an incomplete crossover design where one group of four goats was fed a mixed ration of barley grain, another group of four goats replaced barley grain with orange pulp and the last group of four goats did so with soybean hulls. Goats were fed above production level and ingredients and chemical composition of the three formulated diets are shown onTable 1. The Spanish ruminant production system [3] is based on high use of concentrate (40 to 70%), with mixed diets instead of whole forage rations. The total amount of feed offered was 2.4 kg per goat and day, as fed. Goats were fed mixed diets with 800 g of alfalfa hay per day and 1600 g of concentrate per goat and day (forage and concentrate
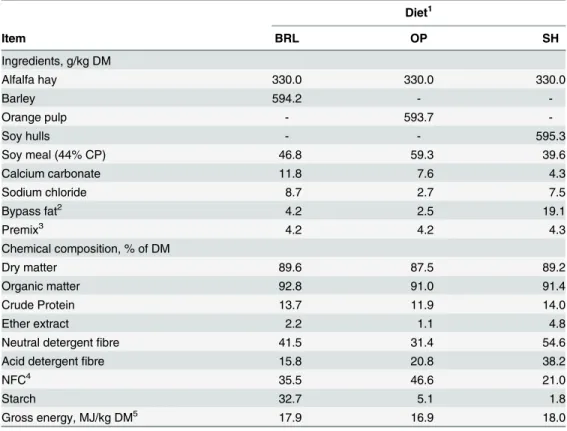
Table 1. Ingredients and chemical composition of the diets.
Diet1
Item BRL OP SH
Ingredients, g/kg DM
Alfalfa hay 330.0 330.0 330.0
Barley 594.2 -
-Orange pulp - 593.7
-Soy hulls - - 595.3
Soy meal (44% CP) 46.8 59.3 39.6
Calcium carbonate 11.8 7.6 4.3
Sodium chloride 8.7 2.7 7.5
Bypass fat2 4.2 2.5 19.1
Premix3 4.2 4.2 4.3
Chemical composition, % of DM
Dry matter 89.6 87.5 89.2
Organic matter 92.8 91.0 91.4
Crude Protein 13.7 11.9 14.0
Ether extract 2.2 1.1 4.8
Neutral detergentfibre 41.5 31.4 54.6
Acid detergentfibre 15.8 20.8 38.2
NFC4 35.5 46.6 21.0
Starch 32.7 5.1 1.8
Gross energy, MJ/kg DM5 17.9 16.9 18.0
1BRL = barley; OP = orange pulp; SH = soybean hulls.
2Bypass fat of palm fatty acid distillate. Provided by Norel Animal Nutrition, Norel S.A., Spain.
3Provided by NACOOP S.A., Spain. Premix composition (ppm or UI per kilogram of premix): Se, 40; I, 250;
Co, 80; Cu, 3000; Fe, 6000; Zn, 23400; Mn, 29000; S, 60000; Mg, 60000; vitamin A, 2000000 UI; vitamin D3, 400000; vitamin E, 2000 ppm; nicotinic acid, 10000; choline, 20300.
4NFC = non
fibrous carbohydrate content: 100-(NDF+ash+CP+EE).
5DM = dry matter.
ratio = 33/67). The concentrate was mixed and pelleted along with the premix. One group was fed concentrate with 670 g/kg DM of barley (BRL diet). The other two groups substituted bar-ley grain with by-products: dry orange pulp (OP diet) and soybean hulls (SH diet). Require-ments of the goats were obtained using the recommended values of [8,3]. Diets were supplemented with a salt vitamin-mineral premix and water was freely available at all times.
Chemical composition shown inTable 1is whole mixed ration (forage and pelleted
concen-trate). In order to achieve isoenergetic diets, bypass fat was added. The mean gross energy (GE) of the three diets was 18 MJ/kg DM. Mixed diets contained similar amounts of CP (13%, on DM basis). All goats were housed in a building in which the environment was partially con-trolled (HOBO; BoxCarPro3 software).
Experimental schedule and measurements
Apparent total tract digestibility, gas exchange, energy partitioning, C and N balance, oxidation of nutrients and milk performance were determined. Before moving the animals from group compartments to pens, the 12 goats selected were split into three groups of 4 goats for 15 days. Prior to each experimental period, the animals were adapted to the diet, environmental condi-tions of the metabolic cages and head hood by housing them individually for short periods of 20 minutes for 15 days. Then, goats were moved to individual pens for 7 days and during this time they were not moved periodically to the metabolic cages, feeding only on the experimental diets. The experiment was conducted as a crossover design with 12 lactating dairy goats kept in 3 groups and fed 3 dietary treatments in two periods; period one (7 days of adaptation to meta-bolic cages + 7 days of digestibility + 12 days of respirometry) and period two (10 days of diet adaptation + 5 days digestibility + 12 days respirometry). To this end, they were allocated to
individual metabolism cages at thermoneutrality (20–23°C determined by a Hobo probe,
ONSET data loggers, Cape Cod, MA, USA). The animal was not attached to the metabolic cage, as the lateral cage structure is adjustable, so goats could stand or lie down freely. Next, data on the feed offered and refused and the total faecal, urine and milk output were recorded daily for each goat over a 5-day period, as well as BW at the beginning and end of the period. Faeces were collected in wire-screen baskets placed under the floor of the metabolism crates and urine was collected through a funnel into plastic buckets containing 100 mL 10% (vol/vol) of H2SO4to acidify the urine of each goat. The acidification of urine was necessary to prevent
microbial degradation and the loss of volatile ammonia-N (NH3-N). Representative samples
There is renewed interest in the measurement of energy metabolism based on open-circuit respirometry as an oblique consequence of the drive to reduce livestock greenhouse emissions. Open-circuit respirometry is an indirect calorimetry method that consists of measuring the gas exchange associated with the oxidation of energy substrates and determining the associated heat production. Thus, gas exchange was measured for each goat for 24 h in continuous by an indirect calorimetric system based on a ventilated head-box designed for small ruminants. To this end, 12 days were taken for each period (6 goats and 2 treatments), as we only have one indirect calorimetry unit. The respirometry system has a head hood, a flow meter (Thermal Mass Flowmeter Sensyflow VT-S, ABB, Alzenau, Germany) and air suction provided by a cen-trifugal fan (CST60 Soler Palau Inc., Parets del Vallès, Barcelona, Spain). The head hood was suspended on the front structure of the metabolic cage by two hooks placed on its rear side. The hood had a transparent acrylic window at the front and a drawer with a pulling handle to open and place the animal food and water in a bucket. The drawer was locked by two lateral locks situated on its front side and the main body of the head hood. A foam tape was placed on the edge of the drawer for an adequate seal. An opening (200 mm long × 520 mm high) in the rear panel of the hood was set up with a tightly woven nylon curtain (funnel shape) with a hole in the middle for the animal’s neck, fixed by four bolted platens and glued all around the open-ing edge. It was equipped with a nylon drawstropen-ing through a fold edge to fit and tie it around the neck to avoid gas leaking. During respirometry, the animal was attached to the front struc-ture of the metabolic cage by a necklace and chain so that it could freely stand or lie down. Atmospheric air entered the head hood through an orifice (internal diameter 20 mm) made on its top on the opposite side of the main air suction line. The methane (CH4) and carbon dioxide (CO2) concentration were measured using the infrared principle and oxygen (O2) was mea-sured by the paramagnetic principle (Easyflow Gas Analyzer, model 3020, ABB, Alzenau, Ger-many). Although the unit was an autocalibrated model, the analysers were calibrated with reference gases before each test. [9,10] described the mobile open-circuit respirometry system used for these measurements.
The whole system was calibrated by injecting pure N2and CO2into the head box [11],
determined gravimetrically using a precision scale (MOBBA mini-SP 0.2–30 kg, Industrial
Weighing System, Barcelona, Spain). Calibration factors were calculated according to [12]. The CH4and CO2production and O2consumption were calculated as described by [13]. An initial atmospheric air sample was collected and the gas concentrations were used as reference for calculations.
Ultimate CH
4yield (B
0)
All faecal samples were pooled (500 g) by type of diet and stored at 4°C. The ultimate CH4 yield (B0) was assessed after incubating the faeces for a standard period of 90 days at 38°C. Five replicates were incubated for each treatment. Faeces (11 g) were introduced in 250 mL Pyrex glass bottles applying 1.6:1 sample to headspace ratio [14]. In parallel, bottles with faecal sam-ples and sodium benzoate (17.5 mL) were incubated to check the likely inhibition of the metha-nogenesis [15]. Digested sewage sludge (17.5 mL) was also added as inoculum to all bottles. Distilled water and the inoculum were incubated as blanks. The bottles were capped with a thick rubber septum and the headspace was flushed with pure N2to prevent O2inhibition.
Bio-gas production was monitored every 2–3 days by pressure measurement using a Delta Ohm
manometer HD 9220 (absolute pressure meter 0–2,000 mbar ± 0.8%). Gas samples (5 mL)
were collected from the headspace and inserted into a GC vial (9 mL). Samples were afterwards
diluted with 10 mL N2. Biogas concentration was analysed by GC (GC-7890A, Agilent
experimental period. ISO standard methodology (11734:1999) was selected to estimate the B0.
The net C mass (mh) and CH4mass (mCH4) required by the ISO methodology were calculated
after pressure measurements and CH4analyses, respectively. The ultimate CH4yield value was
calculated as follows:
B0¼ mCH4
16;000
12;000
0:67x10 6
1000jOrganic Matter incubated
Chemical analysis
Feed, feed refusal and faeces samples were first dried in a forced air oven at 55°C for 48 h, then ground to pass a 1 mm screen before analysis. Urine and milk were dried by lyophilization. Chemical analyses of the diet, refusals and faeces were conducted according to [16] for DM, ash and ether extract (EE). The DM of diets and faeces was determined by oven-drying at 102 ± 2°C for 24 h. Ash concentration was measured by incineration in an electric muffle fur-nace at 550°C for 6 h to determine OM. The EE was extracted with petroleum ether after acid hydrolysis to recover saponified fat (Soxtec System HT Tecator, Hillerød, Denmark; 1047 Hydrolyzing Unit and 1043 Extraction Unit). The NDF and ADF were measured in an ANKOM Fiber Analyzer (A220, ANKOM Technologies, Fairport, NY, USA) according to [17,16], respectively. The NDF was determined using sodium sulphite and alpha amylase. Lig-nin was determined according to [18]. The NFC content of diets was calculated by difference
method based on chemical analysis of individual feeds according to [19]: NFC = 100−NDF
−ash−CP−EE. The GE content of the dried samples (feed, faeces, urine and milk) was analysed by combustion in an adiabatic bomb calorimeter (Gallenkamp Autobomb; Loughborough,
UK). Starch content was determined by enzymatic method (α-amylase obtained from
Sigma-Aldrich, Steinheim, Germany) according to [20]. The C and N were analysed by the Dumas
principle (TruSpec CN; LECO Corporation, St. Joseph, MI, USA). Multiplying N by a factor of 6.25 converted the results to CP.
Milk composition (fat, protein, lactose, citrate and total milk solids content) was analysed with an infrared analyser (MilkoScan FT120 Foss Electric, Hillerød, Denmark). Fatty acid (FA) methyl esters of total milk lipids were prepared directly as previously described [21]. FA methyl esters were analysed in a Focus Gas Chromatograph (Thermo, Milan, Italy) equipped with a split/splitless injector and a flame ionization detector. Separation of methyl esters was
per-formed in a fused silica capillary column SP™2560 (Supelco, PA, USA) (100 m x 0.25 mm x
0.2μm film thickness). The carrier gas was Helium at a linear velocity of 20 cm/sec. The
sam-ples were injected with a split ratio of 1/100. The initial oven temperature was set at 140°C held for 5 min and increased to 240 at 4°C/min and finally maintained at that temperature for 30 min. Both detector and injector temperatures were set at 260°C.
A subset of milk samples was collected and analysed for milk urea. Urea and total protein were analysed in urine. In plasma glucose, non-esterified fatty acids (NEFA), ß-hydroxybuty-rate (BHBA), ketone bodies and triglycerides were also analysed. All these samples were sent to a diagnostic lab (Laboratorio de Diagnóstico General, Comte Borrell, 08015 Barcelona, Spain) for determinations.
The NH3-N content of ruminal fluid samples and faeces were analysed by the Kjeldahl
pro-cedure (2300 Kjeltec Analyzer Unit Foss Tecator, Hillerød, Denmark). Determination of
rumi-nal VFA was based on the method described by [22] using a gas chromatograph (Fisons 8000
Calculations
The ME intake (MEI) was calculated as the difference between GE intake and energy losses in faeces, urine and CH4(with an energy equivalent value of 39.5 kJ/L CH4) [23].
Quantitative measurements of gas exchange in respiration units have been used in indirect calorimetry to estimate the heat production in animals. Open-circuit respirometry is an indi-rect calorimetry method that consists of measuring the gas exchange associated with the oxida-tion of energy substrates and determining the associated heat producoxida-tion (HP). Brouwer [23] developed the equations for calculation of HP and net oxidation of protein, carbohydrate and fat in animals based on the respiratory quotient from measurements of gas exchange and
nitro-gen excretion in urine. The HP was determined from measurements of O2consumption, CO2
and CH4production, and urine N (Nurine), using the equation of [23]:
HPðkJÞ ¼16:18O2þ5:02CO2 2:17CH4 5:99N
urine
where gases were expressed in litres per day and Nurinein grams per day. The body tissue energy (TEbody) was calculated as MEI—HP—milk energy (Emilk). The energy associated with oxidation of protein (OXP), carbohydrate (OXCHO) and fat (OXF) was calculated by the method of [24,25] for ruminants. The CO2production from oxidation (CO2x) was calculated as CO2−(CO2/CH4× CH4), according to [26]. The calculations were carried out as follows:
OXP¼6:25N
urine18:42ðkJ=gÞ
OXCHO¼ ð 2:968O
2þ4:174CO2x 2:446NurineÞ 17:58ðkJ=gÞ
OXF¼ ð1:719O
2 1:719CO2x 1:963NurineÞ 39:76ðkJ=gÞ
Thus, the HP from oxidation (HPx) was:
HPxðkJÞ ¼16:18O2þ5:02CO2x 5:99Nurine
Again, gases were expressed in litres per day and Nurinein grams per day. Heat of fermenta-tion (HPf) was estimated subtracting HP from HPx. This method is termed the respirafermenta-tion quotient method (RQ) because it is based on determination of the respiratory quotient:
RQ¼ ðlitres CO2jlitres O2Þ
The non-protein respiratory quotient from oxidation of nutrients (RQnpx) was determined as:
RQnpx¼ ðCO2x ðNurine6:250:774ÞÞjðO2 ðNurine6:250:957ÞÞ
Efficiency of use of ME for lactation was calculated according to [8]. Energy lost from the body, indicating mobilization of body fat reserves in support of milk secretion, was assumed to be used for milk synthesis with an efficiency of 0.84 and the concomitant energy storage during lactation was taken to be 0.95 times the milk secretion efficiency. Consequently, the corrected milk energy was estimated as Emilk+ (0.84 x negative energy retention) + (1.05 x positive energy retention). The efficiency of use of ME for milk production (kl) was calculated as
cor-rected milk energy divided by ME minus MEm), with MEm being the metabolizable energy for
maintenance, which was obtained from [8] for goats (481 kJ/kg of BW0.75).
and milk. The C balance gave the total amount of C retained in the body and the amount of C retained in fat was calculated by subtracting the amount of C retained in protein determined by the N balance. Assuming an energy equivalent of 39.76 kJ/g and a content of 0.767 C for fat, and 23.86 kJ/g and 0.16 N and 0.52 C for protein, the energy retained (kJ) in protein (TEprotein) and fat (TEfat) was calculated, respectively, as:
TEprotein¼N balanceðgÞ 6:2523:86
and
TEfat¼ ðCbalanceðgÞ NbalanceðgÞ6:250:52Þ 1:30439:76
Statistical analysis
The effects of starch on intake, digestibility, metabolic energy as well as C and N balance were
analysed using the mixed model (proc MIXED) from [27]. The model for the dependent
vari-ables included the fixed effect of diet and period with goat as random effect. The following sta-tistical model was used:
Y¼mþDþTþgoatþDxTþε
where Y is the dependent variable,μis the overall mean, D and T are thefixed effects of diet
and period of time, DxT their interaction, goat is the random effect of goat andεis the random
error. Least square means are reported throughout and differences were considered significant at P<0.05.
Results and Discussion
Most of the variables showed no significant effect for period of time in the crossover design, so the discussion was focused on the effect of diet.
Feed Intake, digestibility and rumen fermentation
Rumen fermentation parameters obtained are displayed inTable 3. It was not possible to assess the effect of period and interaction with diet because rumen liquid extraction was done only during the second period of the trial. Lower pH values were found in OP and SH than BRL (7.1vs. 7.3, respectively). The greater values of pH found were probably associated with
Table 2. Body weight, intake, and apparent digestibility coefficients of Murciano-Granadina goats (n = 12) during midlactation by type of diet and period.
Diet2 Period3 P-Value
Item1 BRL OP SH 1 2 SEM4 Diet Period Diet x Period
BW, kg 42.4 42.3 41.6 42.2 42.2 0.95 0.949 0.786 0.505
DMI, kg/d 2.0 2.0 2.1 2.0 2.0 0.02 0.248 0.259 0.244
Digestibility, % of DM
DM 71.6a 73.5a 64.0b 70.3 69.7 0.93 0.001 0.579 0.871
OM 74.5b 77.5a 66.6c 73.4 72.9 1.00 0.001 0.554 0.927
CP 65.6a 56.4b 59.3ab 60.9 61.8 1.29 0.006 0.605 0.717
EE 74.2a 34.0b 71.1a 60.0 64.8 4.36 0.000 0.365 0.568
NDF 64.0 61.4 60.8 63.6 61.2 0.75 0.145 0.117 0.509
ADF 47.9c 65.6a 58.7b 55.6 55.7 1.78 0.001 0.964 0.920
Starch 99.4a 98.2b 91.9c 97.0 97.0 0.70 0.001 0.886 0.041
GE 73.4a 73.4a 67.2b 70.3 73.1 0.89 0.001 0.021 0.238
a,b,cMeans within a row with different superscripts differ (P<0.05).
1BW = body weight; BW0.75= metabolic body weight; DMI = dry matter intake; DM = dry matter; OM = organic matter; CP = crude protein; EE = ether
extract; NDF = neutral detergentfibre; ADF = acid detergentfibre; GE = gross energy.
2BRL = barley; OP = orange pulp; SH = soybean hulls. 31 =
first period; 2 = second period.
4SEM = standard error of the mean.
doi:10.1371/journal.pone.0151215.t002
Table 3. pH, ammonia-N (NH3-N), and VFA of Murciano-Granadina goats (n = 12) during midlactation by diet type.
Diet2 P-Value
Item1 BRL OP SH SEM3 Diet
pH 7.30a 7.10b 7.10b 0.041 0.031
NH3-N, mg/dL 15.08b 52.30a 38.33a 7.405 0.039
Total VFA, mM 14.16c 25.97a 23.94b 3.289 0.016
Individual VFA, mol/100 mol
Acetic acid, C2:0 62.22a 56.98b 61.48a 1.435 0.031
Propionic acid, C3:0 13.42 14.98 15.90 0.624 0.293
Isobutyric acid, C4:0iso 3.86 2.87 3.19 0.362 0.591
Butyric acid, C4:0 14.39b 19.54a 13.09b 1.389 0.023
Isovaleric acid, C5:0iso 4.34 3.81 3.74 0.422 0.859
N-Valeric acid, C5:0 1.78 1.70 1.74 0.147 0.980
N-Caproic acid, C6:0 0.00b 0.12b 0.62a 0.103 0.004
Heptanoic acid, C7:0 0.00b 0.00b 0.23a 0.056 0.004
a,b,cMeans within a row with different superscripts differ (P<0.05). 1NH
3-N = ammonia nitrogen; C = carbon; N = nitrogen. 2BRL = barley; OP = orange pulp; SH = soybean hulls. 3SEM = standard error of the mean.
the contact of rumen liquid with saliva when the oesophageal tube was removed during sam-pling. An increase (P<0.05) in acetic acid (C2:0) in the rumen when goats were fed the higher
NDF diets was observed (62.22 and 61.48vs. 56.98 mol/100 mol for diet BRL, SH and OP,
respectively). Butyric acid (C4:0) was higher (P<0.05) in OP diet compared to other diets and
the highest numerical value of NH3-N was found in OP diet (52.3 mg/dL). The N-caproic acid
(C6:0) and heptanoic acid (C7:0) showed significant (P<0.05) differences between SH diet
and OP or BRL diet. Goats fed fibrous by-products (OP and SH diets) had greater NH3-N than
BRL (45.32 mg/dL for OP and SH on averagevs. 15.08 mg/dL for BRL diet). Therefore, in our
study the diet has the same source of protein (soybean meal) and different types of carbohy-drate (starch, digestible and indigestible fibre), so the greater NH3-N found in fibrous diets (OP and SH) seems indicative of their inefficient use for ruminal proteosynthesis [28]; OP diet has a lower level of CP (12% on DM basis) than BRL and SH (14%, on DM basis and average), and SH the greatest content of EE (4.8%vs. 1.8% on DM basis for SH and others, respectively).
Energy balance
The average values obtained for the calibration factor for the indirect calorimetry system, by
releasing a known volume of N2or CO2into the respirometry system, were 1.0067 ± 0.00119
and 0.9979 ± 0.00823 for O2and CO2, respectively.
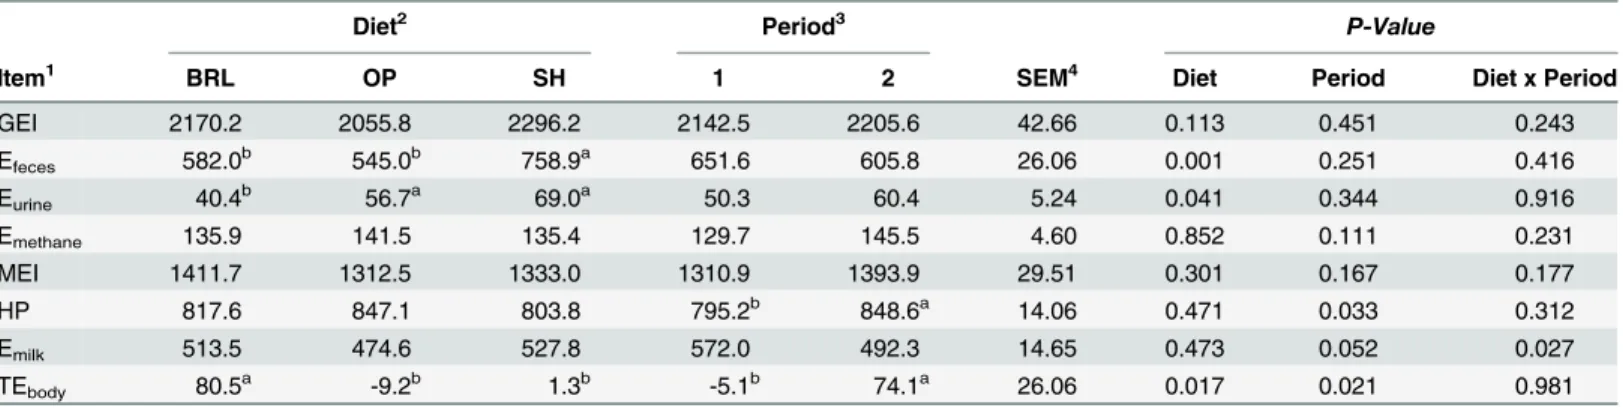
Daily energy balance obtained with the three diets is shown inTable 4. Period of time only affected HP (being greater during the second period) and body energy retention (being nega-tive in the first period and posinega-tive in the second period). These differences were in agreement with the physiology of dairy animals [29], where reserves mobilization took place close to peak lactation and was subsequently recovered.
Regarding the effect of the diet, no significant differences were observed for GE intake (2174.1 kJ/ kg of BW0.75, on average) and significantly higher (P<0.05) energy losses in faeces (Efeces) were found for SH diet than the BRL or OP diets, possibly due to the higher level of fat in the SH diet (4.8vs. 1.7% for SH and others, respectively). The OP and SH diets presented similar energy losses in urine (62.9 kJ/kg of BW0.75, on average) and were significantly higher (P<0.001) than BRL (40.4 kJ/kg of BW0.75), indicating that increasing the amount of NH3-N in rumen liquid augmented the energy losses in urine. The CH4energy losses were not different among treatments. No differences were observed in MEI, with average values of 1352.4 kJ/ kg of BW0.75. A significant effect of period of time (P<0.05) was observed in HP, with the highest values for the second one (848.6 kJ/ kg of BW0.75vs. 795.2 kJ/ kg of BW0.75, respectively). No statistically significant differences were observed in Emilk. The TEbodywas significantly affected (P<0.05) for the diet and period of time. Positive energy balance (80.5 kJ/ kg of BW0.75) was found for the starchy diet (BRL), around zero (1.3 kJ/ kg of BW0.75) in diet greater in NDF (SH) and negative energy balance (-9.2 kJ/ kg of BW0.75) in diet rich in digestible fibre (OP). Analysing the period of time, almost zero energy balance (-5.1 kJ/ kg of BW0.75) was found in the first period and positive balance (74.1 kJ/ kg of BW0.75) in the second period (P<0.05).
The efficiency of use of ME for milk production (kl), according to [8], was calculated as
Emilkoutput adjusted to zero energy balance divided by ME-MEm, and MEm was obtained
Oxidation of nutrients
CO2production is derived from nutrient oxidation and rumen fermentation. The separation
between these two components is necessary to calculate the substrate oxidation in ruminants and determine the proportion of substrate oxidation supporting the total HP associated with oxidative processes. The proportional contribution to HPx due to oxidation of nutrients is shown inTable 5. No effect of interaction between diet and period was observed. Diet had no significant effect on HPx (789 kJ/kg of BW0.75, on average). The significant (P<0.05) effect of period of time was higher during the second period than the first one for HPx and OXP. A sig-nificant effect of diet (P<0.05) was observed in HPf and OXF, being higher for SH than the other two diets. The more fibrous diets (higher NDF in SH diet) were accompanied by greater HPf than starch (BRL) or digestible fibre (OP) diets. The OXCHO was higher in BRL diet than others, possibly associated with the greater amount of starch in the BRL diet than in OP and SH.
Therefore, the heat from OXP contributed approximately 7.2% of HPx on average for three treatments. The BRL diet oxidized 59.2% of nutrients as OXCHO and only 33.7% as OXF. However, nutrient oxidation as OXF increased significantly (P<0.05) to 76.6% in SH, and
nutrient oxidation as OXCHO decreased significantly (P<0.05) to 14.6%. The higher amount
of NFC in OP diet promotes the higher OXCHO compared to SH diet. Nevertheless, OP diet presented intermediate values compared to the other two diets; OXCHO and OXF were 45% and 49.2%, respectively. Few studies relating to oxidation of nutrients are available for rumi-nants. In the study of [32] in goats during midlactation, the corn grain in the total mixed diets was replaced with a blend of fibrous by-product such as soy hulls and corn gluten feed. In that trial, no differences were observed between diets for OXCHO and OXF (55% and 29% on aver-age, respectively). Hence, similar OXCHO to that in our study was obtained, but OXF was lower than in our trial. So, we expect similar OXF in our SH diet to that in the blend of fibrous by-products from [32]. These latter authors added almost 4% of fat to the fibrous diet, which may have affected fibre fermentation [33]. Other studies in calves [25] with positive retained
Table 4. Daily energy partitioning (kJ/kg of BW0.75) of Murciano-Granadina goats (n = 12) during midlactation by type of diet and period.
Diet2 Period3 P-Value
Item1 BRL OP SH 1 2 SEM4 Diet Period Diet x Period
GEI 2170.2 2055.8 2296.2 2142.5 2205.6 42.66 0.113 0.451 0.243
Efeces 582.0b 545.0b 758.9a 651.6 605.8 26.06 0.001 0.251 0.416
Eurine 40.4b 56.7a 69.0a 50.3 60.4 5.24 0.041 0.344 0.916
Emethane 135.9 141.5 135.4 129.7 145.5 4.60 0.852 0.111 0.231
MEI 1411.7 1312.5 1333.0 1310.9 1393.9 29.51 0.301 0.167 0.177
HP 817.6 847.1 803.8 795.2b 848.6a 14.06 0.471 0.033 0.312
Emilk 513.5 474.6 527.8 572.0 492.3 14.65 0.473 0.052 0.027
TEbody 80.5a -9.2b 1.3b -5.1b 74.1a 26.06 0.017 0.021 0.981
a,bMeans within a row with different superscripts differ (P<0.05). 1GEI = gross energy intake; E
feces= energy losses in faeces; Eurine= energy losses in urine; Emethane= energy losses in methane; MEI = metabolizable
energy intake; HP = heat production; REtotal= total recovered energy; REmilk= recovered energy in milk; REbody= recovered energy in tissue
(TEbody = MEI−HP−Emilk).
2BRL = barley; OP = orange pulp; SH = soybean hulls. 31 =
first period; 2 = second period.
4SEM = standard error of the mean.
energy as fat pointed out that part of the OXF should originate from ingested carbohydrate, mainly fibre. Significant difference (P<0.05) was observed for RQnpx, being significantly lower for SH (0.76) than OP (0.84), both of which were lower than BRL (0.89). As stated by
[25], RQnpx lower than 1 indicates predominance of OXFvs. OXCHO, as we found in our
study with the OP and SH diets.
Carbon and nitrogen balance
The daily C and N balance and the calculated tissue recovered as protein and fat are displayed inTable 6. No effect of interaction between diet and period was observed, with the exception of C in milk. Although the interaction was significant, the effect of diet or period of time was not significant for C in milk and the effect of diet on milk chemical composition was not significant (Table 7). More significant differences were found for the excretion of C in faeces in SH diet (19.8 g/ kg of BW0.75) than in the others (14.35 g/ kg of BW0.75on average), associated with the
greater content in fat that was not absorbed, as mentioned above. The C in CO2expired was
also statistically different for both time periods: 22.5 g/ kg of BW0.75in the second period of the trial and 20.8 g/ kg of BW0.75during the first. The C secreted into the milk was not significantly affected by treatment. The C retained was significantly affected (P<0.05) for the effect of diet and period of time.
Goats in all three groups ingested similar amounts of N (2.63 g/kg of BW0.75, on average) and no differences were found in excreted N (1.03 g/kg of BW0.75, on average). The N losses in
urine were greater for SH treatment (0.6 g/kg of BW0.75) when compared to BRL and OP (0.45
g/kg of BW0.75, on average). The N secreted into the milk was not affected by treatment (0.77 g/kg of BW0.75, on average). The N balance was different (P<0.05) between OP and the other two diets. The N balance was positive for all treatments. Although some authors [34] indicate
Table 5. Heat production (kJ/kg of BW0.75) from oxidation and fermentation; daily oxidation (kJ/kg of BW0.75) of protein, carbohydrate, and fat and their contribution to the heat production from oxidation substrates (%) of Murciano-Granadina goats (n = 12) during midlactation by type of diet and period.
Diet2 Period3 P-Value
Item1 BRL OP SH 1 2 SEM4 Diet Period Diet x Period
HPx 795.7 811.7 759.7 765.6 815.0 13.47 0.458 0.033 0.329
HPf 21.9c 35.4b 44.1a 29.7 33.6 2.32 0.000 0.268 0.442
OXP 56.0 47.5 66.4 49.1b 63.9a 3.45 0.083 0.014 0.489
OXCHO 471.9a 363.0b 115.6c 329.0 361.0 35.65 0.001 0.123 0.219
OXF 267.7c 401.1b 577.5a 387.3 389.9 33.23 0.001 0.505 0.148
OXP/HPx 7.1 5.8 8.8 6.4 7.9 0.44 0.056 0.054 0.733
OXCHO/HPx 59.2a 45.0b 14.6c 42.1 44.3 4.28 0.001 0.266 0.178
OXF/HPx 33.7c 49.2b 76.6a 51.5 47.8 4.40 0.001 0.175 0.186
RQnpx 0.89a 0.84b 0.76c 0.82 0.84 0.01 0.001 0.191 0.142
a,b,cMeans within a row with different superscripts differ (P<0.05).
1HPx = heat production from oxidation of nutrients; HPf = heat production of fermentation [HPf = HP
−HPx (Brouwer, 1958)]; OXP = heat production associated with the oxidation of protein; OXCHO = heat production associated with the oxidation of carbohydrates; OXF = heat production associated with the oxidation of fat; RQnpx = non-protein respiratory quotient (unitless) from oxidation of nutrients {[CO2x−(Nurine× 6.25 × 0.774)]/[O2−
(Nurine × 6.25 × 0.957)], where CO2= CO2production from oxidation and Nurine = N in urine}. 2BRL = barley; OP = orange pulp; SH = soybean hulls.
31 =
first period; 2 = second period.
4SEM = standard error of the mean.
reduction in urinary N output when ME intake increase, in our study we did not find any differences.
The values of C and N retained in the body were converted to tissue energy recovered as protein or fat, and differences (P<0.05) were found. The TEproteinwas 64, 28.3 and 50 kJ/kg of BW0.75for BRL, OP and SH, respectively. Regarding TEfat, the OP and SH diets showed greater
Table 6. Carbon and nitrogen balance (g/kg of BW0.75) of Murciano-Granadina goats (n = 12) during midlactation by type of diet and period.
Diet2 Period3 P-Value
Item1 BRL OP SH 1 2 SEM4 Diet Period Diet x Period
Cintake 52.4 50.1 56.1 52.0 53.2 1.04 0.103 0.446 0.242
Cfeces 15.0b 13.7b 19.8a 15.7 16.3 0.70 0.001 0.369 0.555
Curine 1.3b 1.6b 1.8b 1.5 1.5 0.09 0.045 0.728 0.427
CCO2 21.5 22.6 21.1 20.8b 22.5a 0.44 0.366 0.026 0.244
CCH4 1.8 1.9 1.8 1.8 1.9 0.08 0.851 0.111 0.231
Cmilk 11.1 10.5 11.4 11.6 10.4 0.30 0.408 0.089 0.027
Cretained body 1.8a 0.2b -0.2c 1.1a 0.5b 0.51 0.026 0.045 0.701
Nintake 2.7 2.3 2.9 2.6 2.6 0.06 0.003 0.460 0.238
Nfeces 0.9 1.0 1.2 1.0 1.0 0.04 0.075 0.978 0.870
Nurine 0.5b 0.4b 0.6a 0.4b 0.6a 0.03 0.043 0.014 0.498
Nmilk 0.8 0.7 0.8 0.8 0.8 0.02 0.044 0.248 0.075
Nretained body 0.4a 0.2b 0.3a 0.4 0.3 0.04 0.043 0.145 0.196
TEprotein, kJ/kg of BW0.75 64.0a 28.3c 50.0b 58.5 42.2 11.52 0.023 0.238 0.552
TEfat, kJ/kg of BW0.75 19.2a -40.6b -45.0b -9.3b -20.0a 10.56 0.045 0.048 0.506
a,b,cMeans within a row with different superscripts differ (P<0.05). 1C
intake= C intake; Cfeces= C losses in faeces; Curine= C losses in urine; CCO2= C losses in CO2; CCH4= C losses in methane; Cmilk= recovered C in
milk; Cretained body= recovered C in tissue; Nintake= N intake; Nfeces= N losses in faeces; Nurine= N losses in urine; Nmilk= recovered N in milk; Nretained
body= recovered N in tissue.
2BRL = barley; OP = orange pulp; SH = soybean hulls. 31 =
first period; 2 = second period.
4SEM = standard error of the mean.
doi:10.1371/journal.pone.0151215.t006
Table 7. Daily milk production and composition of Murciano-Granadina goats (n = 12) during midlactation by type of diet and period.
Diet1 Period2 P-Value
Item BRL OP SH 1 2 SEM3 Diet Period Diet x Period
Milk yield, kg/goat/day 2.29 2.01 2.17 2.38a 1.93b 0.081 0.247 0.004 0.612
Composition, %
DM4 14.7 15.7 15.4 14.5b 16.0a 0.28 0.296 0.010 0.553
Fat 5.4 6.3 6.4 5.7 6.3 0.21 0.073 0.121 0.602
Protein 4.0 3.7 3.7 3.3b 4.2a 0.13 0.544 0.001 0.226
Lactose 4.6 4.7 4.5 4.6 4.6 0.05 0.613 0.906 0.220
a,bMeans within a row with different superscripts differ (P<0.05). 1BRL = barley; OP = orange pulp; SH = soybean hulls.
21 =
first period; 2 = second period.
3SEM = standard error of the mean. 4DM = dry matter.
(P<0.05) fat mobilization (-42.82 kJ/kg of BW0.75, on average) than BRL (19.2 kJ/kg of BW0.75), as mentioned above (Table 4).
Milk production and fatty acids
Table 7reports milk yield and chemical composition of the goats during the experiment. Sig-nificant (P<0.05) and higher milk yield were found for the first period (2.38vs. 1.93 kg/d for first and second period, respectively). Milk dry matter and protein content were statistically different (P<0.05) between the two periods, with greater values for the second period than for the first (14.5vs. 16% for dry matter and 3.3 and 4.2% for protein content). The first period of time is closer to post-partum, which is when lower milk chemical composition and higher milk production are observed in dairy ruminants [30]. No effect of interaction between diet and period was observed. Diet had no effect on milk yield (average milk yield was 2.16 kg/d), dry matter, fat, protein and lactose (15.25%, 6.0%, 3.75% and 4.6% on average, respectively). Although increased milk fat content is common when dietary fibre concentrations rise at the expense of starch [35], no differences were found in our study.
Effect of diet on the fatty acid profile of milk fat is shown inTable 8. No effect of diet was observed in fatty acids with 4 to 15 carbon atoms. However, there were significant differences between diets in most of the other fatty acids. The fatty acids with 16 or fewer carbon atoms
derive fromde novosynthesis, whereas those with 18 or more carbon atoms come from the
diet or from lipid mobilization [35]. Significant differences (P<0.05) were observed for pal-mitic acid (C16:0) and cis-10-heptadecenoic acid (C17:1), being significantly higher for OP diet than BRL diet, and SH diet did not differ from the other two diets. Pentadecanoic acid (C15:0) and heptadecanoic acid (C17:0) are potential biomarkers of rumen function, as they are found in rumen bacterial lipids and might be partially synthesized endogenously from rumen substrates in the mammary gland [36,37,38]. The differences (P<0.05) found between treatments (lower content of pentadecanoic acid (C15:0) in the milk of OP and SH goats than BRL) suggest a negative impact of these diets on rumen bacterial metabolism and fermentative activity. Our ammonia-N results found in rumen liquid are in accordance with the differences observed in these fatty acids. Moreover, a greater amount (P<0.05) of hepta-decanoic acid (C17:0) in milk fat from OP and SH diets probably reflects a larger contribution of mobilized fat [37], as we observed inTable 6; -42.82 kJ TEfat/kg of BW0.75in OP and SH diet on average against 19.2 kJ TEfat/kg of BW0.75in BRL. Authors [36] suggest that the amount of starch in the diet is an important factor determining high milk elaidic acid
Methane emission
Table 9shows enteric CH4emissions from goats. The average CH4emission from the goats’ digestive tracts (enteric fermentation) was similar between diets and averaged at 57.4 L/goat per day. Methane conversion ratio, also designated Ym factor, represents energy loss as CH4 per unit of GE intake. No differences were observed and the average Ym value was 6.4. Accord-ing to [4,41], fermentation of fibrous carbohydrates produces more CH4than fermentation of
soluble sugars, which in turn produce more CH4than fermentation of starch. The similar CH4
production that we found in this work can be explained by the fact that the greater NH3-N
Table 8. Fatty acid composition (g/100 g of identified fatty acids) of milk fat for goats (n = 12) fed the experimental diets.
Diet2 P-Value
Item1 BRL OP SH SEM3
Butyric Acid, C4:0 0.30 0.32 0.31 0.007 0.429
Caproic Acid, C6:0 0.95 0.97 0.92 0.025 0.760
Caprylic Acid, C8:0 1.82 1.74 1.68 0.050 0.539
Capric Acid, C10:0 10.03 9.60 8.81 0.236 0.098
Undecanoic Acid, C11:0 0.37 0.32 0.29 0.022 0.321
Lauric Acid, C12:0 6.89 5.99 5.46 0.297 0.119
Myristic Acid, C14:0 13.38 13.13 11.94 0.327 0.185
Myristoleic Acid, C14:1 0.28 0.30 0.27 0.025 0.878
Pentadecanoic Acid, C15:0 0.22a 0.14b 0.15b 0.002 0.247
Palmitic Acid, C16:0 40.61b 44.53a 42.63ab 0.620 0.021
Palmitoleic Acid, C16:1 1.11 1.36 1.27 0.074 0.391
Heptadecanoic Acid, C17:0 0.59b 0.70a 0.71a 0.023 0.039
cis-10-Heptadecenoic Acid, C17:1 0.28b 0.36a 0.33ab 0.015 0.047
Stearic Acid, C18:0 4.69 3.77 4.96 0.324 0.375
Elaidic Acid, C18:1n9t 0.37a 0.32a 0.23b 0.003 0.019
Oleic Acid, C18:1n9c 13.43b 12.45b 16.70a 0.616 0.017
Vaccenic Acid, C18:1n7 0.31b 0.46a 0.41a 0.018 0.001
Linoleic Acid, C18:2n6c 3.18a 2.25b 1.95b 0.150 0.001
Arachidic Acid, C20:0 0.11b 0.10b 0.16a 0.006 0.001
gamma-Linolenic Acid, C18:3n6 0.00 0.00 0.00 0.002 0.572
cis-11-Eicosenoic Acid, C20:1 0.07a 0.03c 0.05b 0.004 0.000
Linolenic Acid, C18:3n3 0.35b 0.52a 0.34b 0.027 0.008
CLA 9c11t + 9t11c 0.47a 0.41ab 0.28b 0.027 0.006
CLA 10t12c 0.01c 0.04a 0.02b 0.003 0.001
Arachidonic Acid, C20:4n6 0.19a 0.16ab 0.13b 0.010 0.036
Medium-chain fatty acids 20.04a 18.62ab 17.16b 0.505 0.051
Monounsaturated fatty acids 15.84b 15.30b 19.25a 0.603 0.013
Polyunsaturated fatty acids 4.22a 3.38b 2.72b 0.187 0.001
Saturated fatty acids 79.94 81.32 78.02 0.586 0.106
AI 5.15 5.64 4.42 0.218 0.076
a-cMeans within a row with different superscripts differ (P<0.05).
1CLA = conjugated linoleic acid; AI = Atherogenicity index calculated as C12:0 + 4 × C14:0 + C16:0/unsaturated fatty acids (Ulbricht and Southgate,
1991).
2BRL = barley; OP = orange pulp; SH = soybean hulls. 3SEM = standard error of the mean.
found in OP diet probably cause asynchrony in rumen fermentation. Regarding the SH diet, the higher fat added (almost 5%vs. 1.7% for SH and others, respectively) probably affected fibre degradation, and this would be the reason for the greater NH3-N also found. Increasing the lipid content of the diet is acknowledged as a CH4mitigation strategy due to reduction of
methanogens [41], and the fat added probably reduced the CH4production expected in SH
diet. Significantly (P<0.05) higher g CH4/kg milk was observed in the second period of the trail. No effect of interaction between diet and period was observed. No effects of CH4emission were found when it was related to DM or OM.
Table 10shows the chemical composition of faecal samples incubated for B0determination. The use of different carbohydrate sources in BRL, OP and SH diets significantly affected the OM, CP and NDF contents of the corresponding faeces. Faeces derived from BRL and SH diets showed higher OM and fibre content than OP faeces (P<0.05). However, the fibre quality changed between BRL and SH faeces, as cellulose to hemicellulose ratio was different (P<0.05). The higher cellulose content of SH faeces was in accordance with the high cellulose
Table 9. Methane emission of Murciano-Granadina goats (n = 12) during midlactation by type of diet and period.
Diet2 Period3 P-Value
Item1 BRL OP SH 1 2 SEM4 Diet Period Diet x Period
CH4, L/d 57.0 59.6 55.5 54.6 60.0 1.98 0.761 0.166 0.608
Ym, % 6.3 6.9 5.9 6.1 6.6 0.21 0.170 0.187 0.732
CH4/DMi, g/kg 20.1 21.1 19.0 19.3 20.9 0.61 0.498 0.183 0.717
CH4/OMi, g/kg 21.7 23.1 20.7 20.9 22.7 0.67 0.467 0.177 0.715
CH4/milk, g/kg 18.3 21.4 18.4 16.2b 22.1a 0.91 0.131 0.001 0.928
a,bMeans within a row with different superscripts differ (P<0.05).
1Ym = methane energy/gross energy intake; DMi = dry matter intake; OMi = organic matter intake. 2BRL = barley; OP = orange pulp; SH = soybean hulls.
31 =
first period; 2 = second period.
4SEM = standard error of the mean.
doi:10.1371/journal.pone.0151215.t009
Table 10. Mean faeces composition (%) before incubation for B0determination by type of diet and period.
Diet2 Period3 P-Value
Item1 BRL OP SH 1 2 SEM4 Diet Period Diet x Period
DM 37.7a 38.4a 32.8b 36.7 33.5 0.83 0.047 0.052 0.419
Ash 16.6b 24.6a 15.9c 18.2 18.5 0.73 0.001 0.805 0.386
OM 83.5a 78.7b 85.0a 81.8 81.5 0.73 0.001 0.805 0.386
CP 17.1ab 18.6a 16.0b 17.7 16.9 0.44 0.004 0.312 0.766
NDF 53.2a 36.0b 52.1a 52.1 53.9 1.31 0.001 0.072 0.251
Cellulose 22.5b 16.9c 33.0a 18.1b 20.7a 1.22 0.001 0.022 0.319
Hemicellulose 22.2a 10.3b 11.5b 16.3 15.7 1.62 0.001 0.279 0.918
Lignin 8.5a 8.8a 7.6b 7.8 7.7 0.21 0.001 0.826 0.734
a,b,cMeans within a row with different superscripts differ (P<0.05).
1DM = dry matter; OM = organic matter; CP = crude protein; NDF = neutral detergent
fibre; ADF = acid detergentfibre.
2BRL = barley; OP = orange pulp; SH = soybean hulls. 31 =
first period; 2 = second period.
4SEM = standard error of the mean.
concentration of SH diet. From the different compounds of faeces, [42] concluded that lipids and proteins had the highest CH4potential, while cellulose and lignin had the lowest. More-over, [43] also showed that faecal CH4production was limited when low fermentable fibre was found in faeces. The methanogenic potential of BRL, OP and SH faeces tended to support these previous conclusions as B0values ranked according to their cellulose-lignin contents. Barley
treatment averaged 109 L CH4kg/OM, whereas mean B0for SH and CP treatments were 102
and 113 L CH4kg/OM, respectively. Nonetheless, B0values were not significantly different among BRL, OP and SH diet-derived faeces. Taking into account the lignocellulose contents of the different treatments (Table 1), a further difference would have been expected in B0values, especially between SH and OP faeces. However, the relatively high ash and lignin contents of OP faeces could have limited its methanogenic potential. The heating process associated with the drying of orange pulps could have caused that the lignin present in OP faeces had reacted with other molecules, resulting in products difficult to degrade [44]. In this sense, lignin con-centration in OM has been identified as the strongest predictor of B0[45].
All B0values were lower than the default value reported by [46] for goats (180 L CH4kg/
OM). The lower B0values allocated to BRL, OP and SH treatments were not accounted for by
either the inhibition of OM degradation or the methanogenic process. In accordance with [15], OM degradation of all treatments was above 60% compared to faecal samples incubated with sodium benzoate. The OM degradation profile, expressed as pressure (biogas) production in
Fig 1, was not different among the treatments within the first 20 days of incubation. Thereafter, OM degradability tended to decrease according to the lignocellulose contents of incubated
fae-ces. The pH values and free NH3-N contents of BRL, OP and SH samples did not reach
inhibi-tory values for methanogenesis throughout the experimental period. The pH ranged between
7.0 and 7.5 and free ammonia content was below 100 mg NH3-N/L [14]. Methane accounted
for 60% (±6.3%) of biogas produced in all treatments, similar to values reported by [47].
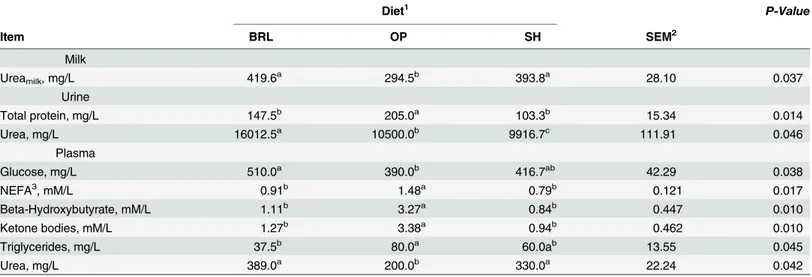
Metabolites in milk, urine and plasma
Table 11shows metabolites from goats. It was not possible to assess the effect of period and interaction with diet, as blood samples were only taken during the second period of the experi-ment. The lower NH3-N found in diet BRL was followed by higher values (P<0.05) of urea in urine, plasma urea and milk urea than the values found in OP diet, while SH diet was similar to BRL. The review of [48] reported the effect of the type of carbohydrate on rumen NH3 utiliza-tion and observed that starch and glucose rich diets resulted in lower concentrautiliza-tion of rumen ammonia, plasma urea nitrogen and milk urea nitrogen. In our study the main source of pro-tein was soybean meal for the three diets, although the (carbohydrate) energy sources for microbial protein synthesis were different. So, the type of carbohydrate affected rumen
micro-bial protein synthesis because differences in NH3-N and fat mobilization were found. The BRL
diet showed better synchrony between barley and soybean meal, as the higher rate of degrada-tion of orange pulp than soybean meal was responsible for the greatest NH3-N in the liquor content and the greater fat added to the SH diet reduced the microbial fermentation [28]. Fat
mobilization to meet energy requirements was found, thus TEfatshown inTable 6was -40.60
and -45 kJ/ kg of BW0.75for OP and SH, respectively. High rates of fat mobilization led to
markedly increased (P<0.05) plasma concentrations of NEFA, BHBA and accumulation of
Fig 1. Organic matter degradation profile expressed as pressure (biogas) production.
doi:10.1371/journal.pone.0151215.g001
Table 11. Metabolites in milk, urine and plasma of Murciano-Granadina goats (n = 12) during midlactation by type of diet and period.
Diet1 P-Value
Item BRL OP SH SEM2
Milk
Ureamilk, mg/L 419.6a 294.5b 393.8a 28.10 0.037
Urine
Total protein, mg/L 147.5b 205.0a 103.3b 15.34 0.014
Urea, mg/L 16012.5a 10500.0b 9916.7c 111.91 0.046
Plasma
Glucose, mg/L 510.0a 390.0b 416.7ab 42.29 0.038
NEFA3, mM/L 0.91b 1.48a 0.79b 0.121 0.017
Beta-Hydroxybutyrate, mM/L 1.11b 3.27a 0.84b 0.447 0.010
Ketone bodies, mM/L 1.27b 3.38a 0.94b 0.462 0.010
Triglycerides, mg/L 37.5b 80.0a 60.0ab 13.55 0.045
Urea, mg/L 389.0a 200.0b 330.0a 22.24 0.042
a,b,cMeans within a row with different superscripts differ (P<0.05). 1BRL = barley; OP = orange pulp; SH = soybean hulls.
2SEM = standard error of the mean. 3NEFA = non-esteri
fied fatty acids.
NEFA released are palmitic acid (C16:0), stearic acid (C18:0) and oleic acid (C18:1n9c), and the elevated concentrations in milk fat of those FA were identified as valuable early warning biomarkers for negative energy balance [39]. Greater (P<0.05) concentration of palmitic acid (C16:0), heptadecanoic acid (C17:0) and cis vaccenic acid (C18:1n7) were found in OP and SH than BRL, and the highest value of oleic acid was found in SH diet.
Thus, our observations of the BRL diet suggest that glucogenic nutrients stimulate body fat deposition and the partitioning of ME into body tissues and milk (most of the HPx derived from OXCHO: 59.2%). The other two diets were lipogenic, and lipogenic nutrients originate either from fibre or dietary fat, or from body reserves [49]. Fat mobilization was found in OP and SH, although greater OXF (76.6%) was found in SH than OP (49.2%). Therefore, BRL behaved as a glucogenic diet, SH as a lipogenic diet and OP as intermediate, but due to possible
asynchrony between protein degradation and type of carbohydrate, the NH3-N increased in
OP and SH and fat mobilization increased to meet energy demand and milk performance.
Conclusions
This paper provides data on energy partitioning, substrate oxidation, carbon and nitrogen bal-ances, methane emissions and milk performance in Murciano-Granadina goats during midlac-tation fed mixed diets. Replacing 59% of barley in the diet by dry orange pulp or soybean hulls did not affect milk yield (2.16 kg/d) and no effect was found for chemical composition. The higher starch diet (BRL diet) resulted in positive energy balance and higher fibrous diets showed fat mobilization. On the other hand, the difference in degradation rate between orange pulp and soybean meal (OP diet) and high fat added to the SH diet appear to have affected
ruminal fermentation, with greater NH3-N for the OP and SH diets. The OP and SH
treat-ments (lower pentadecanoic acid (C15:0) and higher heptadecanoic acid (C17:0) content in the milk of goats fed fibrous by-product) suggested a negative impact of these diets on rumen bac-terial fermentative activity and fat mobilization. Replacement of cereal grain with fibrous by-products did not increase methane emissions (57.4 L/goat per day, on average). Therefore, lac-tating goats could utilize dry orange pulp and soybean hulls diets with no detrimental effect on milk performance, although attention should be paid to fat added to the diet and the synchrony between the type of fibre and the source of protein used.
Acknowledgments
This study was supported by the Spanish National Institute for Agronomic Research (RTA2011-00107-C02) and the European Regional Development Fund (ERDF).
Author Contributions
Conceived and designed the experiments: FJE PM CF. Performed the experiments: CI PC HA PM CF. Analyzed the data: FJE PM CF. Contributed reagents/materials/analysis tools: CI PC HA CF. Wrote the paper: CI PC HA FJE PM CF.
References
1. Vasta V, Nudda A, Cannas A, Lanza M, Priolo A (2008) Alternative feed resources and their effects on the quality of meat and milk from small ruminants. Anim Feed Sci Technol 147: 223–246.
2. Grasser LA, Fadel JG, Garnett I, Depeters EJ (1995) Quantity and economic importance of nine selected by-products used in California dairy rations. J Dairy Sci 78: 962–971. PMID:7790589
4. Johnson K A, Johnson DE (1995) Methane emissions in cattle. J Anim Sci 73: 2483–2492. PMID:
8567486
5. Hellwing ALF, Weisbjerg MR, Moller HB (2014) Enteric and manure derived methane emissions and biogas yield of slurry from dairy cows fed grass silage or maize silage with and without supplementation of rapeseed. Livest Sci 165: 189–199.
6. González-Avalos E, Ruiz-Suárez LG (2001) Methane emission factors from cattle manure in Mexico Bioresource Technol 80: 63–71.
7. European Union (2003) Protection of animals used for experimental purposes. Council Directive 86/ 609/EEC of 24 November 1986, amended 16.9.2003. European Council, Brussels, Belgium. 8. Agricultural and Food Research Council (AFRC) (1993) Energy and protein requirements of ruminants.
CAB International, Wallingford, UK.
9. Fernández C, López MC Lachica M (2012) Description and function of a mobile open-circuit respirome-try system to measure gas exchange in small ruminants. Anim Feed Sci Technol 172: 242–246. 10. Fernández C, López MC, Lachica M (2015) Low cost open-circuit hood system for measuring gas
exchange in small ruminants: from manual to automatic recording. J Agri Sci 153: 1302–1309. 11. McLean JA, Tobin G (1990) Animal and Human Calorimetry. Cambridge University Press, Cambridge.
335 pp.
12. Brockway JM, Boyne AW, Gordon JG (1971) Simultaneous calibration of gas analyzers and meters. J Appl Physiol 31: 296–297. PMID:5558255
13. Aguilera JF, Prieto C (1986) Description and function of an open-circuit respiration plant for pigs and small ruminants and the techniques used to measure energy metabolism. Arch Anim Nutr 11: 1009–
1018.
14. Vedrenne F, Béline F, Dabert P, Bernet N (2008) The effect of incubation conditions on the laboratory measurement of the methane producing capacity of livestock measurement wastes. Bioresource Tech-nol 99: 46–155.
15. Godbout S, Verma M, Larouche JP, Potvin L, Chapman AM, Lemay SP, et al. (2010) Methane produc-tion potential (B0) of swine and cattle manures—a Canadian perspective. Environ Technol 31: 1371–
1379. doi:10.1080/09593331003743096PMID:21121460
16. AOAC International (2000) Official Methods of Analysis of the Association of Official Analytical Chem-ists, 18th ed. Association of Official Analytical ChemChem-ists, Arlington, VA, USA.
17. Mertens DR (2002) Gravimetric determination of amylase-treated neutral detergent fiber in feeds with refluxing beakers or crucibles: collaborative study. J AOAC Int 85: 1217–1240. PMID:12477183
18. Robertson JB, Van Soest PJ (1981) The detergent system of analysis and its application to human foods. In: James WPT, Theander O (Eds.), The Analysis of Dietary Fiber in Foods. Marcel Dekker, New York, NY, USA, pp. 123–142.
19. National Research Council (NRC) (2001) Nutrient requirements of dairy cattle. 7th rev. ed. Natl. Acad. Press, Washington, D.C.
20. Batey IL (1982) Starch analysis using thermostable alpha-amylases. Stach/Stärke. 34: 125–128. 21. O’Fallon JV, Busboom JR, Nelson ML, Gaskins CT (2007) A direct method for fatty acid methyl ester
synthesis: Application to wet meat tissues, oils, and feedstuffs. J Anim Sci 85: 1511–1521. PMID:
17296772
22. Jouany JP (1982) Volatile fatty acid and alcohol determination in digestive contents, silage juices, bac-terial cultures and anaerobic fermentor contents. Sci Aliments 2: 131–144.
23. Brouwer E (1965) Report of sub-committee on constants and factors. In: Blaxter KL (Ed.), Pages 441–
443 in Proc. of the 3thSymposium on Energy Metabolism. EAAP. Publ. 11. Academic Press, London.
24. Brouwer E (1958) On simple formulae for calculating the heat expenditure and the quantities of carbo-hydrate and fat metabolized in ruminants, from data on gaseous exchange and urine N. Pages 182–
194 in Proc. 1thSymposium on Energy Metabolism. EAAP. Publ. 8. Academic Press, London.
25. Chwalibog A, Tauson AH, Thorbek G (1997) Quantitative oxidation of nutrients in growing calves. Z Ernährungswiss. 36:313–316. PMID:9467224
26. Fahey GC, Berger LL (1988) Carbohydrate nutrition of ruminants. Pages 269–297 in Church D.C. (Ed.), The Ruminant Animal. Digestive Nutrition and Physiology. Prentice-Hall, Englewood Cliffs, NJ. 27. SAS (Statistical Analysis System) (2001) User's Guide, Version 8.02, Statistical Analysis System
Insti-tute Inc. Cary, NC, USA.
29. Aguilera JF, Prieto C, Fonollá J (1990) Protein and energy metabolism of lactating Granadina goats. Br J Nutr 63: 165–175. PMID:2334659
30. Tovar-Luna I, Puchala R, Sahlu T, Freetly HC, Goetsch AL (2010) Effects of stage of lactation and die-tary concentrate level on energy utilization by Alpine dairy goats. J Dairy Sci 93: 4818–4828. doi:10. 3168/jds.2010-3315PMID:20855015
31. Bava L, Rapetti L, Crovetto GM, Tamburini A, Sandrucci A, Galassi G, et al. (2001) Effect of a non-for-age diet on milk production, energy and nitrogen metabolism in dairy goats throughout lactation. J Dairy Sci 84: 2450–2459. PMID:11768086
32. López MC, Fernández C (2013) Energy partitioning and substrate oxidation by Murciano-Granadina goats during mid lactation fed soy hulls and corn gluten feed blend as a replacement for corn grain. J Dairy Sci 96: 4542–4552. doi:10.3168/jds.2012-6473PMID:23628256
33. Palmquist DL, Jenkins TC (1980) Fat in lactation rations: Review. J Dairy Sci 63: 1–14.
34. Kebreab E, Strathe AB, Dijkstra J, Mills JAN, Reynolds CK, Crompton LA, et al. (2010) Energy and pro-tein interactions and their effects on nitrogen excretion in dairy cows. Pages 417–426 in Symp. on Energy and Protein Metabolism and Nutrition, Parma, Italy.
35. Chilliard Y, Ferlay A, Rouel J, Lamberet G (2003) A review and nutritional and physiological factors affecting goat milk lipids synthesis and lipolysis. J Dairy Sci 86: 1751–1770. PMID:12778586
36. Vlaeminck B, Fievez V, Cabrita ARJ, Fonseca AJM, Dewhurst RJ (2006) Factors affecting odd-and branched-chain fatty acids in milk: A review. Anim Feed Sci Technol. 131: 389–417.
37. Fievez V, Colman E, Castro-Montolla JM, Stefanov I, Vlaeminck B (2012) Milk odd- and branched-chain fatty acids as biomarkers of rumen function-An update. Anim Feed Sci Technol 172: 51–65. 38. Vlaeminck B, Gervais R, Rahman MM, Gadeyne F, Gorniak M, Doreau M, et al. (2015) Postruminal
synthesis modifies the odd- and branched-chain fatty acid profile from the duodenum to milk. J Dairy Sci 98: 4829–4840. doi:10.3168/jds.2014-9207PMID:25958291
39. Jorjong S, van Knegsel ATM, Verwaeren J, Bruckmaier RM, De Baets B, Kemp B, et al. (2015) Milk fatty acids as possible biomarkers to diagnose hyperketonemia in early lactation. J Dairy Sci 98: 5211–
5221. doi:10.3168/jds.2014-8728PMID:26094221
40. Ulbricht TL, Southgate DAT (1991) Coronary Heart Disease: Seven Dietary Factors. Lancet, 338: 985–
992. PMID:1681350
41. Knapp JR, Laur GL, Vadas PA, Weis WP, Tricarico JM (2014)Invited review: Enteric methane in dairy cattle production: Quantifying the opportunities and impact of reducing emissions. J Dairy Sci 97: 3231–3261. doi:10.3168/jds.2013-7234PMID:24746124
42. Angelidaki I, Sanders W (2004) Assessment of the anaerobic biodegradability of macropollutants. Rev Environ Sci Biotechnol 3: 117–129.
43. Velthof GL, Nelemans JA, Oenema O, Kuikman PJ (2005) Gaseous nitrogen and carbon losses from pig manure derived from different diets. J Environ Qual 34: 698–706. PMID:15758122
44. Jarret G, Cozannet P, Martinez J, Dourmad JY (2011) Effect of different quality wheat dried distiller’s grain solubles (DDGS) in pig diets on composition of excreta and methane production from feces and slurry. Livest Sci 140: 275–282.
45. Triolo JM, Sommer SG, Møller HB, Weisbjerg MR, Jiang XY, Xin Y (2011) A new algorithm to character-ize biodegradability of biomass duringanaerobic digestion: influence of lignin concentration on methane production potential. Bioresource Technol 102: 9395–9402.
46. IPCC (2006) IPPC Guidelines for national greenhouse gas inventories, vol. 4. Agriculture, forestry and other land use. In: Eggleston H.S., Buendia L., Miwa K., Ngara T. Tanabe K. (Eds.) (2006). Prepared by the National Greenhouse Gas Inventories Programme IGES, Hayama, Japan.
47. Klevenhusen F, Kreuzer M, Soliva CR (2011) Enteric and manure-derived methane and nitrogen emis-sions as well as metabolic energy losses in cows fed balanced diets based on maize, barley or grass hay. Animal 5: 450–461. doi:10.1017/S1751731110001795PMID:22445412
48. Spek JW, Dijstra J, van Duinkerken G, Bannink A (2013) A review of factors influencing milk urea con-centration and its relationship with urinary urea excretion in lactating dairy cattle. J Agri Sci 151: 407–
423.