Grain filling and fatty acid composition of safflower fertilized
with integrated nitrogen fertilizer and biofertilizers
Raouf Seyed Sharifi(1), Ali Namvar(2) and Reza Seyed Sharifi(1)
(1)University of Mohaghegh Ardabili, College of Agricultural Sciences, Daneshgah Street, 56199-11367, Ardabil, Iran. E-mail: [email protected], [email protected] (2)Young Researchers and Elite Club, Ardabil Branch, Islamic Azad University, Ardabil, Iran. E-mail: [email protected]
Abstract – The objective of this work was to evaluate the effects of the integrated application of nitrogen fertilizer and biofertilizers on the yield, grain filling period, and composition of fatty acids of safflower (Carthamus tinctorius). Split-plot experiments were carried out during the 2011 and 2012 crop seasons. The treatments consisted of seed inoculation with plant growth-promoting rhizobacteria (Azotobacter chroococcum strain 5, Azospirillum lipoferum strain F, and Pseudomonas putida strain 186) in the subplots, including a control without seed inoculation; and of the application of N fertilizer at different rates (60, 120, and 180 kg ha-1 urea) in the main plots, including a control without N. The highest grain yield, grain filling period, and
effective grain filling period were obtained by the application of 180 kg ha-1 urea and by seed inoculation with P. putida. The application of high N rates and P. putida inoculation resulted in 25.66% increase of the potential rate of grain filling. Biofertilizer inoculation in seed reduced the contents of saturated fatty acids (palmetic and stearic acids) and increased the contents of unsaturated fatty acids (linoleic, linolenic, and oleic acids). The suitable amount of N fertilizer (between 120 and 180 kg ha-1 urea) can improve plant growth, and the quantity and quality of oil in seeds treated with P. putida in safflower plants.
Index terms: Carthamus tinctorius, Pseudomonas putida, oil quality, PGPR, fatty acids, seed-inoculation.
Enchimento de grãos e composição de ácidos graxos em plantas de
cártamo adubadas com fertilizante nitrogenado e biofertilizantes
Resumo – O objetivo deste trabalho foi avaliar os efeitos da aplicação integrada de fertilizante nitrogenado e biofertilizantes sobre o rendimento, o período de enchimento de grãos e a composição de ácidos graxos de cártamo (Carthamus tinctorius). Os experimentos foram conduzidos em parcelas subdividas, durante as safras 2011 e 2012. Os tratamentos consistiram da inoculação de rizobactérias promotoras do crescimento de plantas (Azotobacter chroococcum estirpe 5, Azospirillum lipoferum estirpe F e Pseudomonas putida estirpe 186) nas sementes, nas subparcelas, com um controle sem inoculação; e da aplicação de diferentes níveis de adubação nitrogenada (60, 120 e 180 kg ha-1 de ureia) nas parcelas principais, com um controle sem
aplicação de N. O maior rendimento de grãos, o maior período de enchimento de grãos e o período efetivo de enchimento de grãos foram obtidos com a aplicação de 180 kg ha-1 de ureia e com a inoculação de P. putida nas
sementes. A aplicação de altas doses de N e a inoculação com P. putida resultaram no aumento de 25,66% da taxa potencial de enchimento de grãos. A inoculação de biofertilizantes nas sementes reduziu o teor de ácidos graxos saturados (ácidos palmítico e esteárico) e incrementou os ácidos graxos insaturados (ácidos linoleico, linolênico e oleico). A aplicação da quantidade adequada de adubação nitrogenada (120 a 180 kg ha-1 de ureia)
pode melhorar o crescimento de plantas e a quantidade e a qualidade do óleo das sementes tratadas com P. putida, em plantas de cártamo.
Termos para indexação: Carthamus tinctorius, Pseudomonas putida, qualidade do óleo, PGPR, ácidos graxos, inoculação em sementes.
Introduction
Safflower (Carthamus tinctorius L.) is one of the most
important oil seed all over the world. It has a high need of nitrogen (N) due to this nutrient multidimensional effects on the growth and development of this crop
Safflower N requirements depends on the amount of N in the soil, soil productivity, and preceding crop (Siddiqui & Oad 2006). Soleymanifard & Sidat (2011) suggested that yield and yield attribute of safflower increased by the increment of N application rate. This element is also the major macronutrient that determines the rate and period of grain filling. Final grain weight was related to grain filling rate, grain filling duration, and their interactions (Sadras & Egli, 2008). Borrás et al. (2004) found that lack of assimilate supply, during the grain filling period, could result in a dramatic decline of grain weight. Dordas & Sioulas (2008) reported that higher rates of N application increase the photosynthetic processes, leaf area production, and leaf area duration, as well as the grain filling period.
Although N is the key element for the increasing of safflower productivity, and, consequently for this crop production increment per unit of area, large rates of N fertilizer loss to the environment could cause a serious environmental problem, such as groundwater contamination. In such a situation, the reduction of N application rates to an optimized level, with the application of biofertilizers, can reduce the need for chemical fertilizers, decrease adverse environmental effects, increase soil organic matter, improve soil properties, and enhance crop yield. Therefore, in the development and implementation of sustainable agriculture techniques, biofertilization is important to alleviate environmental pollution and deterioration of nature (Namvar & Khandan, 2015).
Safflower oil quality is determined by oil composition of saturated and unsaturated fatty acids. Nasim et al. (2012) concluded that N is the most important element to increase grain oil content. They stated that increasing N rates reduced seed oil percentages, but increased seed yield, and, consequently, increased oil yield per unit area. Silva et al. (2013) reported that biofertilizer inoculation in soybean enhanced oil content and unsaturated fatty acids, while decreased saturated fatty acids. Moreover, Mirzakhani et al. (2009) showed that safflower yield increased in plants inoculated with Azotobacter.
The determination of safflower response to N application and seed inoculation by biofertilizers is very important to maximize yield and economic profitability of safflower production. In addition, it seems that there is little investigation about the combined effects of N fertilization and biofertilizer
on yield, grain filling period, and composition of fatty acids of safflower.
The objective of this work was to evaluate the effects of the integrated application of nitrogen fertilizer and biofertilizers on the yield, grain filling period, and composition of fatty acids of safflower (Carthamus tinctorius).
Materials and Methods
Field experiments were conducted in a randomized complete block design, in split plots with three replicates, during 2011 and 2012 crop seasons. The treatments were N applications at four rates (no N application as control, and 60, 120, and 180 kg ha-1
urea), assigned to the main plots; and seed treated by biofertilizer inoculations, assigned to the subplots, which were: no inoculation as control, and inoculation with Azotobacter chroococcum strain 5,
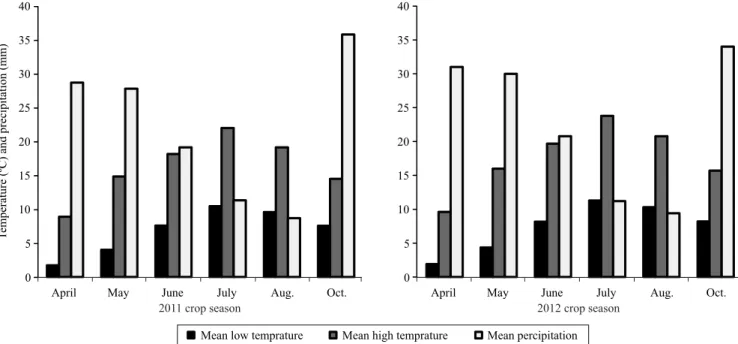
Azospirillum lipoferum strain F, and Pseudomonas putida strain 186. The area is located at 38°15'N and 48°15'E, 1,350 m altitute. Mean temperature and precipitation during safflower growing seasons of 2011 and 2012 is presentedin Figure 1. The studied area soil is an Entisol with a silty loam texture. Other physicochemical properties of soil are shown in Table 1.
In each plot, there were 5 rows of 6 m. Plots and blocks were separated by 1 m unplanted distances. Seed were manually sown in individual hills between rows, and intra-row spacing was 50×5 cm. Seed of 'Padideh' safflower were planted on 18th May in 2011,
and on 27th May in 2012. For inoculation, seed were
coated with gum arabic as an adhesive, and rolled into the suspension of bacteria until uniformly coated. Strain and cell densities of microorganisms used as plant growth-promoting rhizobacteria (PGPR), in this experiment, were 107 colony forming units (CFU).
In each experimental plot, two beside rows and a 0.5 m space from the beginning and the ending of the central planting lines were set as margins, and measurements were performed on the three rows in the middle lines. The number of grains per head, number of secondary branches, and the number of grains per plant were determined on 10 randomly selected plants in each plot. Seed oil and fatty acids were extracted according to the Method 988.05 (1990) protocol.
In each sampling, three plants of each plot were taken for the investigation of grain filling parameters. The first samples were taken on the 12th day after
flowering, in both years, and the other samples were taken at 4-day intervals for determining the grain weight accumulation. At each sampling, grains were manually removed from the heads and dried at 80°C for 48 hours. Grain dry weight and number were used to calculate the average grain weight for each sample. The total duration of grain filling
was determined for each treatment combination by fitting a bilinear model (Borrás & Otegui, 2001):
GW a gfr daa if p
a gfr p if daa p
m
m m
= + <
+
( ),... ...
( ),... ... ≥
in which: GW is the kernel dry weight; a is the GW intercept; gfr is the slope of grain weight, indicating grain filling rate; daa represents the days after flowering; and pm is the physiological maturity. Borrás
et al. (2004) illustrated grain filling using a bilinear model. Effective grain filling duration (EGFD) was calculated according to Borrás & Otegui (2001), as EGFD = the highest grain weight (g) / ratio of seed filling (g per day).
The kernel weight increase in the filling period was calculated by the above mentioned equation, using the Proc NLIN DUD of the statistical software SAS. Data were statistically analyzed by using SAS, version 9.1 (SAS Institute Inc., Cary, NC, USA). The analysis of variance was used to test the significance;
0 5 10 15 20 25 30 35 40
April May June July Aug. Oct. April May June July Aug. Oct.
T
emperature (ºC) and precipitation (mm)
Mean low temprature Mean high temprature Mean percipitation
2011 crop season 2012 crop season
0 5 10 15 20 25 30 35 40
Figure 1. Minimum and maximum temperatures, and precipitation recorded during 2011 and 2012 crop seasons, in Ardabil,
Iran.
Table 1. Soil physicochemical properties of the entisol samples at 0–40-cm depth in Ardabil, Iran.
Year Texture Sand
(g kg-1)
Silt (g kg-1)
Clay
(g kg-1)
CaCO3
(%)
Organic carbon (%)
Total N (%)
Exchangeable K (mg kg-1)
Extractable P
(mg kg-1)
pH
2011 Silty loam 240 700 50 18.3 0.78 0.16 385 16 8.2
and LSD, at 5% probability, was used to compare the means.
Results and Discussion
The number of secondary branches per plant increased about 31.6, 23.0, and 12.2% by the application of 180 kg ha-1 urea, in comparison to the application of
0, 60, 120 kg ha-1 urea, respectively (Table 2). Further,
the lowest and the highest values of this trait were recorded for the treatments with 0 and 180 kg ha-1 urea,
respectively. Elfadl et al. (2009) and Golzarfar et al. (2012) reported similar results. Moreover, the greatest number of secondary branches per plant were observed in the inoculation treaments. Pseudomonas inoculation increased the number of secondary branches by 18.9% in comparison to the noninoculated treatments. These results are in agreement with those reported by Soleymanifard & Sidat (2011) and Mirzakhani et al. (2009) in safflower. The comparison of means showed that the highest number of secondary branches was obtained in the application of 180 kg ha-1 urea and seed
inoculation with Pseudomonas, and the minimum
value for this trait was obtained in no inoculation and no N application treatments (Table 3).
The highest number of grains per plant occurred with the 180 kg ha-1 urea application, which increased
this trait in 36.2% compared to the control in each plant (Table 2). Soleymanifard & Sidat (2011) investigated the effects of N on the growth and yield of safflower, and reported that the number of grains per plant increased as a consequence of N doses up to 30 kg ha-1, but further increase of N doses (30 to
60 kg ha-1 N) showed no significant effect on this
trait. Biofertilizer inoculations increased the number of grains per plant. Plants treated with inoculation of
Pseudomonas, Azospirillum, and Azotobacter showed 9.8, 9.1 and 8.4% more grains per plant than nontreated plants, respectively. Different rates of N fertilizer and inoculation had effects on the number of grains per head. The maximum number of grains per head was observed in the treatment of 180 kg ha-1 urea, while
the lowest values of this trait was obtained from the control (Table 2). The use of 180, 120, and 60 kg ha-1
urea increased the number of grains per head by 27.7, 20.6 and 14.0%, respectively. Dordas & Sioulas (2008) reported that N fertilization increased the number of grains per head by 16% on average. Increasing the number of grains per head may be attributed to the delay of the vegetative and reproductive period, and to the lengthening of grain filling.
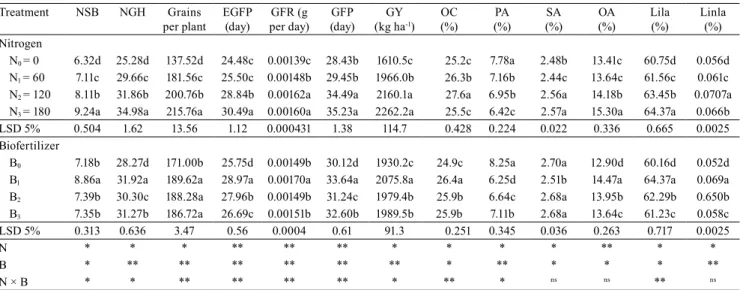
Table 2. Effects of biofertilizer (B) and nitrogen (N) rates on grain filling and oil content of safflower (mean of two years,
or combined analysis of the two years, 2011–2012) in the studied area, in Ardabil, Iran(1).
Treatment NSB NGH Grains
per plant EGFP
(day)
GFR (g per day)
GFP (day)
GY (kg ha-1)
OC
(%)
PA (%)
SA (%)
OA (%)
Lila (%)
Linla (%) Nitrogen
N0 = 0 6.32d 25.28d 137.52d 24.48c 0.00139c 28.43b 1610.5c 25.2c 7.78a 2.48b 13.41c 60.75d 0.056d
N1 = 60 7.11c 29.66c 181.56c 25.50c 0.00148b 29.45b 1966.0b 26.3b 7.16b 2.44c 13.64c 61.56c 0.061c
N2 = 120 8.11b 31.86b 200.76b 28.84b 0.00162a 34.49a 2160.1a 27.6a 6.95b 2.56a 14.18b 63.45b 0.0707a
N3 = 180 9.24a 34.98a 215.76a 30.49a 0.00160a 35.23a 2262.2a 25.5c 6.42c 2.57a 15.30a 64.37a 0.066b
LSD 5% 0.504 1.62 13.56 1.12 0.000431 1.38 114.7 0.428 0.224 0.022 0.336 0.665 0.0025
Biofertilizer
B0 7.18b 28.27d 171.00b 25.75d 0.00149b 30.12d 1930.2c 24.9c 8.25a 2.70a 12.90d 60.16d 0.052d
B1 8.86a 31.92a 189.62a 28.97a 0.00170a 33.64a 2075.8a 26.4a 6.25d 2.51b 14.47a 64.37a 0.069a
B2 7.39b 30.30c 188.28a 27.96b 0.00149b 31.24c 1979.4b 25.9b 6.64c 2.68a 13.95b 62.29b 0.650b
B3 7.35b 31.27b 186.72a 26.69c 0.00151b 32.60b 1989.5b 25.9b 7.11b 2.68a 13.64c 61.23c 0.058c
LSD 5% 0.313 0.636 3.47 0.56 0.0004 0.61 91.3 0.251 0.345 0.036 0.263 0.717 0.0025
N * * * ** ** ** * * * * ** * *
B * ** ** ** ** ** ** * ** * * * **
N × B * * ** ** ** ** * ** * ns ns ** ns
nsNonsignificant. *, **Significant differences at 5% and 1% probability, respectively. NSB, number of secondary branches; NGH, number of grains per
head; EGFP, effective grain filling period; GFR, grain filling rate; GFP, grain filling period; GY, grain yield; OC, oil content; PA, palmitic acid; SA,
stearic acid; OA, oleic acid; Lila, linoleic acid; Linla, linolenic acid. N0, no nitrogen application; N1, N2, and N3, application of 60, 120, and 180 kg ha-1
urea, respectively. B0, no seed inoculation; B1, B2, and B3, seed inoculation by Pseudomonas putida strain 186, Azospirillum lipoferum strain F, and
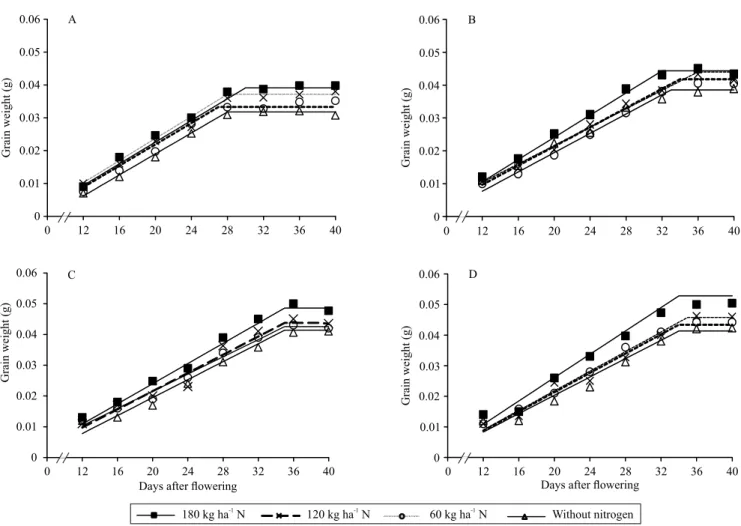
Application of high N rates (180 kg ha-1 urea) and
seed inoculation by Pseudomonas resulted in 25.66% increase of the grain filling potential rate, in comparison to the control (Table 2). In other words, peak grain filling rates lasted longer in the treatment with high N rates and seed inoculation with Pseudomonas than the control treatment (Figure 2 D). Borrás et al. (2004) reported that the lack of assimilate supply, could result in a dramatic decline in grain filling period and grain weight. Massignam et al. (2009) noted that N plays an imperative role in the maximization of crop yields, via its effects on photosynthetic processes such as grain filling rate and grain filling period. Abbadi et al. (2008) showed that increasing N fertilizer rates increased traits related to grain growth in safflower. Moreover, Hamidi et al. (2009) stated that grain filling period was prolonged due to inoculation by PGPR in maize hybrids. They suggested that inoculation by PGPR by various mechanisms – such as the ability to produce indoleacetic acid, gibberelic acid, cytokines, symbiotic N fixation, and antagonism to phytopathogenic microorganisms by the production of siderophores – causes the increase of grain filling period. High grain filling rate by the application of 180 kg ha-1 urea and
seed inoculation by Pseudomonas could result from
sufficient assimilate supply and large partitioning capacity.
Grain filling duration was delayed by seed inoculation, high rates of N application, and their combinations as compared to the control. The maximum grain filling duration was observed in the treatment with the highest N rate (Table 2). Among the biofertilizer treatments, seed inoculation by
Pseudomonas increased grain filling duration more
than Azotobacter and Azospirillum. Grain filling
duration increased in plots that received the highest rate of N application and seed inoculation by Pseudomonas
(Table 3). Similar results were obtained in effective grain filling period. Hamidi et al. (2009) reported that high N rates significantly delay the duration of the vegetative and reproductive periods, and could be the possible reason for lengthening of grain filling duration.
Effects of N rates on fatty acid compositions were significant (Table 2). Linoleic acid (C18:2) was the most
abundant fatty acid, ranging between 60.75–64.37%, followed by oleic acid (C18:1, 13.41–15.3%) and palmitic
acid (C16:0, 6.95–7.78%), by the application of 0 and
180 kg ha-1 urea respectively. The amount ranges
of linolenic acid (C18:3) and stearic acid (C18:1) were
Table 3. Effects of biofertilizer (B) and N rates on grain filling and oil content of safflower (mean of two years, or combined
analysis of the two years, 2011–2012) in the studied area, Ardabil, Iran(1).
Treatment
compound NSB per plantGrains
GFR (g per day)
EGFP (day)
GFP (day)
Fitted equations
NGH OC
(%)
PA (%)
Linla (%)
GY (kg ha-1)
N0 B0 5.56h 118.4i 0.00139f 23.03j 26.71k y=-0.00972+0.00146x 21.26i 27.9i 7.78a 60.75i 1515.3i
N0 B1 7.32ef 152.7g 0.00157c 25.93f 29.98gh y=-0.013+0.0016x 28.38g 31.4def 7.16c 64.37c 2238.3bc
N0 B2 6.14g 140.8h 0.00149d 24.81g 28.95hi y=-0.00997+0.00147x 25.48h 31.16fg 6.42f 63.45de 2130.9d
N0 B3 6.28g 142.1h 0.00145de 23.71ji 27.7kj y=-0.00976+0.0015x 26.45h 30.92g 6.25f 61.56h 1943.8f
N1 B0 6.52g 159.2g 0.00144e 23.94hi 27.0k y=-0.00647+0.0014x 28.02g 31.28efg 7.57b 60.70i 1605.2h
N1 B1 7.73de 191.7f 0.00159bc 26.31ef 31.39f y=-0.0107+0.00163x 30.29f 32.85cd 6.95d 65.14b 2249.6bc
N1 B2 7.00f 191.7f 0.00149d 26.31ef 30.19g y=-0.00785+0.00146x 30.07f 31.77cd 6.32f 63.62de 2174.4cd
N1 B3 7.00f 188.0f 0.00145de 24.71gh 28.6ji y=-0.00967+0.0015x 30.68ef 31.52def 6.27f 62.24g 1959.3ef
N2 B0 7.97d 195.3ef 0.00139f 27.1de 32.59e y=-0.0064+0.0014x 29.95f 31.64cde 5.80g 61.38h 1735.4g
N2 B1 9.18b 203.5de 0.00159bc 30.19ab 35.68b y=-0.0099+0.00168x 33.09cd 33.34a 5.95g 66.61a 2278.9ab
N2 B2 7.73de 206.6cd 0.00158c 29.4b 34.88bc y=-0.00803+0.00148x 31.89de 32.01c 6.26f 63.89cd 2190.1cd
N2 B3 7.61de 203.1de 0.00147cd 28.2c 33.78cd y=-0.0102+0.0016x 33.09cd 32.49b 6.72e 62.62fg 1988.8ef
N3 B0 8.56c 207.9bcd 0.00158c 27.9cd 33.58de y=-0.00881+0.00164x 34.3bc 29.35h 6.95d 62.24g 1788.3g
N3 B1 11.35a 219.0a 0.00187a 30.79a 36.87a y=-0.0121+0.00191x 36.6a 31.64cde 5.83g 65.36b 2344.0a
N3 B2 8.69c 217.6ab 0.00163b 29.7b 35.48b y=-0.0104+0.00165x 34.3bc 31.52def 6.25f 64.44c 2237.4bc
N3 B3 8.51c 215.4abc 0.00159bc 28.5c 34.28cd y=-0.00971+0.00169x 35.51ab 31.77cd 6.25f 63.14ef 2024.4e
LSD 0.438 9.92 0.000394 0.81 1.11 - 1.27 0.4031 0.196 0.572 79.45
(1)Means with equal letters, in the columns, are not different by LSD test at 5% of probability. N
0, no nitrogen application; N1, N2, and N3, application
of 60, 120, and 180 kg ha-1 urea, respectively. B
0, no seed inoculation; B1, B2, and B3, seed inoculation by Pseudomonas putida strain 186, Azospirillum
lipoferum strain F, and Azotobacter chroococcum strain 5, respectively. NSB, number of secondary branches; GFR, grain filling rate; EGFP, effective
0.056-0.0707% and 2.48-2.57%, respectively; these ranges are similar to those reported by Coşge et al. (2007) in safflower. The application of 120 kg ha-1
urea increased the linoleic acid content in 5.6, 4.36, and 1.4%, in comparison to the applications of 0, 60, and 180 kg ha-1 urea, respectively. Safflower
oil composition determines the oil quality, and the oil fatty acid composition varies according to the environmental conditions during grain filling.
Pseudomonas inoculation induced 6.5% increase of linoleic acid content (Table 2). The saturated fatty acids (palmitic and stearic acids) reduced in the treatment with Pseudomonas inoculation, in comparison to
the control, while unsaturated fatty acids (linoleic, linolenic, and oleic acids) increased. Silva et al. (2013)
reported that the biofertilizer inoculation enhances fatty acids content of soybean seed. The comparison of means showed that both inoculation and N application induced a content increase of linoleic acid. The treatments with application of 60, 120, and 180 kg ha-1 urea and the Pseudomonas inoculation
showed the highest linoleic fatty acid content – 6.73, 8.1, and 7% increase, respectively, in comparison to the control. Conversely, these treatments resulted in the lowest content of palmitic acid, with 10.8, 23.0, and 25.5% decrease, respectively. Silva et al. (2013) reported that the biofertilizer inoculation enhances unsaturated fatty acids content of soybean seed. Similar results have been reported by Coşge et al. (2007) in safflower.
Figure 2. Variation of grain weight and of grain filling period in safflower plants subjected to N application at various rates,
Oil content is one of the more important components, which play a crucial role, in safflower seed quality. A slight increase of oil content was observed by increasing N rates up to 120 kg ha-1 urea; however, by
applying the highest N level, the oil content decreased again, which agrees with Abbadi et al. (2008), who found that at high N levels there was a significant decrease of oil content. However, Dordas & Sioulas (2008) found no relationship between N rates and oil content. In the present study, the maximum seed oil content was obtained by applying 120 kg ha-1 urea and
Pseudomonas inoculation; minimum seed oil content
was observed in the control treatment (Table 3). The seed oil content increased by 8.7% with increasing N applications from 0 to 120 kg ha-1 urea, and, then,
it decreased significantly. Golzarfar et al. (2012) found that increasing N rates from 0 to 150 kg ha-1
urea increased the means of all traits, except for seed oil content which had a slight decrease in the highest level of N. Biofertilizer inoculated plants showed a higher seed oil content than the control plants (Table 2). Pseudomonas inoculation induced 5.6% increase of oil content, in comparison to the control treatment. Both inoculation and N application induced an increase of oil content. The treatments with 120 kg ha-1 urea and seed inoculation by
Pseudomonas showed the highest oil content (16.3% increase). Shehata & El-Khawas (2003) reported that seed treated with PGPR inoculation increased oil content of sunflower. Silva et al. (2013), in a soybean study, and Coşge et al. (2007), in a safflower study, reported similar results.
The different combinations of seed treated with biofertilizer inoculation and N-fertilization treatments had effect on the grain yield of safflower (Table 3). The highest grain yield was obtained in the integrated treatment of 180 kg ha-1 urea and
Pseudomonas inoculation, which had a significant
difference in comparison to other integrated treatments. The minimum grain yield was obtained in the control treatment. Biofertilizer applications showed a promoting effect on the grain yield, comparing with the uninoculated treatments. The biofertilizer treatment with Pseudomonas,
Azotobacter, and Azospirillum increased grain yield by 6.97, 2.5, and 3.0%, respectively, in comparison to the control. Similar findings were also reported by Shoghi-Kalkhoran et al. (2013), who stated that
biofertilizer alone, or in combination with synthetic fertilizers, significantly increased grain. Stimulation of different crops by biofertilizer inoculations has also been shown by other studies, both in laboratory and field trials. According to Stefan et al. (2013), yield increased up to 18.42% with Bacillus pummilus
inoculation, and up to 33.36% with Bacillusmycoides
inoculants. Soleymanifard & Siadat (2011) have been shown that safflower yield increased by the seed treatment with PGPR inoculation.
Conclusions
1. Biofertilizer inoculation and N application have effects on the grain filling period, and on the quantitative and qualitative yield of safflower.
2. Contents of saturated fatty acids reduce as a consequence of seed treated with biofertilizer inoculations, while unsaturated fatty acids increase.
3. The suitable amount of N fertilizer application (between 120 and 180 kg ha-1 urea) can improve plant
growth and the quantity and quality of oil, in seed treated with Pseudomonas putida inoculation, in safflower plants.
References
ABBADI, J.; GERENDÁS, J.; SATTELMACHER, B. Effects of nitrogen supply on growth, yield and yield components of safflower and sunflower. Plant and Soil, v.306, p.167-180, 2008. DOI: 10.1007/s11104-008-9569-5.
BORRÁS, L.; OTEGUI, M.E. Maize kernel weight response to postflowering source-sink ratio. Crop Science, v.41, p.1816-1822, 2001. DOI: 10.2135/cropsci2001.1816.
BORRÁS, L.; SLAFER, G.A.; OTEGUI, M.E. Seed dry weight response to source-sink manipulations in wheat, maize and soybean: a quantitative reappraisal. Field Crops Research, v.86, p.131-146, 2004. DOI: 10.1016/j.fcr.2003.08.002.
COŞGE, B.; GÜRBÜZ, B.; KIRALAN, M. Oil content and fatty acid composition of some safflower (Carthamus tinctorius L.) varieties sown in spring and winter. International Journal of
Natural and Engineering Sciences, v.1, p.11-15, 2007.
DORDAS, C.A.; SIOULAS, C. Safflower yield, chlorophyll content, photosynthesis, and water use efficiency response to nitrogen fertilization under rainfed conditions. Industrial
Crops and Products, v.27, p.75-85, 2008. DOI: 10.1016/j.
indcrop.2007.07.020.
conditions in temperate climate. Field Crops Research, v.114, p.2-13, 2009. DOI: 10.1016/j.fcr.2009.06.012.
GOLZARFAR, M.; SHIRANI RAD, A.H.; DELKHOSH, B.; BITARAFAN, Z. Safflower (Carthamus tinctorius L.) response to different nitrogen and phosphorus fertilizer rates in two planting seasons. Žemdirbystė-Agriculture, v.99, p.159-166, 2012.
HAMIDI, A.; CHAOKAN, R.; ASGHARZADEH, A.; DEHGHANSHOAR, M.; GHALAVAND, A.; MALAKOUTI, M.J. Effect of plant growth promoting rhizobacteria (PGPR) on phenology of late maturity maize (Zea mays L.) hybrids. Iranian
Journal of Crop Sciences, v.11, p.249-270, 2009.
KULEKCI, M.; POLAT, T.; OZTURK, E. The determination of economically optimum nitrogen dose in safflower production under dry conditions. Bulgarian Journal of Agricultural
Science, v.15, p.341-346, 2009.
MASSIGNAM, A.M.; CHAPMAN, S.C.; HAMMER, G.L.; FUKAI, S. Physiological determinants of maize and sunflower grain yield as affected by nitrogen supply. Field Crops Research, v.113, p.256-267, 2009. DOI: 10.1016/j.fcr.2009.06.001.
METHOD 988.05. In: HELRICH, K. (Ed.). Official methods of analysis of the AOAC. 15th ed. Arlington: Association of Official
Analytical Chemists, 1990.
MIRZAKHANI, M.; ARDAKANI, M.R.; AEENE BAND, A.; REJALI, F.; SHIRANI RAD, A.H. Response of spring safflower to co-inoculation with Azotobacter chroococum and Glomus intraradices under different levels of nitrogen and phosphourus. American Journal of Agricultural and Biological Sciences, v.4, p.255-261, 2009. DOI: 10.3844/ajabssp.2009.255.261. NAMVAR, A.; KHANDAN, T. Inoculation of rapeseed under different rates of inorganic nitrogen and sulfur fertilizer: impact on water relations, cell membrane stability, chlorophyll content and yield. Archives of Agronomy and Soil Science, v.61, p.1137-1149, 2015. DOI: 10.1080/03650340.2014.982550.
NASIM, W.; AHMAD, A.; HAMMAD, H.M.; CHAUDHARY, H.J.; MUNIS, M.F.H. Effect of nitrogen on growth and yield
of sunflower under semi-arid conditions of Pakistan. Pakistan
Journal of Botany, v.44, p.639-648, 2012.
SADRAS, V.O.; EGLI, D.B. Seed size variation in grain crops: allometric relationships between rate and duration of seed growth. Crop Science, v.48, p.408-416, 2008. DOI: 10.2135/ cropsci2007.05.0292.
SHEHATA, M.M.; EL-KHAWAS, S.A. Effect of two biofertilizers on growth parameters, yield characters, nitrogenous components, nucleic acids content, minerals, oil content, protein profiles and DNA banding pattern of sunflower (Helianthus annus L. cv. Vedock) yield. Pakistan Journal of Biological Sciences, v.6, p.1257-1268, 2003. DOI: 10.3923/pjbs.2003.1257.1268.
SHOGHI-KALKHORAN, S.; GHALAVAND, A.; MODARRES-SANAVY, S.A.M.; MOKHTASSI-BIDGOLI, A.; AKBARI, P. Integrated fertilization systems enhance quality and yield of sunflower (Helianthus annuus L.). Journal of Agricultural Science and Technology, v.15, p.1343-1352, 2013.
SIDDIQUI, M.H.; OAD, F.C. Nitrogen requirement of safflower (Carthamus tinctorius L.) for growth and yield traits. Asian
Journal of Plant Sciences, v.5, p.563-565, 2006. DOI: 10.3923/
ajps.2006.563.565.
SILVA, L.R.; PEREIRA, M.J.; AZEVEDO, J.; MULAS, R.; VELASQUEZ, E.; GONZÁLEZ-ANDRÉS, F.; VALENTÃO, P.; ANDRADE, P.B. Inoculation with Bradyrhizobium japonicum enhances the organic and fatty acids content of soybean (Glycine max L. Merrill) seeds. Food Chemistry, v.141, p.3636-3648, 2013. DOI: 10.1016/j.foodchem.2013.06.045.
SOLEYMANIFARD, A.; SIDAT, S.A. Effect of inoculation with bio-fertilizer in different nitrogen levels on yield and yields components of safflower under dry land conditions. American-Eurasian Journal of Agriculture and Enviromental Sciences, v.11, p.473-477, 2011.
STEFAN, M.; MUNTEANU, N.; STOLERU, V.; MIHASAN, M. Effects of inoculation with plant growth promoting rhizobacteria on photosynthesis, antioxidant status and yield of runner bean. Romanian Biotechnological Letters, v.18, p.8132-8143, 2013.