www.atmos-chem-phys.net/7/739/2007/ © Author(s) 2007. This work is licensed under a Creative Commons License.
Chemistry
and Physics
Air-sea fluxes of methanol, acetone, acetaldehyde, isoprene and
DMS from a Norwegian fjord following a phytoplankton bloom in a
mesocosm experiment
V. Sinha1, J. Williams1, M. Meyerh¨ofer2, U. Riebesell2, A. I. Paulino3, and A. Larsen3 1Max Planck Institute for Chemistry, J.J. Becher Weg 27, 55128 Mainz, Germany
2Leibniz Institut f¨ur Meereswissenschaften, IFM-GEOMAR, Marine Biogeochemie, D¨usternbrooker Weg 20, 24105 Kiel, Germany
3Department of Biology, Jahnebakken 5, University of Bergen, P.O. Box 7800, 5020 Bergen, Norway Received: 28 July 2006 – Published in Atmos. Chem. Phys. Discuss.: 10 October 2006
Revised: 10 January 2007 – Accepted: 18 January 2007 – Published: 14 February 2007
Abstract. The ocean’s influence on volatile organic com-pounds (VOCs) in the atmosphere is poorly understood. This work characterises the oceanic emission and/or uptake of methanol, acetone, acetaldehyde, isoprene and dimethyl sulphide (DMS) as a function of photosynthetically ac-tive radiation (PAR) and a suite of biological parameters. The measurements were taken following a phytoplankton bloom, in May/June 2005 with a proton transfer reac-tion mass spectrometer (PTR-MS), from mesocosm enclo-sures anchored in the Raunefjord, Southern Norway. The net flux of methanol was always into the ocean, and was stronger at night. Isoprene and acetaldehyde were emitted from the ocean, correlating with light (ravcorr,isoprene=0.49;
ravcorr,acetaldehyde=0.70) and phytoplankton abundance. DMS
was also emitted to the air but did not correlate signif-icantly with light (ravcorr,dms=0.01). Under conditions of
high biological activity and a PAR of∼450µmol photons m−2s−1, acetone was emitted from the ocean, otherwise it was uptaken. The inter-VOC correlations were highest between the day time emission fluxes of acetone and ac-etaldehyde (rav=0.96), acetaldehyde and isoprene (rav=0.88)
and acetone and isoprene (rav=0.85). The mean fluxes
for methanol, acetone, acetaldehyde, isoprene and DMS were −0.26 ng m−2s−1, 0.21 ng m−2s−1, 0.23 ng m−2s−1, 0.12 ng m−2s−1and 0.3 ng m−2s−1, respectively. This work shows that compound specific PAR and biological depen-dency should be used for estimating the influence of the global ocean on atmospheric VOC budgets.
Correspondence to:J. Williams (williams@mpch-mainz.mpg.de)
1 Introduction
As the ocean covers some 70% of the Earth’s surface area, its potential effect on atmospheric trace gases is enormous. Re-markably, the net primary production of the ocean (48.5 PgC yr−1, P=peta=1015)is comparable to that of the terrestrial environment (56.4 PgC yr−1)(Field et al., 1998), despite the total amount of biomass in the surface ocean being 100 times less than on land. Ocean biology influences the concen-trations of dissolved gases directly (through photosynthesis and emission), and indirectly (through photochemistry of by-products). Such processes lead to an uptake from, or an emis-sion to, the overlying atmosphere for a suite of organic gases (e.g. CO2, DMS, isoprene, acetone). These gases are known to significantly impact the atmosphere, influencing ozone photochemistry and aerosol physics (Williams, 2004a, and references therein) even at trace concentrations. Dimethyl sulphide and isoprene have both been established as emis-sions from the surface ocean to the atmosphere and the dis-tribution of these sources has been investigated by several groups (Bonsang et al., 1992; Kettle and Andreae, 2000; Palmer and Shaw, 2005). Many hundreds of atmospherically important species have been characterised and inventoried from terrestrial sources (Olivier et al., 1994; Guenther et al., 1995), but in comparison, very little work has been done on assessing the emission of volatile organic compounds from the ocean.
Fig. 1.View of the University of Bergen raft facility with attached mesocosms, located in a fjord 20 km south of Bergen. The enlarged views show the mesocosms and the raft in detail.
in the upper troposphere (McKeen et al., 1997; Tie et al., 2003; Colomb et al., 2006). Furthermore, the surface ocean has been shown to be a massive reservoir for oxygenated organic species, both indirectly from aircraft measurements (Singh et al., 2000) and directly from ship borne measure-ments (Williams et al., 2004b).
There have been several global budget estimates for the oxygenated species methanol (Singh et al., 2000; Galbally and Kirstine, 2002; Heikes et al., 2002), and acetone (Singh et al., 1994, 2000, 2004; de Laat et al., 2001; Jacob et al., 2002). The large range of these budget estimates (75– 490 Tg yr−1 methanol; 37–148 Tg yr−1 acetone) indicates their currently uncertain nature, and in all these budgets the role of the ocean is the most uncertain factor. In the case of methanol, there is general consensus that methanol is up-taken from the atmosphere to the ocean. The latest budget estimates by Singh et al. (2004) and Jacob et al. (2005) es-timate a 10–15 Tg yr−1 sink accounting for approximately 20% of the global budget. It is not yet clear as to what is responsible for maintaining an under saturation of methanol in surface waters, although certain methylotrophic bacteria are known to consume methanol (Kiene, 1993). In the case of acetone, there is remarkably poor agreement concerning the effect of the ocean on the global acetone budget. Using an inverse modelling approach, Jacob et al. (2002) deduced an oceanic source of 27 Tg yr−1 (some 33% of a total
bud-get of 95 Tg yr−1); Singh et al. (2004) estimated a small net sink (in a total budget of 95 Tg yr−1); whereas Marandino et al. (2005) extrapolate an oceanic sink of 48 Tg yr−1(in a total budget of 101 Tg yr−1), from flux measurements made over the Pacific Ocean. Clearly, further measurements are required in parallel with biological parameters to elucidate these seemingly contrary findings. Moreover, significant median mixing ratios of the reactive species acetaldehyde (204±40 pptv) have been reported by Singh et al. (2003), even after the application of a pollution filter on the dataset. Despite its potential atmospheric importance, no global bud-get estimate of acetaldehyde has been made to date.
In this study we characterise the effect of the ocean on ambient atmospheric mixing ratios of methanol, acetone, ac-etaldehyde, isoprene and DMS as a function of light and a suite of biological parameters. The measurements were made under semi-controlled conditions from custom-built meso-cosms deployed in the Raunefjord, Southern Norway (see Fig. 1). Mesocosm studies provide a useful interface between laboratory culture studies and open ocean surveys. While laboratory studies cannot generate the community dynamics of natural ecosystems, open ocean studies are complicated by horizontal and vertical mixing in both the air and water phases. Mesocosms therefore offer an excellent opportunity to study natural plankton communities under controlled con-ditions.
2 Experimental
2.1 The mesocosms
PO3−4 . The development of the bloom is seen in the profile of Chlorophyll a and the trace gas measurements presented herein were conducted in the aftermath of the bloom (see Fig. 2).
The air flow into several mesocosms was dosed with addi-tional CO2in order to also study the effects of elevated CO2 on marine biology (see PeECE study website at http://peece. ifm-geomar.de). In this work, we present measurements only from the duplicate mesocosms which were flushed with am-bient air, since these most closely represent the amam-bient at-mosphere of today and are not subject to additional biologi-cal responses associated with altering dissolved CO2. Based on the rate of the ambient air inflow and the volume of the mesocosm headspace (∼4.3 m3), the total headspace-air re-placement time was 191 min and 170 min for mesocosms 7 and 8, respectively. The inflow and outflow air from both mesocosms was sampled for a suite of volatile organic com-pounds.
Irradiance was continuously measured every 10 min throughout the study by using a Li-Cor cosine sensor (LI-192SA), mounted on top of the floating mesocosm labora-tory.
2.2 PTR-MS
A proton transfer reaction mass spectrometer (PTR-MS) was employed to measure masses 33, 59, 45, 63 and 69, which have been attributed to methanol, acetone, acetaldehyde, DMS and isoprene, respectively. These identifications are in keeping with previous studies although minor contribu-tions from other species, such as propanal to mass 59 can-not be ruled out (Lindinger et al., 1998; Williams et al., 2001). The instrument was positioned on a floating raft to which the mesocosms were attached, in a fjord that opened to the sea some 5 km away (see Fig. 1). Ambient air and air from the headspace of each mesocosm was drawn rapidly (∼4.3 L min−1)and continuously through 0.64 cm diameter and 25 m long Teflon lines shrouded from sunlight. The in-let residence time was less than 12 seconds. A fraction of this flow was sampled online by the PTR-MS. The entire in-let system of the PTR-MS including switching valves com-prised of Teflon. Within the instrument, organic species with a proton affinity greater than water are chemically ionised by proton transfer with H3O+ions and the products are de-tected using a quadrupole mass spectrometer (Lindinger et al., 1998). Further details of the operation of the PTR-MS used here are given elsewhere (Salisbury et al., 2003).
Sequential measurements of ambient air and air from the duplicate mesocosms 7 and 8 were made for 10 min each, in the order – mesocosm 7, ambient air and meso-cosm 8. Calibrations were performed during the campaign using a commercial gas standard (Apel-Reimer Environ-mental Inc.). The total uncertainties of the measurements are estimated to be 21.3%, 15%, 19%, 17% and 14% for methanol, acetone, acetaldehyde, isoprene and DMS,
re-Fig. 2.Time series of Chlorophyll a in mesocosms 7 and 8.
spectively. This includes a 5% accuracy error inherent in the gas standard and a 2σ precision error for all the com-pounds. Detection limit was defined as the 2σ error in the instrument signal, while measuring methanol at an average mixing ratio of 1 nmol mol−1 and each of the other com-pounds at an average mixing ratio of 0.5 nmol mol−1. The individually calculated precision errors and detection lim-its were as follows, methanol (16.3%; 0.24 nmol mol−1), acetone (10%; 0.07 nmol mol−1), acetaldehyde (14%; 0.06 nmol mol−1), isoprene (12%; 0.06 nmol mol−1) and DMS (9%; 0.05 nmol mol−1).
2.3 Biological parameters methods
Chlorophyll a (Chl a) was determined in 250 to 500 ml sam-ples filtered on glass fibre filters (GF/F, Whatman). For pig-ment extraction, filters were homogenised in plastic vials to-gether with 1 ml acetone (100%) and a mixture of glass beads (2 and 4 mm) by shaking (5 min) in a cooled Vibrogen cell mill (Buehler, Germany). Afterwards the extracts were cen-trifuged (5000 rpm, 10 min, cooled at−10◦C). This proce-dure corresponds, with minor modifications, to the method of Derenbach (1969).
The content of Chlorophyll-a was then determined by means of HPLC (High Performance Liquid Chromatogra-phy), using the method of Barlow et al. (1997).
Phytoplankton cell counts were performed with a FAC-SCalibur flow-cytometer (Becton Dickinson) equipped with an air-cooled laser providing 15 mW at 488 nm and with a standard filter set-up. The algal counts were obtained from fresh samples at high flow rate (100µl min−1). The trigger was set on red fluorescence and the samples were run on the cytometer for 300 s. Discrimination of the algal groups was based on dot plots of side-scatter signal (SSC) and pigment autofluorescence (chlorophyll and phycoerythrin).
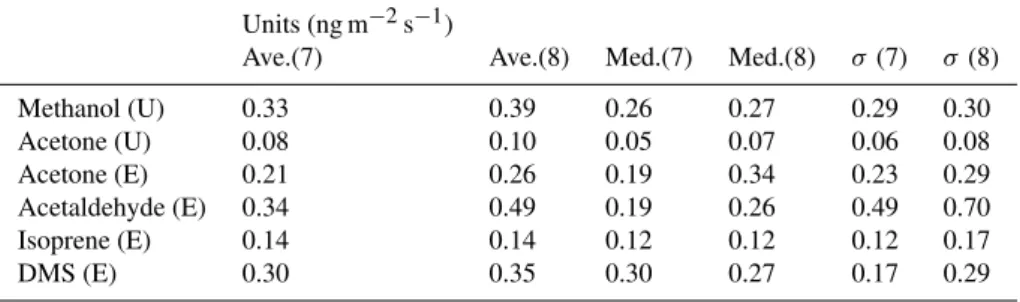
Table 1. Average, Median, Standard Deviations, Minima and Maxima for Measurements of the Ambient Marine Air flushed into the Mesocosms.
Units (nmol mol−1)
Ave. Med. Min. Max. σ n
Methanol 2.26 1.86 B.D.L 7.99 1.56 1171 Acetone 0.87 0.80 0.28 2.40 0.29 1228 Acetaldehyde 0.60 0.55 B.D.L 3.96 0.45 1099 Isoprene 0.18 0.18 B.D.L 2.38 0.17 1123 DMS 0.17 0.40 B.D.L 1.15 0.18 651
B.D.L = Below Detection Limit
al. (1999b). The discrimination of bacteria groups was based on groups observed in scatter plots of SSC signal versus green DNA-dye (SYBR Green) fluorescence. Fluorescence beads (Molecular Probes) with a diameter of 0.95µm were added to each sample analysed as an internal reference. Data files were analyzed using EcoFlow (version 1.0.5, available from the authors).
3 Results
3.1 General trends – gas phase species
Figure 3 shows a time series for measurements of methanol, acetone, acetaldehyde, isoprene and DMS measured as masses 33, 59, 45, 69, and 63, respectively. In each case the inflowing ambient air mixing ratio is plotted with the mea-surements from within mesocosms 7 and 8. Meamea-surements of the inflowing ambient air, including average, median and standard deviation are summarized in Table 1. Variability in the ambient air was highest for methanol followed by ac-etaldehyde, acetone, isoprene and DMS (seeσ values in Ta-ble 1). For all species, good agreement can be seen between the two duplicate mesocosms. Where the mixing ratios of a particular species in the mesocosm air were significantly lower than ambient air, we infer that an uptake occurred into the seawater. Conversely when mesocosm air mixing ratios were higher than the inflowing ambient air, an emission from seawater into the air was deduced.
Diel cycles were seen in the mesocosms for acetone, ac-etaldehyde and isoprene, which exhibited maxima and min-ima typically from 12:00 p.m.–04:00 p.m. and 12:00 a.m.– 08:00 a.m., respectively. In contrast, methanol showed no clear diel cycle in the mesocosms, the variation and absolute values of the mesocosm data being generally suppressed with respect to the ambient air. DMS mixing ratios in the meso-cosm air were observed to be generally higher in the evening rather than daytime. We investigate the light and biology de-pendence of these emissions and uptakes in Sect. 3.2.
3.2 Fluxes of organic species in relation to light (PAR) and biological parameters
At the outset, it should be noted that the emission and uptake fluxes reported here represent the net fluxes from seawater to air and vice versa, inside the mesocosm. Hence the fluxes may be the resultant of separate, strong sinks and sources within the mesocosm system.
Fluxes of the various VOCs were calculated according to Eq. (1),
Fvoc=Q
A(min,voc−mout,voc) Mvoc
Vm
(1) where Fvoc is flux of the VOC in µg m−2s−1, min,voc and mout,voc are the VOC mixing ratios (nmol mol−1)in the in-flowing ambient marine air and mesocosm air respectively, Qis the flow rate of the ambient air into the mesocosm in m3s−1, A is the surface area of the seawater enclosed by the mesocosm in m2, Mvocis the molecular weight of the VOC in kg kmol−1and Vmis the molar gas volume in m3kmol−1
(=23.233 at 1013.25 hPa and 283 K).
Figure 4 depicts the time series of the VOC fluxes and PAR in the duplicate mesocosms 7 and 8 while Table 2 gives a summary of the averages, medians and standard deviations of the VOC fluxes in the duplicate mesocosms.
Figure 5 shows daily plankton cell counts of the coc-colithophore Emiliania huxleyi, the cyanobacterium Syne-chococcus sp., other nano and picophytoplankton and free-living heterotrophic bacteria. The trace gas measurements covered two subsequent phases of the phytoplankton bloom, from 31 May–5 June – the final phase of bloom decline, and from 6 June–10 June – a post-bloom phase of low phy-toplankton standing stocks characterized by an increase in cyanobacterial cell numbers.
The photosynthetically active radiation (PAR) generally ranged from 0 to 1500µmol photons m−2s−1on most days (Fig. 4). Due to overcast conditions significantly lower daily maxima of ca. 400µmol photons m−2s−1occurred on the 4 and 10 June.
Table 2.Comparison of Fluxes in the duplicate mesocosms 7 and 8.
Units (ng m−2s−1)
Ave.(7) Ave.(8) Med.(7) Med.(8) σ(7) σ(8)
Methanol (U) 0.33 0.39 0.26 0.27 0.29 0.30 Acetone (U) 0.08 0.10 0.05 0.07 0.06 0.08 Acetone (E) 0.21 0.26 0.19 0.34 0.23 0.29 Acetaldehyde (E) 0.34 0.49 0.19 0.26 0.49 0.70 Isoprene (E) 0.14 0.14 0.12 0.12 0.12 0.17 DMS (E) 0.30 0.35 0.30 0.27 0.17 0.29
U = Uptake from atmosphere to seawater; E = Emission from seawater to atmosphere
well as the biological parameters in the two mesocosms. The fluxes of the individual organic compounds are examined in detail in the subsequent sections.
3.2.1 Methanol
Throughout the experiment, the net flux of methanol was always into the seawater from the mesocosm air above it. Thus methanol was uptaken both during the day and at night. The average of the Pearson linear correlation coefficients in the duplicate mesocosms (hereafter referred to as ravcorr), calculated for the methanol uptake fluxes and the photo-synthetically active radiation (PAR) was 0.18. The period from 31 May–5 June (phase of bloom decline) had stronger methanol uptake compared to 6 June–10 June (post-bloom phase with low phytoplankton abundance). Methanol up-take was generally higher during night-time, indicating that it was not driven by photosynthetic activity. The mean flux in both mesocosms calculated using median values was
−0.26 ng m−2s−1, the negative value indicating the direction from air to seawater.
3.2.2 Acetone
During the daylight sections of the experiment, acetone was emitted from the seawater to the air above it, if PAR ex-ceeded 450µmol photons m−2s−1, while at night it was al-ways uptaken from the air to the seawater. The acetone flux shows good correlation with PAR (ravcorr,acetone=0.70).
Fur-thermore, the emission fluxes were higher in the phase of bloom decline with still relatively high phytoplankton abun-dances (31 May–5 June) compared to the low biomass post-bloom phase (6 June–10 June). The average of the median uptake fluxes and emission fluxes (uptake from air to sea water and emission from sea water to air) in both meso-cosms was−0.06 ng m−2s−1 and 0.27 ng m−2s−1, respec-tively. Overall for the entire measurement period, the flux was an emission of 0.21 ng m−2s−1.
3.2.3 Acetaldehyde and isoprene
Acetaldehyde and isoprene were emitted from the seawater to the overlying air throughout the measurement period, with almost no evidence of seawater uptake. The fluxes of ac-etaldehyde and isoprene show strong correlation with each other (ravcorr=0.86). The flux of acetaldehyde shows greater correlation with PAR (ravcorr,acetaldehyde=0.70) compared to
isoprene flux and PAR (ravcorr,isoprene=0.49). There was a
de-crease in the flux of both acetaldehyde and isoprene during the second phase of the measurement period, from 6 June–10 June. Mean emission flux strengths calculated from median values in the duplicate mesocosms were 0.23 ng m−2s−1and 0.12 ng m−2s−1for acetaldehyde and isoprene, respectively. 3.2.4 Dimethyl sulphide (DMS)
In both mesocosms, DMS was always emitted from the sea-water to the air above it. DMS fluxes showed negligible correlation with PAR (ravcorrdms=0.01). Emission occurred at similar rates irrespective of light intensity, as seen on 4 June, which was particularly overcast. Remarkably, among all the measured organic species’ fluxes, only the DMS flux did not decrease in the second phase i.e. from 6 June–10June. The mean DMS emission flux calculated using median val-ues from both mesocosms was 0.3 ng m−2s−1.
4 Discussion
Fig. 3.Time series of methanol, acetone, acetaldehyde, isoprene and DMS from inside and outside the duplicate mesocosms 7 and 8.
5m of seawater in the mesocosm is kept well mixed (see Fig. 6) by use of an aquarium pump (constant flow) and it is from this volume that chlorophyll and DOC measurements are made. In the “real” world many physical parameters may affect the sea-air flux of a given species, for example, the wind speed (as was shown by Carpenter et al., 2004) and mixing down from the ocean uppermost mixed layer. Thus,
Fig. 4.Flux profiles of methanol, acetone, acetaldehyde, isoprene, DMS and photosynthetically active radiation (PAR) as a function of time in the duplicate mesocosms 7 and 8.
mixing are kept as constant as possible by means of a con-stant air flow and the effective mixing of the 0–5 m seawa-ter layer, thus allowing other potentially controlling param-eters to be investigated. Particularly suited for investigation in the mesocosm system is the significance of: a) ocean
Fig. 5.Daily variation of selected phytoplankton and bacteria over the measurement period for the duplicate mesocosms 7 and 8.
the mesocosm experiment over laboratory studies of single plankton species is that the plankton ecosystem is investi-gated as a whole, and possible interactions between plank-ton species (community dynamics) can occur. Furthermore within the mesocosm experiment the biology can be moni-tored, as opposed to “real world” aircraft studies (e.g. Singh et al., 2003) or coastal studies (e.g. Carpenter et al., 2004).
Fig. 6.Daily (11:00 a.m.) depth profiles of temperature in the wa-ters (upper 5 m) of mesocosm 7 (above) and mesocosm 8 (below).
Before discussing the correlation of the VOC fluxes with light and ocean biology we would like to examine the poten-tial effects of parameters such as friction velocity, the chang-ing temperature in the mesocosm waters (by possible “green-house” heating effect) and possible persistent surface micro-layer formation. In the mesocosm system, the influence of any dynamic parameter (e.g. friction velocity) on the VOC fluxes is constant because the air flow through the system is not changing and the water in the first 5 m is constantly mixed. Thus the observed variation in the VOC fluxes can-not be accounted for, in terms of such dynamic parameters. The daily depth profile of mesocosm water temperature is shown in Fig. 6 (the measurements were taken at 11:00 a.m. everyday when PAR is almost at its maximum value for the day, see Fig. 4). Note that the temperature in the water of the mesocosms did not differ significantly for the “sunny” days compared to the overcast days on the 3, 8 and 9 June. This is because the wind buffeting and wave action on the sides of the mesocosm tents coupled with the constant
ambi-Table 3.Change in Henry’s law partitioning due to change in tem-perature of the mesocosm waters.
Compound Henry’s law constant Temperature (K) (Cwater/Cair)
Methanol 13 003 283 Methanol 11 519 285 Acetone 1430 283 Acetone 1279 285 Acetaldehyde 969 283 Acetaldehyde 862 285
ent air flushing rate of 30 L/min ensures good mixing within the mesocosm system and prevents the accumulation of ther-mal energy quite efficiently. For the maximum change in the mesocosm water temperature of 2◦K observed between different days at 11:00 a.m. (see Fig. 6), the change in the Henry’s law partitioning between the aqueous and gas phase for the OVOCs is shown in Table 3. These results clearly show that the maximum temperature effect would cause only a 13% relative concentration change for methanol, 12% rel-ative concentration change for acetone and 12.4% relrel-ative concentration change for acetaldehyde concentrations in the gas phase based on the change in the Henry’s law partition-ing. The relative change in the mixing ratios, between a diel minima and maxima is, however, much greater varying be-tween 500%–1500% depending on the VOC and the biolog-ical phase (see Fig. 3). Moreover a diel variation time se-ries generated purely by the temperature effect should show no significant difference between the two biological phases. The issue of a persistent surface microlayer is an important one. Such a surface microlayer owing to its surfactant nature, would offer resistance to gas exchange between the bulk wa-ter layer and the atmosphere and also be more enriched in Dissolved Organic Matter (DOM) compared to the bulk wa-ter, due to inefficient transport and inhibited mixing. In the experimental set up, water in the first 5m was continuously circulated by means of an aquarium pump and the outlet of the pump was set near the surface in order to inhibit micro-layer formation. The fact that species produced in the bulk water such as isoprene, mirror PAR (see Fig. 4) without any significant time phase shift, support the theory that the com-bined effects of the waves buffeting the mesocosm tents and the internal mixing within the upper 5 m water column in the manner described earlier, prevent the occurrence of a persis-tent surface microlayer.
Fig. 7. Regression lines and correlation coefficients (r) between daily averaged VOC fluxes (individual rows) and daily abundance of the biological parameters (individual columns) using data from both mesocosms.
measured flux represents a net process due to possibly differ-ent sources and sinks. Nevertheless to give some idea about possible correlations between the VOC fluxes and the few biological parameters measured in this study, we have done a linear regression analysis of the daily averaged VOC flux (row) against the measured biological parameters (column) in both the mesocosms (see Fig. 7). For acetone, the daily emission flux and daily uptake flux has been treated individu-ally. While interpreting the correlations, it should be borne in
mind that at different stages in their life cycle, biological or-ganisms can exhibit different responses and that community dynamics can cause coincidental correlations between indi-vidual VOCs and the biological parameters. Furthermore, some of the measured biological parameters are individual species such as Emiliania huxleyi and Synechococuss sp.
care should be taken while interpreting the significance of the correlations. Moreover, the chlorophyll content and hence photosynthetic activity depends to considerable degree on the cell size of the autotrophic species, so one cell of Emilia-nia huxleyiwill be more potent in producing isoprene (a by product of photosynthesis) than one cell of the other smaller autotrophic species.
Day-time emission of acetone from seawater to the air occurred during the period of bloom decline, when phyto-plankton biomass was still high, and comparatively low or absent during the post-bloom period of low phytoplankton abundances. Daily averaged acetone emissions seem to cor-relate positively with the measured daily abundance of Emil-iania huxleyi(r=0.67) and picophytoplankton (r=0.70) while there seems to be negative correlation withSynechococcus sp. (r=−0.57) (see Fig. 7). Light-dependency of acetone emission was indicated on 4 June, when maximum light intensities below ∼350µmol photons m2s−1 shifted day-time acetone emission to acetone uptake. Can we recon-cile these results with the study by Marandino et al. (2005), which reported that acetone is always uptaken from the air to the seawater? It is well established that dissolved or-ganic matter produces acetone by solar irradiation (Zhou and Mopper, 1997). During both phases of plankton suc-cession covered by our measurements, i.e. from 31 May– 5 June and 6 June–10 June, the dissolved organic mat-ter (DOM) in the seawamat-ter did not show significant vari-ance. Concentrations of dissolved organic carbon (DOC), nitrogen (DON) and phosphorus (DOP) were more or less constant during the measurement period with mean val-ues of DOC=100±7µmol L−1; DON=8±3µmol L−1 and DOP=0.26±0.04µmol L−1(J. Wohlers, personal communi-cation, 2007). However, since the second phase had con-siderably less emission of acetone (see Figs. 4 and 5), de-spite similar PAR and DOM concentrations as during the first phase, the implication is that acetone production in seawa-ter is biologically mediated and light dependent. In the ab-sence or under low activity of the relevant production path-way, acetone consumption in seawater can exceed its produc-tion, leading to net acetone uptake by the ocean. This was the situation during the second phase of this study and may have been the cause during the study of Marandino et al. (2005) in the oligotrophic N. W. Pacific.
Net uptake of methanol from air into seawater appears to be attenuated by light, and biological dependence can be in-ferred from the decrease in the second phase, as plankton abundance and biomass declined. Of course the methanol uptake might have decreased simply because the water was under saturated in the beginning and became gradually more saturated towards the end of the experiment. If uptake was driven solely by physical undersaturation, the same trend would have been also seen in the acetone profiles (see Figs. 3 and 4). Let us nonetheless consider this hypothesis further. The well mixed mesocosm water volume is∼15 m3. In or-der to saturate this volume of water at 283◦K, and assuming
Surprisingly, methanol uptake shows correlation with Emil-iania huxleyiand picophytoplankton (|r|=0.86 and|r|=0.83, respectively). We would like to stress that for reasons out-lined earlier, this does not necessarily imply thatEmiliania huxleyiand picophytoplankton uptake methanol by night, al-though based on our dataset it seems to be a possibility.
Acetaldehyde and isoprene are generally emitted from the seawater to the overlying air. The emissions correlate with both photosynthetically active radiation, as well as the mea-sured biological parameters (r=0.58 for acetaldehyde with
Emiliania huxleyi, r=0.79 for isoprene withEmiliania hux-leyiand r=0.68 for acetaldehyde with picophytoplankton and r=0.77 for isoprene with picophytoplankton), with decrease in the second phase of the measurements. It should also be noted that some isoprene and acetaldehyde production occurs under overcast conditions and even at night. Like acetone, acetaldehyde is also produced by the photochemical degra-dation of dissolved organic matter (DOM) in seawater (Zhou and Mopper, 1997), while planktons are known to produce isoprene (Milne et al., 1995). The high degree of correla-tion between isoprene and acetaldehyde for the entire study (r=0.86) and the decrease in both isoprene and acetaldehyde emissions in the second phase, coupled with the insignificant variance in the dissolved organic matter (DOM) during both phases, suggest that there might be some biologically me-diated production of acetaldehyde in seawater, from which emission then occurs to the overlying air.
DMS emissions do not seem to depend on light and the emission rate is quite comparable in both phases. It is well established that DMS is produced in seawater both by direct release from phytoplankton and by bacteria and zooplankton mediated grazing (Dacey and Wakeham, 1986; Gabric et al., 2001). Further, Nguyen et al. (1998) have reported appre-ciable DMS production in seawater during the senescence phase of phytoplankton. Thus, DMS emission in the first phase is probably due to direct release from phytoplankton while grazing processes seem to be responsible for the DMS emission during the second phase.
It is also useful to try and look at correlations amongst the emission fluxes of isoprene, acetone, acetaldehyde, DMS and the uptake fluxes of acetone and methanol with each other during day and night conditions, to try and gauge if they might have common mechanisms linked to their uptake and/or emissions. The Pearson linear correlation coefficient (rav) for all possible pairs among the measured VOC fluxes
is shown in Table 4. The strongest correlations seem to be for the daytime emission fluxes of acetone and acetaldehyde (rav=0.96), acetaldehyde and isoprene (rav=0.88) and
ace-tone and isoprene (rav=0.85). Since isoprene is widely
estab-lished as a biogenic emission, these correlation values sup-port our hypothesis that acetone and acetaldehyde emissions have some biological dependence. The other notable feature is that at least for conditions during our study, DMS emission does not correlate with any of the other VOC fluxes.
In Table 5, we compare the mixing ratios and fluxes mea-sured here with previous studies on methanol, acetone, ac-etaldehyde, isoprene and DMS in the marine boundary layer. The general level of the ambient air mixing ratios of the oxygenates presented here are consistent with earlier stud-ies, while for isoprene and DMS, they are somewhat higher. Proton transfer reaction mass spectrometry measurements are upper limit estimates because of possibly more than one species contributing to the measured mass. It should be noted that the high mixing ratios of isoprene and DMS in the am-bient air were probably due to a local source of macro algae, which were growing near the raft but outside the mesocosms. Isoprene might additionally have been impacted by trees on the coast and the nearby islands.
The relative abundances of the organic trace gases reported in this work and measured using the same instrument, fit with the trend discerned from measurements in previous studies (Zhou and Mopper, 1993; Mao et al., 2006, and other refer-ences in Table 5). The trend is: methanol>acetone> ac-etaldehyde>isoprene∼DMS. The reported median values also show that the sum of the oxygenates is approximately six times higher than the sum of isoprene and DMS in the marine boundary layer. Interestingly, when fluxes are compared, the sum of the fluxes of oxygenated VOCs (0.23+0.27−0.26) is almost a factor of two smaller compared to the sum of iso-prene and DMS (0.12+0.3).
Compared with direct methanol, acetone and acetaldehyde fluxes reported from a terrestrial pine plantation (Karl et al., 2005), the oceanic fluxes reported here and in previous works (see Table 5) are 2–3 orders of magnitude lower.
Table 4.Pearson Correlation Coefficient (rav)between the VOC fluxes.
Methanol Acetone Acetaldehyde Isoprene DMS
Day+
Methanol 1 −0.19 −0.15 −0.28 0.2 Acetone – 1 0.96 0.85 0.01 Acetaldehyde – – 1 0.88 −0.01
Isoprene – – – 1 0.02
DMS – – – – 1
Night∗
Methanol 1 0.36 0.44 0.24 0.29 Acetone – 1 0.64 0.45 0.01 Acetaldehyde – - 1 0.58 0.26
Isoprene – – – 1 0.23
DMS – – – – 1
+ = Day defined as whenever PAR>100µmol m−2s−1; * = Night defined as whenever PAR≤100µmol m−2s−1
PAR are the primary driving forces of the sea-air fluxes in the mesocosms. Thus, the flux derived from the mesocosms gives an idea of how important ocean biology and PAR can be for the marine emissions and/or uptake of the different VOCs. All the oceanic VOC budget estimates, except per-haps DMS, are based on the few measurements conducted in the “open” oceans in “selected” oceanic regions which have been extrapolated to the global oceans (references in Table 5), although conditions vary widely and vastly from one part of the global ocean to the other. Given this current uncertainty in VOC fluxes from/to the ocean (as highlighted in Table 5), the fluxes from this study can be used to “ten-tatively extrapolate” for an “indication of the possible global flux” for comparison with previous budget estimates and to ascertain which species are most significant for atmospheric chemistry.
Although this study took place in coastal wa-ters, chlorophyll a (2.28–1.05µg L−1, nutrient values (PO3−4 =0.05µmol L−1; NO−3=1µmol L−1; SiO−3=0.25µmol L−1, Riebesell et al., 20071) and dis-solved organic matter (DOM; 97–110µmol L−1)measured in the mesocosm seawater between 31 May and 10 June are representative of vast areas of the global oceans. The up-scaling of the fluxes was based on the entire global ocean surface area of 3.61×10¹⁴m2, and all results are summarized in Table 5.
For methanol we estimate a net oceanic sink of 2.97 Tg yr−1. This is higher than the 0.3 Tg yr−1 oceanic sink proposed by Galbally and Kirstine et al. (2002) and lower than the estimates reported by Singh et al. (2003), Heikes et al. (2002) and Jacob et al. (2005). Based on the same 1Riebesell, U., Schulz, K. G., Bellerby, R. G. J., Botros, M.,
Fritsche, P., Meyerh¨ofer, M., Neill, C., Nondal, G., Oschlies, A., Wohlers, J., and Z¨ollner, E.: Enhanced biological carbon consump-tion in a high CO2 ocean, in preparaconsump-tion, 2007.
measurements but different models, methanol oceanic sinks of 8 Tg yr−1 and 15 Tg yr−1 were proposed by Singh et al. (2003) and Singh et al. (2004), respectively, showing that different model parameterizations give quite different results. Except for Jacob et al. (2002), all previous studies have es-timated a net oceanic sink for acetone. We estimate an emis-sion flux and uptake flux of 3.13 Tg yr−1 and 0.68 Tg yr−1, respectively. It should be mentioned that during the period of our field study in Norway, there was 18 h of daylight and only 6 h of darkness. As established in this study, acetone emissions are influenced by both a critical PAR threshold and biological activities, parameters that have not been in-corporated in up-scaling the measurements obtained in this or previous studies.
Table 5.Comparison with earlier works on Marine Emissions and Uptake of VOCs.
Med./Ave∗. Sea-Air Oceanic Oceanic Location Reference flux Source Sink
(nmol mol−1) (ng m−2s−1) (Tg yr−1) (Tg yr−1)
Methanol
0.87 −12.5a – – Tropical Atlantic Williams et al. (2004b) 0.57 −0.6a – 8 Pacific Ocean (0–2 km) Singh et al. (2003) 0.57 – – 15 Pacific Ocean (0–2 km) Singh et al. (2004) 2.0 −2.81a – – New England Marine Coast Mao et al. (2006)
0.9 – 30b 85 – Heikes et al. (2002)
– – – 0.3 – Galbally and Kirstine (2002)
– – – 10 – Jacob et al. (2005)
1.86 −0.26+ – 2.97 Raunefjord, Norway This work
Acetone
0.52 5.71a – – Tropical Atlantic Williams et al. (2004b) 1.3 −3.22a – – New England Marine Coast Mao et al. (2006) 0.47 −1.2a – 14 Pacific Ocean (0–2 km) Singh et al. (2003) 0.36 −2.92a – 48 North Pacific Ocean Marandino et al. (2005) 0.38 – – – Caribbean Sea Zhou et al. (1993)
– – 27 14 – Jacob et al. (2002)
0.5 – – – Mace Head Lewis et al. (2005) 0.8 −0.06+(U) 3.13 0.68 Raunefjord, Norway This work
0.27+(E)
Acetaldehyde
0.2 11a 125 – Pacific Ocean (0–2 km) Singh et al. (2003) 0.44 – – – Mace Head Lewis et al. (2005) 0.50 – – – Caribbean Sea Zhou et al. (1993) 0.55 0.23+ 2.62 – Raunefjord, Norway This work
Isoprene
0.04 0.02–0.24a 0.26–2.7 – NW Pacific Ocean Matsunaga et al. (2002) – 0.02a 0.22 – Near shore North Sea Broadgate et al. (1997) – 0.12a 1.4 – NW Pacific Ocean Bonsang et al. (1992) <0.01 0.01–0.08a 0.08–0.9 – Florida Straits Milne et al. (1995) – – 0.1–0.7 – North Atlantic Baker et al. (2000)
– – 0.12 – – Palmer et al. (2005)
0.18 0.12+ 1.4 – Raunefjord, Norway This work
Dimethyl sul-phide
0.05 1.79a – – Tropical Atlantic Williams et al. (2004b) – 1.44–4.3a – – Equatorial Pacific Ocean Huebert et al. (2004) 0.03–0.34 – – – Southern Indian Ocean Sciare et al. (2000)
– – 29–104d – – Andreae et al. (1990)
– – 25–72d – – Kettle et al. (2000)
– – 50.37d – – Nguyen et al. (1978)
0.4 0.3+ 3.42d – Raunefjord, Norway This work
lower than the only other estimate of 125 Tg yr−1reported by Singh et al. (2003). It should be noted that a direct emission of acetaldehyde through biological processes as suggested here is a good explanation why acetaldehyde levels were not consistent with ethane (formerly considered the main precur-sor) in the marine boundary layer.
Estimated global marine isoprene fluxes extrapolated from in-situ measurements range from 0.1–1.4 Tg yr−1(Bonsang et al., 1992; Broadgate et al., 1997; Matsunaga et al., 2002; Shaw et al., 2003; Broadgate et al., 2004). The latest estimate based on satellite chlorophyll observations totals 0.12 Tg yr−1(Palmer and Shaw, 2005). This is small in com-parison with terrestrial emissions of ca. 500 Tg yr−1and the results of this study (1.4 Tg yr−1)are in agreement with this estimate.
Dimethyl sulphide fluxes reported in this study (3.42 Tg yr−1) are significantly lower than those reported in previous open ocean studies (25–104 Tg yr−1; Nguyen et al., 1978; Andreae, 1990; Kettle and Andreae, 2000; Sciare et al., 2000; Huebert et al., 2004). Two factors may contribute to the difference between the flux estimates of this study and previous studies. Firstly, measurements being in the aftermath of a phytoplankton bloom, characterized by depleting nutrients and generally moribund phytoplank-ton populations, DMS emissions are expected to be low. Alternatively it could be that the predominant biological species during our measurement period were not prolific DMS emitters.
5 Conclusion
From the discussion above it is clear that the air-sea flux of each trace gas depends differently on light and biological ac-tivity. Therefore on a global scale, extremely large variations in such fluxes can be expected as a consequence of the range of solar and biological conditions over the oceans. From the extensive ocean studies done on DMS emission fluxes, it is also apparent that seasonality and biological hotspots (such as upwelling at coasts or oceanic fronts) are very impor-tant factors. Thus, specifically parameterized models con-strained by measurements from locations that represent the varied geographical areas of the global ocean are needed to form more accurate estimates of the oceanic contribution to the global budgets of different volatile organic compounds. This study has shown that PAR and ocean biology can act as quite important players in the emissions of acetone, ac-etaldehyde and isoprene from the ocean to the atmosphere. Photochemical and global ocean models that consider ethane to be the main source of acetaldehyde in the marine bound-ary layer may be able to resolve discrepancies between mea-sured and modeled acetaldehyde concentrations by consider-ing the additional biological source. The strong correlations between the daytime emission fluxes of acetone, acetalde-hyde and isoprene may also be useful for modeling the
air-sea emission fluxes of these VOCs. Possible methanol up-take at night by phytoplankton species must be investigated in future studies, as this could be a major source of methanol undersaturation in the global oceans. In order to further im-prove our understanding of the biogeochemical cycling of VOCs at the sea-air interface, we recommend that in future mesocosm experiments, both aqueous and gas phase concen-trations should be monitored and the mesocosm air should be actively circulated with a fan to ensure thorough mixing in the gas phase. Further, a more exhaustive suite of biolog-ical parameters, measured at a higher frequency than in this study may yield valuable insights for biological production and/or consumption of VOCs in the seawater. Finally, the re-sults have shown that the mesocosm approach is a new and novel technique, particularly suited for clarifying the vast un-certainties that exist in the field of Ocean VOC uptake and emissions and their biogeochemical cycling.
Acknowledgements. We wish to thank K. Schulz for the tempera-ture data from the mesocosms. The authors also thank members of the ORSUM group and PeECE III participants, in particular, R. Hofmann, T. Kl¨upfel, N. Yassaa and A. Colomb for assistance in installation on the raft. G. Eerdekens and P. Bernhardt are acknowl-edged for help in designing the hexapus sampling system. V. Sinha would like to thank the International Max Planck Research School for granting a Research Fellowship.
This work was completed as preparation for the OOMPH experi-ment (http://www.atmosphere.mpg.de/enid/oomph).
Edited by: N. Mihalopoulos
References
Andreae, M.: Ocean-Atmosphere Interactions in the global biogeo-chemical sulphur cycle, Mar. Chem., 30(1–3), 1–29, 1990. Apel, E., Hills, A., Lueb, R., Zindel, S., Eisele, S., and Riemer,
D.: A fast-GC/MS system to measure C-2 to C-4 carbonyls and methanol aboard aircraft, J. Geophys. Res.-Atmos., 108(D20), 8794–8811, 2003.
Barlow, R. G., Cummings, D. G., and Gibb, S. W.: Improved res-olution of mono- and divinyl chlorophylls a and b and zeaxan-thin and lutein in phytoplankton extracts using reverse phase C-8 HPLC, Mar. Ecol. Prog., Ser. 161, 303–307, 1997.
Bonsang, B., Polle, C., and Lambert, G.: Evidence for Marine pro-duction of isoprene, Geophys. Res. Lett., 19(11), 1129–1132, 1992.
Broadgate, W., Liss, P., and Penkett, S.: Seasonal emissions of iso-prene and other reactive hydrocarbon gases from the ocean, Geo-phys. Res. Lett., 24(21), 2675–2678, 1997.
Broadgate, W., Malin, G., Kupper, F., Thompson, A., and Liss, P.: Isoprene and other non-methane hydrocarbons from seaweeds: a source of reactive hydrocarbons to the atmosphere, Mar. Chem., 88(1–2), 61–73, 2004.
Colomb, A., Williams, J., Crowley, J., Gros, V., Hofmann, R., Salis-bury, G., Kluepfel, T., Kormann, R., Stickler, A., Forster, C., and Lelieveld J.: Airborne measurements of trace organic species in the upper troposphere over Europe: the impact of deep convec-tion, Environ.Chem., 3, 244–259, doi:10.1071/EN06020, 2006. Dacey, J. and Wakeham, S.: Oceanic dimethyl sulfide –
pro-duction during zooplankton grazing on phytoplankton, Science, 233(4770), 1314–1316, 1986.
Derenbach, J.: Zur Homogenisation des Phytoplanktons f¨ur die Chlorophyllbestimmung, Kieler Meeresforschungen, XXV(1), 166–171, 1969.
de Laat, A., de Gouw, J., Lelieveld, J., and Hansel, A.: Model analysis of trace gas measurements and pollution impact during INDOEX, J. Geophys. Res.-Atmos., 106(D22), 28 469–28 480, 2001.
Engel, A., Zondervan, I., Aerts, K., Beaufort, L., Benthien, A., Chou, L., Delille, B., Gattuso, J., Hailay, J., Heemann, C., Hoff-mann, L., Jacquet, S., Nejstgaard, J., Pizay, M., Rochelle-Newall, E., Schneider, U.,Terbrueggen, A., and Riebessell, U.: Testing the direct effect of CO2 concentration on a bloom of the coccol-ithophoroid Emiliania huxleyi in mesocosm experiments, Lim-nol. Oceanogr., 50(2), 493–507, 2005.
Field, C., Behrenfeld, M., Randerson, J., and Falkowski, P.: Primary production of the biosphere: Integrating terrestrial and oceanic components, Science, 281(5374), 237–240, 1998.
Gabric, A., Whetton, P., and Cropp, R.: Dimethylsulphide produc-tion in the subantarctic southern ocean under enhanced green-house conditions, Tellus B, 53(3), 273–287, 2001.
Galbally, I. and Kirstine, W.: The production of methanol by flow-ering plants and the global cycle of methanol, J. Atmos. Chem., 43(3), 195–229, 2002.
Guenther, A., Hewitt, C., Erickson, D., Fall, R., Geron, C., Graedel, T., Harley, P., Klinger, L., Lerdau, M., Mckay, W., Pierce, T., Scholes, B., Steinbrecher, R., Tallamraju, R., Taylor, J., and Zimmerman, P.: A global-model of natural volatile organic-compound emissions, J. Geophys. Res.-Atmos., 100(D5), 8873– 8892, 1995.
Heikes, B., Chang, W., Pilson, M., Swift, E., Singh, H., Guenther, A., Jacob, D., Field, B., Fall, R., Riemer, D., and Brand, L.: At-mospheric methanol budget and ocean implication, Global Bio-geochem. Cycles, 16(4), 1133–1146, 2002.
Huebert, B., Blomquist, B., Hare, J., Fairall, C., Johnson, J., and Bates, T.: Measurement of the sea-air DMS flux and transfer velocity using eddy correlation, Geophys. Res. Lett., 31(23), L23113,, doi:10.1029/2004GL021567 2004.
Jacob, D., Field, B., Jin, E., Bey, I., Li, Q., Logan, J., Yantosca, R., and Singh, H.: Atmospheric budget of acetone, J. Geophys. Res.-Atmos., 107(D10), 4100–4117, 2002.
Jacob, D., Field, B., Li, Q., Blake, D., de Gouw, J., Warneke, C., Hansel, A., Wisthaler, A., Singh, H., and Guenther, A.: Global budget of methanol: Constraints from atmospheric observations, J. Geophys. Res.-Atmos., 110(D8), 590–595, 2005.
Karl, T., Harley, P., Guenther, A., Rasmussen, R., Baker, B., Jar-dine, K., and Nemitz, E.: The bi-directional exchange of oxy-genated VOCs between a loblolly pine (Pinus taeda) plantation and the atmosphere, Atmos. Chem. Phys., 5, 3015–3031, 2005, http://www.atmos-chem-phys.net/5/3015/2005/.
Kettle, A. and Andreae, M.: Flux of dimethylsulfide from the oceans: A comparison of updated data seas and flux models, J.
Geophys. Res.-Atmos., 105(D22), 26 793–26 808, 2000. Kiene, R. P.: Microbial sources and sinks for methylated sulfur
compounds in the marine environment, in: Microbial growth on C1 Compounds, 15–33, edited by: Kelly, D. P. and Murrell, J. C., Intercept Ltd., London, 1993.
Lewis, A., Hopkins, J., Carpenter, L., Stanton, J., Read, K., and Pilling, M.: Sources and sinks of acetone, methanol, and ac-etaldehyde in North Atlantic marine air, Atmos. Chem. Phys., 5, 1963–1974, 2005,
http://www.atmos-chem-phys.net/5/1963/2005/.
Lindinger, W., Hansel, A., and Jordan, A.: Proton-transfer-reaction mass spectrometry (PTR-MS): on-line monitoring of volatile or-ganic compounds at pptv levels, Chem. Soc. Rev., 27(5), 347– 354, 1998.
Liss, P. and Mervilat, L.: Air-sea gas exchange rates: Introduction and synthesis, in: The Role of Air-Sea Exchange in Geochemical Cycling, edited by: Buat-Menard, P. and Reidel, D., Norwell, Mass., 1986.
Mao, H., Talbot, R., Nielsen, C., and Sive, B.: Controls on methanol and acetone in marine and continental atmospheres, Geophys. Res. Lett., 33(2), L02803–L02807, 2006.
Marandino, C., De Bruyn, W., Miller, S., Prather, M., and Saltzman, E.: Oceanic uptake and the global atmo-spheric acetone budget, Geophys. Res. Lett., 32(15), L15806, doi:10.1029/2005GL023285, 2005.
Marie, D., Brussaard, C. P. D., Partensky, F., and Vaulot, D.: Enu-meration of phytoplankton, bacteria and viruses in marine sam-ples, in: Current protocols in cytometry, edited by: Robinson, J. P., Darzynkiewicz, Z., Dean, P. N., Orfao, A., Rabinovitch, P., Tanke, H., and Wheeless, L., John Wiley & Sons, Chichester, pp. 11.11.1–11.11.15, 1999a.
Marie, D., Brussard, C., Thyrhaug, R.,Bratbak, G., and Vaulot, D.: Enumeration of marine viruses in culture and natural samples by flow cytometry, Appl. Environ. Microb., 65, 45–52, 1999b. Matsunaga, S., Mochida, M., Saito, T., and Kawamura, K.: In situ
measurement of isoprene in the marine air and surface seawa-ter from the wesseawa-tern North Pacific, Atmos. Environ., 36(39–40), 6051–6057, 2002.
McKeen, S., Gierczak, T., Burkholder, J., Wennberg, P., Hanisco, T., Keim, E., Gao, R., Liu, S., Ravishankara, A., and Fahey, D.: The photochemistry of acetone in the upper troposphere: A source of odd-hydrogen radicals, Geophys. Res. Lett., 24(24), 3177–3180, 1997.
Milne, P., Riemer, D., Zika, R., and Brand, L.: Measurement of vertical-distribution of isoprene in surface seawater, its chemical fate, and its emission from several phytoplankton monocultures, Mar. Chem., 48(3–4), 237–244, 1995.
Nguyen, B., Gaudry, A., Bonsang, B., and Lambert, G.: Re-evaluation of role of dimethyl sulfide in sulfur budget, Nature, 275(5681), 637–639, 1978.
Nguyen, B. C., Belviso, S., Mihalopoulos, N., Gostan, J., and Ni-val, P.: Dimethylsulfide production during natural phytoplankton blooms, Mar. Chem., 24, 133–141, 1988.
Northway, M., de Gouw, J., Fahey, D., Gao, R., Warneke, C., Roberts, J., and Flocke, F.: Evaluation of the role of heteroge-neous oxidation of alkenes in the detection of atmospheric ac-etaldehyde, Atmos. Environ., 38(35), 6017–6028, 2004. Olivier, J. G. J., Bouwman, A. F., Vandermass, C. W. M., and
research (EDGAR), Environ. Monit. Assess., 31(1–2), 93–106, 1994.
Palmer, P. and Shaw, S.: Quantifying global marine isoprene fluxes using MODIS chlorophyll observations, Geophys. Res. Lett., 32(9), L09805–L09810, 2005.
Salisbury, G., Williams, J., Holzinger, R., Gros, V., Mihalopou-los, N., Vrekoussis, M., Sarda-Esteve, R., Berresheim, H., von Kuhlmann, R., Lawrence, M., and Lelieveld, J.: Ground-based PTR-MS measurements of reactive organic compounds dur-ing the MINOS campaign in Crete, July–August 2001, Atmos. Chem. Phys., 3, 925–940, 2003,
http://www.atmos-chem-phys.net/3/925/2003/.
Sciare, J., Mihalopoulos, N., and Dentener, F.: Interannual variabil-ity of atmospheric dimethylsulfide in the southern Indian Ocean, J. Geophys. Res.-Atmos., 105(D21), 26 369–26 377, 2000. Shaw, S., Chisholm, S., and Prinn, R.: Isoprene production by
Prochlorococcus, a marine cyanobacterium, and other phyto-plankton, Mar. Chem., 80(4), 227–245, 2003.
Singh, H., Chen, Y., Staudt, A., Jacob, D., Blake, D., Heikes, B., and Snow, J.: Evidence from the Pacific troposphere for large global sources of oxygenated organic compounds, Nature, 410(6832), 1078–1081, 2001.
Singh, H., Chen, Y., Tabazadeh, A., Fukui, Y., Bey, I., Yantosca, R., Jacob, D., Arnold, F., Wohlfrom, K., Atlas, E., Flocke, F., Blake, D., Blake, N., Heikes, B., Snow, J., Talbot, R., Gregory, G., Sachse, G., Vay, S., and Kondo, Y.: Distribution and fate of selected oxygenated organic species in the troposphere and lower stratosphere over the Atlantic, J. Geophys. Res.-Atmos., 105(D3), 3795–3805, 2000.
Singh, H., Ohara, D., Herlth, D., Sachse, W., Blake, D., Brad-shaw, J., Kanakidou, M., and Crutzen, P.: Acetone in the at-mosphere – Distribution, Sources and Sinks, J. Geophys. Res.-Atmos., 99(D1), 1805–1819, 1994.
Singh, H., Salas, L., Chatfield, R., Czech, E., Fried, A., Walega, J., Evans, M., Field, B., Jacob, D., Blake, D., Heikes, B., Talbot, R., Sachse, G., Crawford, J., Avery, M., Sandholm, S., and Fuel-berg, H.: Analysis of the atmospheric distribution, sources, and sinks of oxygenated volatile organic chemicals based on mea-surements over the Pacific during TRACE-P, J. Geophys. Res.-Atmos., 109(D15), D15S07–D15S20, 2004.
Singh, H., Tabazadeh, A., Evans, M., Field, B., Jacob, D., Sachse, G., Crawford, J., Shetter, R., and Brune, W.: Oxygenated volatile organic chemicals in the oceans: Inferences and implications based on atmospheric observations and air-sea exchange models, Geophys. Res. Lett., 30(16), 1862–1867, 2003.
Tie, X., Guenther, A., and Holland, E.: Biogenic methanol and its impacts on tropospheric oxidants, Geophys. Res. Lett., 30(17), 1881–1885, 2003.
Williams, J.: Organic trace gases: An overview, Environ. Chem., 1, 125–136, 2004a.
Williams, J., Holzinger, R., Gros, V., Xu, X., Atlas, E., and Wal-lace, D.: Measurements of organic species in air and seawater from the tropical Atlantic, Geophys. Res. Lett., 31(23), L23S06, doi:10.1029/2004GL020012, 2004b.
Williams, J., Poschl, U., Crutzen, P., Hansel, A., Holzinger, R., Warneke, C., Lindinger, W., and Lelieveld, J.: An atmospheric chemistry interpretation of mass scans obtained from a proton transfer mass spectrometer flown over the tropical rainforest of Surinam, J. Atmos. Chem., 38(2), 133–166, 2001.
Williams, P. and Egge, J.: The management and behaviour of the mesocosms, Estuar Coast Shelf S., 46, 3–14, 1998.
Zhou, X. and Mopper, K.: Carbonyl-compounds in the lower ma-rine troposphere over the Caribbean sea and Bahamas, J. Geo-phys. Res.-Oceans, 98(C2), 2385–2392, 1993.