ACPD
12, 10381–10424, 2012Summer ammonia measurements in a densely populated
Mediterranean city
M. Pandolfi et al.
Title Page
Abstract Introduction
Conclusions References
Tables Figures
◭ ◮
◭ ◮
Back Close
Full Screen / Esc
Printer-friendly Version
Interactive Discussion
Discussion
P
a
per
|
Dis
cussion
P
a
per
|
Discussion
P
a
per
|
Discussio
n
P
a
per
|
Atmos. Chem. Phys. Discuss., 12, 10381–10424, 2012 www.atmos-chem-phys-discuss.net/12/10381/2012/ doi:10.5194/acpd-12-10381-2012
© Author(s) 2012. CC Attribution 3.0 License.
Atmospheric Chemistry and Physics Discussions
This discussion paper is/has been under review for the journal Atmospheric Chemistry and Physics (ACP). Please refer to the corresponding final paper in ACP if available.
Summer ammonia measurements in
a densely populated Mediterranean city
M. Pandolfi1, F. Amato2, C. Reche1, A. Alastuey1, R. P. Otjes3, M. J. Blom3, and
X. Querol1
1
Institute of Environmental Assessment and Water Research (IDAEA-CSIC), Barcelona, Spain
2
TNO, Built Environment and Geosciences, Dept. of Air Quality and Climate, Utrecht, The Netherlands
3
Energy Research Centre of the Netherlands, Department of Environmental Assessment, Petten, The Netherlands
Received: 26 January 2012 – Accepted: 11 April 2012 – Published: 20 April 2012
Correspondence to: M. Pandolfi (marco.pandolfi@idaea.csic.es)
ACPD
12, 10381–10424, 2012Summer ammonia measurements in a densely populated
Mediterranean city
M. Pandolfi et al.
Title Page
Abstract Introduction
Conclusions References
Tables Figures
◭ ◮
◭ ◮
Back Close
Full Screen / Esc
Printer-friendly Version
Interactive Discussion
Discussion
P
a
per
|
Dis
cussion
P
a
per
|
Discussion
P
a
per
|
Discussio
n
P
a
per
|
Abstract
Real-time measurements of ambient concentrations of gas-phase ammonia were per-formed in Barcelona (NE Spain) in summer between May and September 2011.
Two measurement sites were selected: one in an urban background traffic-influenced
area (UB) and the other in the historical city centre (CC). Levels of ammonia were 5
higher at CC (5.6±2.1 µg m−3or 7.5±2.8 ppbv) compared with UB (2.2±1.0 µg m−3or
2.9±1.3 ppbv). This difference is attributed to the contribution from non-traffic sources
such as waste containers, sewage systems, humans and open markets more dense in the densely populated historical city centre. Under high temperatures in summer these sources had the potential to increase the ambient levels of ammonia well above 10
the urban-background-traffic-influenced UB measurement station. Measurements were
used to assess major local emissions, sinks and diurnal evolution of NH3. The
mea-sured levels of NH3, especially high in the old city, may contribute to the high mean
an-nual concentrations of secondary sulfate and nitrate measured in Barcelona compared
with other cities in Spain affected by high traffic intensity. Ancillary measurements,
in-15
cluding PM10, PM2.5, PM1levels (Particulate Matter with aerodynamic diameter smaller
than 10 µm, 2.5 µm, and 1 µm), gases and black carbon concentrations and meteoro-logical data, were performed during the measurement campaign. The analysis of
spe-cific periods (3 special cases) during the campaign revealed that road traffic was a
sig-nificant source of NH3. However, its effect was more evident at UB compared with CC
20
where it was masked given the high levels of NH3from non-traffic sources measured
in the old city. The relationship between SO24− daily concentrations and gas-fraction
ammonia (NH3/(NH3+NH+4)) revealed that the gas-to-phase partitioning (volatilization
or ammonium salts formation) also played an important role in the evolution of NH3
ACPD
12, 10381–10424, 2012Summer ammonia measurements in a densely populated
Mediterranean city
M. Pandolfi et al.
Title Page
Abstract Introduction
Conclusions References
Tables Figures
◭ ◮
◭ ◮
Back Close
Full Screen / Esc
Printer-friendly Version
Interactive Discussion
Discussion
P
a
per
|
Dis
cussion
P
a
per
|
Discussion
P
a
per
|
Discussio
n
P
a
per
|
1 Introduction
Atmospheric ammonia (NH3) is among the most abundant nitrogen compounds in the
atmosphere and it plays an important role in the neutralization of atmospheric acids to
form ammonium salts, preferentially ammonium sulfate ((NH4)2SO4) and ammonium
bisulfate (NH4HSO4) from sulfuric acid. Excess of ammonia is then available to form
5
ammonium nitrate (NH4NO3) from nitric acid or ammonium chloride (NH4Cl) from
hy-drochloric acid.
The formed ammonium salts are relatively stable particles with a longer lifetime (1– 15 days, Sheppard et al., 2011; Aneja et al., 2000) compared with gaseous ammo-nia which is quickly dry deposited relatively close to the sources (Fowler et al., 1998; 10
Phillips et al., 2004; Clarisse et al., 2009) thus allowing the long range transport of the acidic pollutants to remote areas (Aneja et al., 2000).
One of the main concerns is related with the input of reactive nitrogen species to the terrestrial ecosystems and marine environments by nitrogen (N) deposition leading to possible eutrophication and acidification of the ecosystem with changes in animal 15
and plant populations and degradation of water and habitat quality (Flechard et al.,
2011). Deposition of reactive N may be either wet when NH+4 particles are washed out
in precipitation or dry when NH3is directly deposited without chemical transformations
(Sheppard et al., 2011; Phillips et al., 2004). High levels of atmospheric ammonia may
cause adverse health effects by formation of fine particulate matter (PM1 and PM2.5)
20
(Erisman and Sutton, 2008; Brunekreef and Holgate, 2002; Ellis et al., 2011).
It is widely recognized that the reactive nitrogen available to the ecosystem has in-creased dramatically over the past 50 yr since humans in the early 20th century started
to convert unreactive gaseous N2 into ammonia as a basis for fertilizers used for food
production (Van Der Hoek, 1998; Sutton et al., 1993; Erisman et al., 2007, 2008; Eris-25
man and Sutton, 2008). Overall, more than 80 % of the chemical production of NH3is
used to produce fertilizer in the forms of ammonium nitrate, urea, and so on (Erisman
ACPD
12, 10381–10424, 2012Summer ammonia measurements in a densely populated
Mediterranean city
M. Pandolfi et al.
Title Page
Abstract Introduction
Conclusions References
Tables Figures
◭ ◮
◭ ◮
Back Close
Full Screen / Esc
Printer-friendly Version
Interactive Discussion
Discussion
P
a
per
|
Dis
cussion
P
a
per
|
Discussion
P
a
per
|
Discussio
n
P
a
per
|
emission in Europe with livestock being the largest category in its emission inventory
(EEA Report, 2011). As a result, the scale of the environmental effects of ammonia
emissions extended over the years from a few hotspots to the whole of Europe (Eris-man and Sutton, 2008).
Other sources of NH3 include animal excreta, biomass burning, industries (mainly
5
manufacture of NH3 and N containing fertilizers), coal burning, human breath, sweat
and smoking, pets, sewage systems, wastes and vehicle emissions (Sutton et al., 2000). Globally these sources form a minor part of the emissions but they might be relevant locally playing the greater role in ammonia emissions. At urban level for ex-ample there is a growing concern related with the emissions of ammonia after the 10
introduction of gasoline-powered vehicles equipped with three-way catalytic converters (Cape et al., 2004) and diesel-powered vehicles adopting selective catalytic reduction (SCR) system (Kean et al., 2009). In the first case, ammonia is the product of NO
re-duction on the catalyst surface which, beyond the formation of molecular N2, leads to
ammonia in motor vehicle exhaust. In the second case ammonia is used as reagent 15
and supplied to the catalyst system by the injection of urea into the exhaust which then undergoes thermal decomposition and hydrolysis into ammonia.
In recent years few studies have been conducted to determine the NH3 emission
factors from vehicles by means of tunnel or dynamometer experiments showing the increased ammonia emissions from catalyzed vehicles (Moeckli et al., 1996; Fraser 20
and Cass, 1998; Kean and Harley, 2000; Durbin et al., 2004; Burgard et al., 2006; Kean et al., 2009). Contextually, measurements of ambient ammonia concentrations at urban level have been recently presented in few publications (Nowak et al., 2002; Perrino et al., 2002; Bari et al., 2003; Lin et al., 2006; Edgerton et al., 2007; Saylor et al., 2010; Nowak et al., 2010; Ianiello et al., 2010; Meng et al., 2011; Gong et al., 25
2011, among others).
These studies agreed with the fact that the concentrations and evolution of ambient
NH3 at urban level were influenced by traffic emissions together with other important
ACPD
12, 10381–10424, 2012Summer ammonia measurements in a densely populated
Mediterranean city
M. Pandolfi et al.
Title Page
Abstract Introduction
Conclusions References
Tables Figures
◭ ◮
◭ ◮
Back Close
Full Screen / Esc
Printer-friendly Version
Interactive Discussion
Discussion
P
a
per
|
Dis
cussion
P
a
per
|
Discussion
P
a
per
|
Discussio
n
P
a
per
|
boundary layer deep and mixing, other local or regional NH3 emissions, dry
depo-sition, and gas-to-particle partitioning. These factors may mask in some cases the
effect of vehicle emissions on the measured NH3 concentrations. For example Meng
et al. (2011) and Gong et al. (2011) measured NH3 concentrations in the urban
ar-eas, respectively of Beijing (annual averages between 18.5–23.5 ppb) and Houston 5
(2.4 ppb in winter and 3.1 ppb in summer) showing that correlations between NH3
con-centrations and traffic tracers, such as CO and/or NOx, were observed in winter but
not in summer thus suggesting that other non-traffic sources became more important
during the warm season (i.e. variations in local or regional emission sources, changes
in vehicular catalytic converter performance, NH3emissions from dew evaporation with
10
increasing temperature in summer or natural release of NH3 from vegetation and soil
through photosynthetic processes). Perrino et al. (2002) also identified vehicles as an
important source of ammonia at many traffic sites in Rome (mean NH3concentrations
between 13.5 µg m−3and 21.6 µg m−3) with higher NH
3/CO ratio in summer compared
with winter as a consequence of the evaporation of ammonia from particulates and from 15
various non-traffic sources present in the selected urban area. Ianiello et al. (2010)
compared the concentrations of NH3 measured in Beijing (5.47 µg m−3 in winter and
25.39 µg m−3 in summer) with NOx, CO and PM2.5 and concluded that traffic was an
important source of NH3. Nevertheless, the mean NH3 concentration was around five
times higher in summer than in winter likely due to agricultural emissions enhanced 20
under higher atmospheric temperatures (Ianniello et al., 2010). Saylor et al. (2010)
analyzed the weekday versus weekend differences in composite hourly mean diurnal
profiles of NH3 at an urban site (Atlanta) during July–December 2007 (mean NH3 at
urban site: 1.3 ppb) and concluded that mobile sources had a measurable but relatively
small impact on NH3 indicating the interaction of local NH3 emissions and dry
depo-25
sition with the evolution of the diurnal and nocturnal boundary layer as concomitant
important phenomenon affecting the concentrations of NH3.
Concomitance of different NH3sources was also presented by Nowak et al. (2006)
ACPD
12, 10381–10424, 2012Summer ammonia measurements in a densely populated
Mediterranean city
M. Pandolfi et al.
Title Page
Abstract Introduction
Conclusions References
Tables Figures
◭ ◮
◭ ◮
Back Close
Full Screen / Esc
Printer-friendly Version
Interactive Discussion
Discussion
P
a
per
|
Dis
cussion
P
a
per
|
Discussion
P
a
per
|
Discussio
n
P
a
per
|
0.4 to 13 ppb NH3) in summer presented a morning peak related with the rush hours
and an afternoon peak related with non-traffic sources such as NH3emissions from soil
or NH3release from secondary nitrate particle volatilization. Similarly, Lin et al. (2006)
and Bari et al. (2003) associated the summer increase in the concentrations of NH3
measured at urban sites in Central Taiwan (annual mean 8.5 µg NH3m−
3
) and New York 5
(3–5 µg NH3m−
3
), respectively, with the higher volatility of NH4NO3 particulate under
typical summer temperatures. Some of these studies also reported significant positive
differences in NH3levels between traffic and urban background stations (Perrino et al.,
2002) or between urban and rural stations (Meng et al., 2011; Edgerton et al., 2007;
Perrino et al., 2002) thus confirming traffic and human activities as potentially important
10
sources of NH3at urban levels.
Maybe as a consequence of the difficulties in distinguishing between the different
NH3 sources, ammonia emissions from engines and vehicles are not yet regulated,
but NH3 is listed as a toxic air pollutant by the EU and emission ceilings are defined
for each member state (EC, 2001). In Spain, a new regulation has been implemented 15
on 28 January 2011 (Royal Decree 102/2011). This national decree establishes the requirement to measure ammonia levels at five rural background stations covering the
country and in one traffic site in cities with more than 500 000 inhabitants. The critical
level for NH3has been established in 8 µg m−3 as an annual mean (air quality
guide-lines for Europe) although recent studies reported important effects on vegetation when
20
ammonia levels are above 3 µg m−3(Cape et al., 2009).
In this study we present the results of a measurement campaign performed in Barcelona (NE Spain) between May and September 2011 and mainly aimed: (a) to
study the differences in the concentrations and dynamics of ambient ammonia at two
urban sites with different characteristics in term of NH3 emission sources; (b) to asses
25
major sources and sinks affecting the daily evolution of NH3concentrations; (c) to
un-derstand the reasons for the high concentrations of secondary sulfate particles usu-ally observed in Barcelona in summer compared with other urban and industrial sites
ACPD
12, 10381–10424, 2012Summer ammonia measurements in a densely populated
Mediterranean city
M. Pandolfi et al.
Title Page
Abstract Introduction
Conclusions References
Tables Figures
◭ ◮
◭ ◮
Back Close
Full Screen / Esc
Printer-friendly Version
Interactive Discussion
Discussion
P
a
per
|
Dis
cussion
P
a
per
|
Discussion
P
a
per
|
Discussio
n
P
a
per
|
and daily evolutions at the two selected sites in Barcelona (one in the historical city
centre and one in a traffic-influenced urban background area) will be presented and
discussed.
2 Methods
2.1 Sampling sites
5
The measurements of ammonia and ancillary data were performed at two
measure-ment sites in the city of Barcelona (NE Spain) (Fig. 1). The first site (UB; 41◦23′24.01′′N
02◦06′58.06′′E; 68 m a.s.l., 1 m a.g.l.) is a urban background site influenced by
vehic-ular emissions from one of the main avenues of the city (Diagonal Avenue) located at
a distance of around 300 m with a traffic density of 132 000 vehicles per day (around
10
60 % diesel in vehicle fleet; Council of Barcelona, Serveis de Mobilitat, 2009). The
second measurement site (CC; 41◦22′58.18′′N 02◦10′08.59′′E; 30 m a.s.l.) is placed
on the roof of a 20 m height building in the densely populated historic city centre of
Barcelona, less influenced by traffic emissions but dense with commercial activities
(markets, restaurants, pubs and so on) and people wandering around the old city 15
and mainly in summer when tourism is high. The two measurement sites were around 4.7 km far.
2.2 Measurements
The measurements of NH3were implemented with a set of ancillary hourly
measure-ments as gaseous pollutants (NO2, NO, O3, SO2), particulate matter (PMx) and black
20
carbon (BC) concentrations, meteorological data (wind speed and direction, temper-ature, humidity, solar radiation and pressure) and daily mean concentrations of
sec-ondary inorganic aerosols (NH+4, SO2−
4 and NO
−
3). Measurements were performed at
ACPD
12, 10381–10424, 2012Summer ammonia measurements in a densely populated
Mediterranean city
M. Pandolfi et al.
Title Page
Abstract Introduction
Conclusions References
Tables Figures
◭ ◮
◭ ◮
Back Close
Full Screen / Esc
Printer-friendly Version
Interactive Discussion
Discussion
P
a
per
|
Dis
cussion
P
a
per
|
Discussion
P
a
per
|
Discussio
n
P
a
per
|
2011. Not all the parameters were monitored at both sites, thus the concentrations of
NH3, BC and meteorological data were determined for both measurement sites while
the concentrations of PMx(PM10, PM2.5, PM1) and gaseous pollutants were measured
only at UB site.
2.2.1 Ammonia measurements
5
On-line measurements of gas-phase ammonia (NH3) on 1-min base were performed
by means of two gas-phase-ammonia-measuring instruments (AiRRmonia; http://www. mechatronics.nl) (Erisman et al., 2001; Wyers et al., 1993). The instrument has the
potential to detect NH3concentrations from 0.1 µg m−3
up to 100 µg m−3
in real time and has shown good performances during a field inter-comparison campaign in Scotland 10
(von Bobrutzki et al., 2010).
The instrument uses a gas-permeable PTFE (polytetrafluoroethylene) membrane to
selectively permeate the ammonia from the air flow (1 l min−1) into the stripping solution
where NH3is converted to NH+4. Otjes and Erisman (1999) showed that the ammonium
contained in ammonium nitrate and sulfate particles is not retained by the sampling 15
membrane and less than 1 % and 3 % of (NH4)2SO4 and NH4NO3, respectively are
captured. The pH of the stripping solution is raised by addition of sodium hydroxide
(NaOH) to form molecular NH3which is transferred through a second PTFE membrane
in the detector block into a stream of pure deionised water where the NH3 is reverted
to NH+4. The NH+4 concentrations are then determined by a conductivity measurement
20
of the water and calibration is made using aqueous NH+4 standard solutions. During
the measurement campaign both AiRRmonias were calibrated approximately once per week.
2.2.2 Ancillary measurements
Hourly levels of PM10, PM2.5 and PM1 at UB were continuously measured by means
25
ACPD
12, 10381–10424, 2012Summer ammonia measurements in a densely populated
Mediterranean city
M. Pandolfi et al.
Title Page
Abstract Introduction
Conclusions References
Tables Figures
◭ ◮
◭ ◮
Back Close
Full Screen / Esc
Printer-friendly Version
Interactive Discussion
Discussion
P
a
per
|
Dis
cussion
P
a
per
|
Discussion
P
a
per
|
Discussio
n
P
a
per
|
180). Then the levels of PM were corrected by means of standard 24 h PM gravimetric measurements performed twice per week with high volume samplers (DIGITEL and
MCV at 30 m3h−1) with appropriate (PM10, PM2.5and PM1) cut-offinlets.
The measurements of the ambient concentrations of black carbon (BC) were per-formed at UB by means of a MAAP instrument (Multi Angle Absorption Photometer, 5
model 5012, Thermo) and at CC by using an aethalometer (microAeth Model AE51, Magee Scientific). With the MAAP the content of BC were continuously determined by simultaneously measuring the optical absorption and scattering of light by the particles collected on the filter tape (M ¨uller et al., 2011). The Magee aethalometer is a small and portable monitor with a Teflon coated borosilicate glass fibre filter where particles 10
were captured. The aethalometer detects changes in the optical absorption of the light transmitted through the filter and calculates the BC load. Filter inside the aethalometer was replaced every day in order to prevent saturation.
Finally, conventional analyzers were used for measurements of levels of gaseous
pollutants at UB (Thermo Scientific, Model 42i for NOx and MCV S.A., model 48AUX
15
for O3) and meteorological data were collected at both UB and CC by means of
mete-orological stations.
3 Results
3.1 AiRRmonia intercomparison
The two AiRRmonia instruments deployed at UB and CC sites were intercompared 20
before the measurement campaign in order to assure the quality of the intercomparison
between the NH3concentrations measured at both measurement sites. Figure 2 shows
the results of the intercomparison performed between 6 May and 11 May at UB site based on hourly data.
As reported in the Fig. 2 the correlation between the two instruments was very good 25
ACPD
12, 10381–10424, 2012Summer ammonia measurements in a densely populated
Mediterranean city
M. Pandolfi et al.
Title Page
Abstract Introduction
Conclusions References
Tables Figures
◭ ◮
◭ ◮
Back Close
Full Screen / Esc
Printer-friendly Version
Interactive Discussion
Discussion
P
a
per
|
Dis
cussion
P
a
per
|
Discussion
P
a
per
|
Discussio
n
P
a
per
|
3.2 General features
Figure 3 shows the time series of NH3, BC, PM1, PM2.5−10 and gaseous pollutant
concentrations and meteorological data available at CC and UB measurement stations. The black dashed boxes named sc1–sc3 highlight periods considered as special cases and discussed in detail in the following paragraphs.
5
As reported in Fig. 3 some measurements were sporadically not available because
of technical problems. This is the case of NH3at UB from 19 May to 9 June and from
12 August to 15 August, BC at UB after 20 August, gases concentrations and meteo-rological data at UB from 22 June to 27 June and from 20 June to 5 July, respectively.
Table 1 shows the statistics for the measurements performed at both sites report-10
ing sampling periods, percentage of available measurements on hourly base, means, standard deviations, 25th, 50th (i.e. medians) and 75th percentiles, minimum and max-imum values. Table 1 also reports the statistics for the UB station averaged over the CC sampling period, i.e. from 13 May to 28 June.
On average the levels of NH3 at CC station were higher compared with UB. Mean
15
NH3levels of 5.6±2.1 µg m−
3
(7.5±2.8 ppbv) and 2.2±1.0 µg m−3(2.9±1.3 ppbv) were
measured at CC and UB, respectively. Over the same CC sampling period (13 May–28
June) the mean NH3concentration at UB was 2.6±1.1 µg m−3, close to the mean value
obtained by averaging all the NH3 data available for UB station. The minimum and
maximum NH3concentrations at CC station on hourly base were 1.8 µg m−
3
(2.4 ppbv) 20
and 16.2 µg m−3 (21.6 ppbv), respectively, while 0.2 µg m−3 (0.27 ppbv) (or 0.5 µg m−3
over the CC sampling period; Table 1) and 10.6 µg m−3 (14.1 ppbv) were, respectively
measured at UB site. The Black Carbon (BC) concentration at UB (1665±1158 ng m−3
over the same CC sampling period) was higher compared with the mean BC
concen-tration registered at CC (1190±1059 ng m−3) where higher NH3 concentrations were
25
ACPD
12, 10381–10424, 2012Summer ammonia measurements in a densely populated
Mediterranean city
M. Pandolfi et al.
Title Page
Abstract Introduction
Conclusions References
Tables Figures
◭ ◮
◭ ◮
Back Close
Full Screen / Esc
Printer-friendly Version
Interactive Discussion
Discussion
P
a
per
|
Dis
cussion
P
a
per
|
Discussion
P
a
per
|
Discussio
n
P
a
per
|
and the main avenue (Parallel Ave.) close to the Raval area (CC site; Fig. 1) was high from around 05:00 GMT to 19:00 GMT at both sites. However, the mean number of vehicles at UB was almost twice compared with CC. Thus, by comparing the CC and UB measurement sites in terms of number of vehicles and BC concentrations it can
be deduced that an important contribution to the higher NH3concentrations measured
5
at CC came from other sources than traffic. A measurement campaign with passive
NH3 samplers performed at different sites in Barcelona (Reche et al., 2012) showed
that humans, waste containers and sewage systems were potential important sources
of NH3in the historical city centre. These sources are especially dense in the old city
where the population density is also high. Under high temperatures in summer these 10
sources have the potential to increase the ambient levels of ammonia at CC well above
the urban-background-traffic-influenced UB measurement station. Moreover, the urban
design of the old city of Barcelona with narrow streets also favored the accumulation of
NH3 preventing the dispersion of air pollutants. Finally, the fact that the lowest hourly
NH3concentration at CC was 1.8 µg m−
3
also demonstrates the presence of a relatively 15
high background of ammonia in the old city. The difference between the NH3
concen-trations between both sites was around 3 µg m−3 (4 ppbv) which can be seen as the
minimum mean contribution from non-traffic sources affecting CC site.
The levels of PM10, PM2.5and PM1 measured at UB were 25.2±8.2 µg m−3, 19.1±
7.1 µg m−3 and 13.6±5.1 µg m−3, respectively during the period 6 May–7 September.
20
Amato et al. (2009) reported concentrations of PM10, PM2.5 and PM1 of 40.3 µg m−
3
,
27.7 µg m−3and 17.3 µg m−3during the period 2003–2007 in Barcelona. The relatively
low PM concentrations reported in this study were due to the atmospheric conditions typically observed in summer in the Western Mediterranean Basin (WMB) character-ized by higher dispersion of pollutants in the atmosphere at a local scale due to higher 25
ACPD
12, 10381–10424, 2012Summer ammonia measurements in a densely populated
Mediterranean city
M. Pandolfi et al.
Title Page
Abstract Introduction
Conclusions References
Tables Figures
◭ ◮
◭ ◮
Back Close
Full Screen / Esc
Printer-friendly Version
Interactive Discussion
Discussion
P
a
per
|
Dis
cussion
P
a
per
|
Discussion
P
a
per
|
Discussio
n
P
a
per
|
The mean concentrations of NO, NO2, O3 and SO2 during the UB measurement
period (6 May–7 September) were around 5, 24, 63, 2 µg m−3, respectively and the
mean T, RH, precipitation, solar radiation and wind speed were similar at both sites
(Table 1). Relatively high mean temperatures around 22–24◦C were measured during
the measurement campaign with relative humidity (RH) around 73 % and 65 % at UB 5
and CC, respectively (the RH mean value at UB over the CC sampling period was
70 %). A slightly higher wind speed at CC (2.1 m s−1) was observed compared with UB
(1.9 m s−1). Differences in meteorological data between UB and CC were mainly due
to the distance between the measurement sites (Fig. 1). The measurement period was on average sunny with sporadic rain events resulting in a total of 47 h (1.6 %) at UB 10
and 60 h (5.5 %) at CC with mm of rain per hour ranging from 0.1 to around 14 (highest value registered at CC).
3.3 Daily cycles
Figure 5 shows the mean daily cycles of NH3and ancillary data measured at CC and
UB measurement sites and averaged over the whole measurement periods available 15
at both stations. Thus, Fig. 5a–c show the daily cycles of NH3and BC concentrations,
and wind speed and direction at CC averaged over the 13 May–28 June period, while Fig. 5d–n show the mean daily cycles at UB averaged over the 6 May–7 September
period. In Fig. 5a the daily cycle of NH3 concentrations measured at UB (black lines)
over both the UB and CC measurement periods were presented with a different scale
20
(right-hand y-axes in Fig. 5a) for better comparing the dynamic of NH3at both stations.
The daily cycles of relative humidity (Fig. 5k), temperature (Fig. 5m) and solar radiation (Fig. 5n) measured at UB were used as reference for both sites while wind data were reported separately for the two sites.
We will refer to the Fig. 5 in order to not only separately describe the characteristics 25
of ammonia at UB and CC but also to study the differences in the daily evolution of NH3
ACPD
12, 10381–10424, 2012Summer ammonia measurements in a densely populated
Mediterranean city
M. Pandolfi et al.
Title Page
Abstract Introduction
Conclusions References
Tables Figures
◭ ◮
◭ ◮
Back Close
Full Screen / Esc
Printer-friendly Version
Interactive Discussion
Discussion
P
a
per
|
Dis
cussion
P
a
per
|
Discussion
P
a
per
|
Discussio
n
P
a
per
|
In general, comparisons between different measurement sites should be done
ap-proximately over the same measurement period in order to avoid any bias due to pos-sible changes in meteorological conditions or sources characteristics. However, as
re-ported in Table 1, the differences between the concentrations of NH3 and ancillary
data collected at UB and averaged over the whole UB period (6 May–7 September) or 5
over the CC period (13 May–28 June) were relatively small thus allowing the
compar-ison between the two sites over different measurement periods. The feasibility of this
approach is further demonstrated in the Supplement S1 showing that the differences
between the concentrations and daily cycles of data collected at UB and averaged
over the two different measurement periods were relatively small. Differences were
ob-10
served mainly for wind speed and direction. As reported in the Fig. 5c, f the sea breeze at CC over the period 13 May–28 June developed around 07:00 GMT while at UB (6 May–7 September) it developed at around 08:00 GMT. As reported in the Supplement
S1 this difference was due to the different measurement periods thus the sea breeze
at UB also developed at around 07:00 GMT after averaging the UB wind data over the 15
CC measurement period. Consequently, wind data were reported separately for both stations.
3.3.1 NH3levels at the old city (CC site)
The levels of NH3 at CC site (Fig. 5a, red dots) showed a daily cycle driven mainly
by the direction and velocity of the wind. The lowest wind velocities were measured 20
between 00:00 and 06:00 GMT with scalar and vectorial means lower than 1.6 m s−1
and 0.2 m s−1
, respectively. The vectorial means, which are weighted by the directions of the wind, reflected general stagnant conditions at night/early morning with winds blowing mainly from N–NE (black triangles in Fig. 5c) with low and rather constant velocities within a shallow nocturnal boundary layer. Under low dispersion conditions 25
the ambient concentrations of NH3 and BC measured at CC accumulated with time
reaching their highest mean values of more than 7.5 µg m−3 and 2000 ng m−3,
ACPD
12, 10381–10424, 2012Summer ammonia measurements in a densely populated
Mediterranean city
M. Pandolfi et al.
Title Page
Abstract Introduction
Conclusions References
Tables Figures
◭ ◮
◭ ◮
Back Close
Full Screen / Esc
Printer-friendly Version
Interactive Discussion
Discussion
P
a
per
|
Dis
cussion
P
a
per
|
Discussion
P
a
per
|
Discussio
n
P
a
per
|
vehicles increased by around 200 % between 01:00 GMT and 06:00 GMT (from 550
and 1640 ng m−3) while the medians NH3concentrations increased by less than 20 %
(from 5.9 µg m−3to 7.1 µg m−3). Thus traffic was more effective in increasing the levels
of BC above the values measured at night rather than those of NH3.
Starting from 07:00 GMT the increasing solar radiation (Fig. 5n) and temperature 5
(Fig. 5m) activated the sea breeze characterized by winds blowing, with increasing ve-locities, from the S–SE direction (from the Sea) reaching relatively constant values of
more than 3 m s−1(scalar) and 2 m s−1(vectorial) between 11:00 and 15:00 GMT. The
cleansing effect of the sea breeze led to the observed gradual reduction in the
concen-trations of NH3and BC observed in the morning. The NH3and BC median
concentra-10
tions reduced from 6.5 µg m−3to 4.4 µg m−3 (∼30 %) and from around 1500 ng m−3 to
700 ng m−3(∼50 %) from 07:00 to 12:00 GMT, respectively. The lower relative
reduc-tion of NH3median concentrations compared with BC was likely due to the increasing
evaporation of NH3 from other fugitive urban sources which contrasted the cleansing
effect of the breeze and the possible depletion of NH3 due to the formation of
ammo-15
nium salts.
The concentrations of ammonia reached their minimum mean value (4.1 µg m−3) at
18:00 GMT with fairly constant mean concentrations around 4–4.5 µg m−3observed
be-tween 13:00 and 18:00 GMT. The lowest BC mean concentrations (bebe-tween 590 and
640 ng m−3) were instead observed around 15:00–16:00 GMT when the sea breeze
20
was fully developed. Then, the concentrations of BC increased again starting from 16:00 GMT reflecting the decreasing trend of wind velocities and consequent
accumu-lation of BC emissions from traffic which was still high at 16:00 GMT (Fig. 4).
The reason for the longer tile toward decreasing NH3values (from 07:00 to 18:00
GMT) compared with BC (from 07:00 to 16:00 GMT) was likely due to the depletion of 25
NH3 in favor of the formation of ammonium salts during the whole afternoon. Starting
from 19:00 GMT the concentrations of NH3 accumulated again with time as wind
ACPD
12, 10381–10424, 2012Summer ammonia measurements in a densely populated
Mediterranean city
M. Pandolfi et al.
Title Page
Abstract Introduction
Conclusions References
Tables Figures
◭ ◮
◭ ◮
Back Close
Full Screen / Esc
Printer-friendly Version
Interactive Discussion
Discussion
P
a
per
|
Dis
cussion
P
a
per
|
Discussion
P
a
per
|
Discussio
n
P
a
per
|
On average during the measurement campaign at CC site low correlation was
ob-served between the hourly concentrations of NH3 and BC (Fig. 6a; R
2
=0.21). Low
R2 (0.26) was also observed by correlating the hourly concentrations of NH3 and BC
between 03:00 and 06:00 GMT (around 170 points, not shown) when traffic intensity
(Fig. 4) and vehicle emissions increased under stagnant conditions at night. The ob-5
served poor correlation was a consequence of the higher number of sources and sinks
affecting the ambient concentrations of ammonia compared with BC. Poor correlation
between the hourly concentrations of NH3and BC was observed also at UB (Fig. 6b)
while BC correlated well (R2>0.9) with NO2, being both components emitted mostly
by passing vehicles (Fig. 6c). 10
A further evidence of the fact that non-traffic sources dominated the levels of
ammo-nia at CC is given from Fig. 5a,b. The BC concentrations showed the typical bimodal
diurnal cycle driven by increasing (morning) or decreasing (night) emissions from traffic
coupled with meteorological conditions favoring the accumulation (low wind and shal-low planetary boundary layer (PBL) at night) or dispersion (sea breeze and higher PBLs 15
during the day) of pollutants. The NH3 concentrations also showed the same peak in
the early morning due to the start of the sea breeze after the stagnant nocturnal
condi-tions. However, at night the NH3concentrations increased monotonically from 19:00 to
06:00 GMT without showing the second peak around 20:00 GMT. The constant
noctur-nal NH3 increase observed at CC was not detected at UB where the NH3levels were
20
rather constant at night with a slight but detectable increase around 20:00 GMT due to
traffic emissions (Fig. 5d). The lack of equilibrium between the concentrations of NH3
and all possible sources and sinks at CC, under relatively stable nocturnal conditions with fairly constant temperature and humidity, suggested the presence of active
non-traffic sources of ammonia at CC at night likely related with the night life in the historical
25
city centre of Barcelona in summer. A certain degree of equilibrium for the
concentra-tions of NH3with time was instead observed when the sea breeze was fully developed
blowing with high and relatively constant velocities (Fig. 5c). Mean NH3concentrations
ACPD
12, 10381–10424, 2012Summer ammonia measurements in a densely populated
Mediterranean city
M. Pandolfi et al.
Title Page
Abstract Introduction
Conclusions References
Tables Figures
◭ ◮
◭ ◮
Back Close
Full Screen / Esc
Printer-friendly Version
Interactive Discussion
Discussion
P
a
per
|
Dis
cussion
P
a
per
|
Discussion
P
a
per
|
Discussio
n
P
a
per
|
on the 120 hourly data available between 12:00 and 14:00 GMT. The NH3equilibrium
conditions at these times are better represented in Fig. 7 showing the relationship
be-tween the frequency distribution of scalar wind velocities and the concentrations of NH3
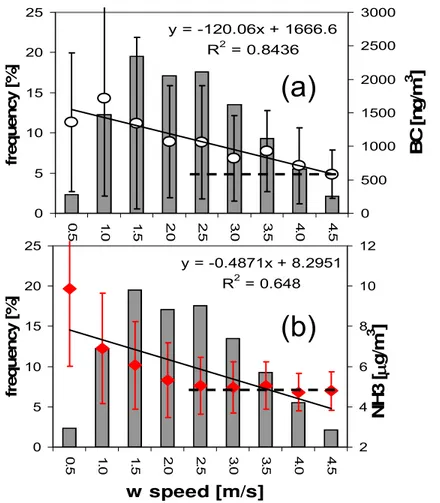
(Fig. 7a) and BC (Fig. 7b). Given the low occurrence for wind velocities higher than
4.5 m s−1 the frequency distribution of hourly wind velocities in Fig. 7 was calculated
5
for values between 0 m s−1 and 4.5 m s−1(99.3 % of occurrence). Figure 7 shows that
the highest BC and NH3 concentrations were on average measured under low wind
speeds and viceversa. Moreover, for wind speed higher than around 2.5 m s−1the
con-centrations of NH3were on average constant (horizontal dashed black line in Fig. 7),
while BC decreased almost monotonically (R2>0.8). This demonstrates that besides
10
meteorology different sources and processes were affecting the concentrations and
evolution of NH3at CC during the measurement campaign.
3.3.2 NH3levels at the urban background (UB site)
As for the CC site the concentrations of aerosol components and gaseous pollutants measured at UB showed daily cycles driven mainly by meteorology. The concentra-15
tions of NO2 (Fig. 5h) and BC (Fig. 5e) which as already noted were highly
corre-lated at UB (Fig. 6c), increased in the early morning up to around 08:00 GMT with a peak around 05:00–06:00 GMT mirroring the rush hours in the Diagonal Avenue.
Then, the levels of traffic related pollutants decreased with time, as the velocity of
the wind increased under the sea breeze circulation (Fig. 5f), reaching their minimum 20
value around 13:00 GMT when the sea breeze was fully developed. Subsequently, traf-fic emissions accumulated again as wind velocity decreased and the concentrations of BC and NH3 showed a second peak at around 20:00 GMT. Thus the daily cycles of BC at UB and CC were fairly similar reflecting the similarities in the daily evolution of vehicles number and meteorology at both sites.
25
The concentrations of ammonia at UB increased in the morning from 06:00 GMT up
ACPD
12, 10381–10424, 2012Summer ammonia measurements in a densely populated
Mediterranean city
M. Pandolfi et al.
Title Page
Abstract Introduction
Conclusions References
Tables Figures
◭ ◮
◭ ◮
Back Close
Full Screen / Esc
Printer-friendly Version
Interactive Discussion
Discussion
P
a
per
|
Dis
cussion
P
a
per
|
Discussion
P
a
per
|
Discussio
n
P
a
per
|
levels at UB. As reported in Fig. 5 the concentrations of NH3 presented a relatively
large peak in the morning compared with the concentrations of NH3 at CC (Fig. 5a)
with relatively constant values from 07:00 to 10:00 GMT. The NH3increase in the early
morning at UB was likely due to the concomitance of different factors: traffic
emis-sions, volatilization of secondary particles formed during the night under stagnant and 5
cooler atmospheric conditions with the beginning of the solar activity around 06:00
GMT (Fig. 5o), transport of background NH3from the old city and the Diagonal Avenue
when sea breeze developed, or natural release of NH3 from vegetation and soil may
have account for the observed morning increase in NH3concentrations at UB. All these
factors increased the levels of ammonia from around 2.1 µg m−3(or 2.4 µg m−3over the
10
CC site sampling period) at 05:00 GMT up to 2.7 µg m−3
(or 3.5 µg m−3
) at 09:00 GMT. Thus, an increase with respect to the values measured at night was clearly detectable at UB but it may have been masked at CC where the concentrations of ammonia were continuously increasing at night-early morning for the aforementioned reasons. More-over, at CC a sudden entrance of clean air was guaranteed with the beginning of the 15
sea breeze at 07:00 GMT given the proximity of the CC station to the sea causing the fast reduction of pollutants concentrations observed at CC.
Traffic emissions from the close Diagonal Avenue were in part responsible for the
observed increase in NH3levels in the morning and in the evening at UB. We will show
in the next paragraph that the concentrations of NH3 at UB showed a clear bimodal
20
diurnal cycle as BC (or NO2) under specific atmospheric conditions favoring the
accu-mulation of pollutants but that these conditions were not dominating during the summer measurement campaign.
Figure 5j shows that the daily cycles of NH3and PM1were anticorrelated in the early
morning with PM1concentrations decreasing from 06:00 GMT (before the development
25
of the sea breeze) despite the increase in the concentrations of traffic tracers (BC, NO,
NO2) likely due to particle volatilization. Thus, volatilization of ammonium particles was
ACPD
12, 10381–10424, 2012Summer ammonia measurements in a densely populated
Mediterranean city
M. Pandolfi et al.
Title Page
Abstract Introduction
Conclusions References
Tables Figures
◭ ◮
◭ ◮
Back Close
Full Screen / Esc
Printer-friendly Version
Interactive Discussion
Discussion
P
a
per
|
Dis
cussion
P
a
per
|
Discussion
P
a
per
|
Discussio
n
P
a
per
|
Moreover, the transport of elevated background NH3 concentrations from the
his-torical city centre and of NH3 emitted from the vehicle crossing the Diagonal Avenue
downwind the measurement station, may occur at the beginning of the sea breeze when wind direction changed from 0 degrees at 07:00 GMT to around 120 degrees at 09:00–10:00 GMT. A prolonged morning peak at UB similar to that observed for ammo-5
nia was observed for the coarse PM mode (PM2.5−10, Fig. 5l). The PM2.5−10fraction in
Barcelona is mainly composed by crustal material (wind blown and traffic resuspended
dust) and marine aerosols (Amato et al., 2009, 2010). The increase in PM2.5−10 in the
early morning (under stagnant conditions) was due to traffic-resuspended road dust
from vehicles crossing the Diagonal Avenue. However, with the development of the sea 10
breeze the transport of coarse aerosols from wind blown and traffic resuspended dust
(also from construction works) from the historical city centre and marine aerosols from the sea may have contributed to the relatively constant values observed for the coarse
aerosol mode between 06:00–10:00 GMT. The second peak at 15:00 GMT for PM2.5−10
concentrations was mainly due to coarse marine aerosols when sea breeze was fully 15
developed (Amato et al., 2010). Thus, the similarities in the diurnal cycles of NH3and
PM2.5−10 in the morning suggest the transport of NH3from the old city as concomitant
effect affecting the concentrations of ammonia at UB station.
A common characteristic of NH3 diurnal cycles at UB and CC sites was the delay
observed in NH3concentrations in reaching their minimum values compared with BC.
20
Thus, at UB the minimum mean values for NH3 and BC were reached at 18:00 and
13:00 GMT, respectively. As for CC site, this delay was probably due to the continuous
reduction in NH3levels due to gas-to-particle partitioning in the afternoon. Conversely,
at night from around 20:00 to 04:00 GMT the concentrations of NH3at UB were rather
constant with mean value of 2 µg m−3and relatively low standard deviation of 0.7 µg m−3
25
on hourly base. This equilibrium condition for the NH3 concentrations at UB site was
favored by the virtual absence at night of the continuously emitting non-traffic NH3
ACPD
12, 10381–10424, 2012Summer ammonia measurements in a densely populated
Mediterranean city
M. Pandolfi et al.
Title Page
Abstract Introduction
Conclusions References
Tables Figures
◭ ◮
◭ ◮
Back Close
Full Screen / Esc
Printer-friendly Version
Interactive Discussion
Discussion
P
a
per
|
Dis
cussion
P
a
per
|
Discussion
P
a
per
|
Discussio
n
P
a
per
|
shown in Fig. 8 where relationship between BC concentrations and wind speed was
clearly observed (R2=0.78) while a low correlation was observed for NH3.
Thus, the differences observed between the concentrations and evolutions of NH3at
UB and CC were mainly due to the differences in the sources affecting both sites which
determined the degree of equilibrium of ambient concentrations of NH3under different
5
atmospheric condition during the 24 h.
4 Specific cases
As reported in the previous paragraphs different factors contributed to the measured
concentrations and daily evolutions of NH3 in Barcelona in summer. We present and
discuss in this section three cases observed during the campaign with levels and daily 10
evolutions of NH3dominated by specific sources or processes such as traffic emissions
or gas-to-particle partitioning. Data from UB site were used with this aim given the larger dataset collected at this station compared with CC.
4.1 SC1: traffic dominated scenario
A closer analysis of each day of measurements performed at UB station revealed that 15
a clear traffic-driven bimodal NH3 diurnal cycle, similar to that of NO2, was observed
on 12 days (only weekdays) out of 90 days with simultaneous NH3and NO2
measure-ments. Five out of these 12 days were consecutively observed between 9 and 13 May and the mean diurnal cycles of the measurements available at UB during this period (named SC1) are reported in Fig. 9 and compared with the mean diurnal cycles during 20
the whole campaign.
As shown in Fig. 9 the beginning of the campaign was characterized by atmospheric
conditions favoring the accumulation of pollutants. The mean concentrations of NH3,
PM1, PM2.5−10, NO2, BC and SO2 during SC1 were higher compared with the whole
ACPD
12, 10381–10424, 2012Summer ammonia measurements in a densely populated
Mediterranean city
M. Pandolfi et al.
Title Page
Abstract Introduction
Conclusions References
Tables Figures
◭ ◮
◭ ◮
Back Close
Full Screen / Esc
Printer-friendly Version
Interactive Discussion
Discussion
P
a
per
|
Dis
cussion
P
a
per
|
Discussion
P
a
per
|
Discussio
n
P
a
per
|
increase was observed for the coarse PM mode (PM2.5−10) indicating that these
atmo-spheric conditions favored the accumulation mainly of fine particles. In fact, the mean
concentration of PM1under SC1, around 22.7 µg m−
3
, was higher than the mean value
of 13.6 µg m−3reported by Amato et al. (2009) for the 2003–2007 period. The opposite
was observed for ozone which was around 37 % lower than the mean. The SC1 period 5
was characterize by low temperatures and wind speeds, less breeze and higher so-lar radiation and pressure. The analysis of the backtrajectories (not shown) indicated the lack of strong synoptic winds during these days with air masses coming mainly from the Mediterranean Sea thus explaining the reduction in temperature despite the slightly higher solar radiation. A certain degree of local recirculation of air masses was 10
also observed thus explaining the accumulation of pollutants. Under these atmospheric
conditions the NH3emitted by passing vehicles were easily accumulated with ammonia
showing the typical bimodal diurnal cycle, in parallel with NO2 and BC, clearly related
with traffic emissions during rush hours in the morning and in the evening when the
sea breeze was not active. 15
The specific case under study demonstrated that traffic was an important source of
NH3at UB. On the base of previous publications in the area under study we know that
the most intense stagnant atmospheric conditions leading to accumulation of pollutants were usually observed in winter (Jorba et al., 2011; Pandolfi et al., 2011; Pey et al.,
2010). Thus, the traffic-driven bimodal diurnal cycles of NH3 can be expected to be
20
more frequent in winter than in summer. Similar findings were reported for example by Meng et al. (2011) and Gong et al. (2011).
4.2 SC2: regional recirculation scenario
Figure 3 shows that the measurement campaign at UB can be divided in two main periods: one from the beginning of the campaign up to around the first half of July with 25
mean NH3 and PM1 levels of 2.7±1.0 µg m−
3
and 15.8±6.7 µg m−3, respectively, and
the other one from 15 July up to the end of the campaign with considerably lower mean
concentrations of NH3 (1.6±0.7 µg m−3) and PM1 (11.8±4.9 µg m−
3
ACPD
12, 10381–10424, 2012Summer ammonia measurements in a densely populated
Mediterranean city
M. Pandolfi et al.
Title Page
Abstract Introduction
Conclusions References
Tables Figures
◭ ◮
◭ ◮
Back Close
Full Screen / Esc
Printer-friendly Version
Interactive Discussion
Discussion
P
a
per
|
Dis
cussion
P
a
per
|
Discussion
P
a
per
|
Discussio
n
P
a
per
|
reduction in both NH3 and PM1 concentrations was due to the typical summer
recir-culation/dispersion conditions enhanced during the second half of the campaign. The period 1–5 August (SC2; Monday–Friday), reported in Fig. 10, was characterized by these typical summer atmospheric conditions with sea breeze circulation and relatively high wind speed. Solar radiation and pressure were close to the mean values observed 5
during the whole campaign while the temperatures registered under SC2 were consid-erably higher than the mean.
During SC2 the levels of PM1 and NH3 at UB were 14.8 µg m−3 and 1.0 µg m−3,
re-spectively higher and lower than the corresponding means calculated over the second
part of the campaign. Consequently, as reported in Fig. 10 the levels of PM1 under
10
SC2 were similar to the levels measured during the whole campaign while the
concen-trations of NH3were among the lowest on average measured. Figure 10 also show the
lack of the clear bimodal diurnal profile of ammonia observed in Fig. 9 under more stag-nant conditions. Our interpretation is that the enhanced formation of secondary sulfate
during the days under study may cause the relative difference observed between the
15
concentrations of NH3 and PM1 with respect to the mean values observed during the
whole campaign. The influence of gas-particle partitioning on ammonia during the day
with depletion of NH3in favor of the formation of high concentrations of sulfates was
re-cently presented by e.g. Ellis et al. (2011) in an agricultural area in Canada. Moreover, Reche et al. (2011) showed that in Barcelona in summer nucleation episodes involving 20
NH4HSO4 particles formation are commonly observed at midday causing high levels
of ultrafine particles.
Figure 11 shows the relationship between the 24 h-averaged gas fraction of
am-monia (gas fraction=NH3/(NH3+NH+4)) and sulfate concentrations from off-line
anal-ysis of 24 h filters collected during the campaign. Twenty-two filters collected from 10 25
May to 5 August were available for this analysis. Details on experimental procedures
used for the determination of SO2−
4 , NO
−
3 and NH
+
4 from filters are given in Querol
ACPD
12, 10381–10424, 2012Summer ammonia measurements in a densely populated
Mediterranean city
M. Pandolfi et al.
Title Page
Abstract Introduction
Conclusions References
Tables Figures
◭ ◮
◭ ◮
Back Close
Full Screen / Esc
Printer-friendly Version
Interactive Discussion
Discussion
P
a
per
|
Dis
cussion
P
a
per
|
Discussion
P
a
per
|
Discussio
n
P
a
per
|
to the gas-to-particle conversion which in summer involved mainly the formation of
sec-ondary sulfates (mean value (22 filters)=3.3 µg m−3
) rather than nitrates (mean value
=0.3 µg m−3). Only one filter collected between 4 and 5 August was available during
SC2 (highlighted in Fig. 11) and it was used as reference for the whole SC2 period. On the other end, the conditions during the selected 5 days were very stable and the 5
mean diurnal cycles calculated on 4 and 5 August separately did not differ very much
from the mean diurnal cycles calculated over the whole SC2 period (mainly showing
low NH3, relatively high PM1and temperatures).
Thus, during the specific case under study (SC2) the general atmospheric condi-tions, including higher mean temperatures, led to the formation of high concentrations 10
of sulfate particles with consequent reduction in the concentrations of gas-phase am-monia. Thus, the gas-to-particle conversion also played an important role during the
campaign in the variation of NH3concentrations.
4.3 SC3: high NH3episode
The last specific case described in this section was the episode (one day, 13 July 15
2011) with the highest mean daily NH3 concentrations (4.9 µg m−
3
) registered during the whole campaign at UB. The mean diurnal cycle for 13 July was reported in Fig. 12. The 13 July started with some rain at night around 03:00–05:00 GMT caus-ing the drastic reduction in the concentrations of the atmospheric components
re-ported in Fig. 12 (NH3, BC, NO2, PM1 and PM2.5−10) scavenged by raindrops. High
20
NH3concentrations were instead observed before the rain event. This day was
charac-terized by strong wind velocities and the virtual absence of sea breeze circulation, with
winds blowing from the NW direction from 00:00 to 13:00 GMT. The high NH3
concen-trations observed at night, before the rain, were likely due to the transport of ammonia from the rural areas located NW the city. High solar radiation and temperature were 25
recorded at midday in concomitance with a reduction in RH. The NH3 increase after
ACPD
12, 10381–10424, 2012Summer ammonia measurements in a densely populated
Mediterranean city
M. Pandolfi et al.
Title Page
Abstract Introduction
Conclusions References
Tables Figures
◭ ◮
◭ ◮
Back Close
Full Screen / Esc
Printer-friendly Version
Interactive Discussion
Discussion
P
a
per
|
Dis
cussion
P
a
per
|
Discussion
P
a
per
|
Discussio
n
P
a
per
|
5 Final considerations
We have shown that the levels of ammonia in summer in Barcelona were regulated
by different chemical and physical atmospheric processes. In the old city (CC
mea-surement station) traffic did not dominate the measured concentrations of ammonia
(5.6±2.1 µg m−3or 7.5±2.8 ppbv) which were higher compared with those
simultane-5
ously measured at the traffic-influenced urban background station (UB) (2.2±1.0 µg m−3
or 2.9±1.3 ppbv) where higher BC concentrations and number of vehicles were
ob-served compared with CC. Thus, other non-traffic fugitive NH3sources such as waste
containers, sewage systems, humans and open markets strongly contributed to the measured levels of ammonia in the densely populated old city of Barcelona.
10
In summer, under high atmospheric temperatures, these fugitive emissions had the
potential to increase the concentrations of NH3 well above the levels measured at the
traffic-influenced urban background UB site. Moreover, the urban design of the old city
of Barcelona with narrow streets also favored the accumulation of NH3preventing the
dispersion of air pollutants. 15
At UB the lower contribution from non-traffic NH3 sources compared with CC led
to a more marked effect of traffic emissions which contributed to the NH3 increase
observed in the morning and in the evening during the rush hours. Conversely, at
night-early morning, when traffic intensity was low, the NH3concentrations at UB were
constant indicating that equilibrium between the NH3sources and sinks was reached
20
under relatively stagnant atmospheric conditions at night.
The typical bimodal-traffic-driven NH3diurnal cycle at UB was especially marked at
the beginning of the campaign when the lack of synoptic winds favored the accumu-lation of pollutants. This bimodal diurnal cycle was not observed at CC site where the
NH3 concentrations showed a monotonic increasing tendency at night-early morning
25
(from 19:00 GMT to 05:00 GMT) before the development of the sea breeze as a
conse-quence of the emissions from non-traffic NH3sources in the old city which were active
ACPD
12, 10381–10424, 2012Summer ammonia measurements in a densely populated
Mediterranean city
M. Pandolfi et al.
Title Page
Abstract Introduction
Conclusions References
Tables Figures
◭ ◮
◭ ◮
Back Close
Full Screen / Esc
Printer-friendly Version
Interactive Discussion
Discussion
P
a
per
|
Dis
cussion
P
a
per
|
Discussion
P
a
per
|
Discussio
n
P
a
per
|
From the off-line analysis of the 24 h filters collected during this summer
measure-ment campaign resulted that lower ambient concentrations of ammonia in its gas fraction were available when the concentrations of sulfate were high as expected from to the gas-to-particle conversion which in summer involved mainly the
forma-tion of secondary sulfates (mean value=3.3 µg m−3
) rather than nitrates (mean value 5
=0.3 µg m−3). Thus, the gas-to-particle conversion also played an important role during
the campaign in the variation of NH3concentrations.
The levels of NH3 measured in Barcelona, especially high in the old city, may
con-tribute to the high mean annual concentrations of secondary sulfate and nitrate
mea-sured in Barcelona compared with other cities in Spain affected by high traffic intensity.
10
In Madrid (around 3 millions inhabitants) for example considerably lower
concentra-tions of NH3 have been observed (not shown) compared with Barcelona. These high
NH3 concentrations in Barcelona may also explain the increase of around 4 µg m−
3
in
the mean annual concentrations of fine PM (PM2.5) measured in Barcelona compared
with Madrid. Finally, the concentrations of ammonia measured in Barcelona may also 15
be the reason for the nucleation episodes involving NH4HSO4 formation which have
been observed in Barcelona and which caused high levels of ultrafine particles (Reche et al., 2011). Consequently, we conclude that it is important to take specific measures
in order to reduce the emissions of NH3in the city of Barcelona and mainly in the old
city. 20
Supplementary material related to this article is available online at: http://www.atmos-chem-phys-discuss.net/12/10381/2012/
acpd-12-10381-2012-supplement.pdf.
Acknowledgements. This work is supported by the MICINN (Spanish Ministry of Science and Innovation) and FEDER funds under the project CARIATI (CGL2008-06294/CLI), GRACCIE
25
ACPD
12, 10381–10424, 2012Summer ammonia measurements in a densely populated
Mediterranean city
M. Pandolfi et al.
Title Page
Abstract Introduction
Conclusions References
Tables Figures
◭ ◮
◭ ◮
Back Close
Full Screen / Esc
Printer-friendly Version
Interactive Discussion
Discussion
P
a
per
|
Dis
cussion
P
a
per
|
Discussion
P
a
per
|
Discussio
n
P
a
per
|
providing the concentrations of gaseous pollutants and the Faculty of Physics from Barcelona University for providing meteorological data.
References
Air Quality Guidelines for Europe, 2nd edn., World Health Organization Regional Office for Europe, European Series No. 91, WHO Regional Publications, ISBN 92 890 1358 3,
Copen-5
hagen, 2000.
Amato, F., Pandolfi, M., Escrig, A., Querol, X., Alastuey, A., Pey, J., Perez, N., Hopke, P. K.: Quantifying road dust resuspension in urban environment by multilinear engine: a compari-son with PMF2, Atmos. Environ., 43, 2770–2780, 2009.
Amato, F., Nava, S., Lucarelli, F., Querol, X., Alastuey, A., Baldasano, J. M., Pandolfi, M.: A
com-10
prehensive assessment of PM emissions from paved roads: real-world emission factors and intense street cleaning trials, Sci. Tot. Environ., 408, 4309–4318, 2010.
Aneja, V. P., Chauhan, J. P., and Walker, J. T.: Characterization of atmospheric ammonia emissions from swine waste storage and treatment lagoons, J. Geophys. Res.-Atmos., 105, 11535–11545, 2000.
15
Bari, A., Ferraro, V., Wilson, L. R., Luttinger, D., and Husain, L.: Measurements of gaseous HONO, HNO3, SO2, HCl, NH3, particulate sulfate and PM2.5in New York City, Atmos. Envi-ron., 37, 2825–2835, 2003.
von Bobrutzki, K., Braban, C. F., Famulari, D., Jones, S. K., Blackall, T., Smith, T. E. L., Blom, M., Coe, H., Gallagher, M., Ghalaieny, M., McGillen, M. R., Percival, C. J., Whitehead, J. D.,
20
Ellis, R., Murphy, J., Mohacsi, A., Pogany, A., Junninen, H., Rantanen, S., Sutton, M. A., and Nemitz, E.: Field inter-comparison of eleven atmospheric ammonia measurement tech-niques, Atmos. Meas. Tech., 3, 91–112, doi:10.5194/amt-3-91-2010, 2010.
Brunekreef, B. and Holgate, S. T.: Air pollution and health, Lancet, 360, 1233–1242, 2002. Burgard, D. A., Bishop, G. A., and Stedman, D. H.: Remote sensing of ammonia and sulfur
25
dioxide from on-road light duty vehicles, Environ. Sci. Technol., 40, 7018–7022, 2006. Cape, J. N., Tang, Y. S., van Dijka, N., Love, L., Sutton, M. A., and Pame, S. C. F.: