ABSTRACT
Objectives:To evaluate the reliability of the sagittal abdominal diameter and its validity as a predictor of visceral abdominal fat, as well as to identify the most appropriate cut-off points to identify the area of visceral fat that is known to repre-sent a risk factor for cardiovascular disease. Design:Validation study. Subjects:92 healthy volunteers (57 women, 35 men), age: 20–83 y, body mass index: 19.3 to 35.9 kg/m2. Measurements: Sagittal abdominal diameter (SAD), weight, height, cir-cumferences (waist, hip, and thigh), sub-scapular skinfold thickness, abdominal diameter index, and waist-hip ratio (WHR). Method of choice:Computed tomog-raphy (CT). Statistic:Receiver operating characteristic (ROC) curve. Results:The reliability for SAD measurement was very high (Inter-class coefficient = 0.99). Vis-ceral fat as measured by VAF through CT was highly correlated with SAD (women r = 0.80; men r = 0.64, p < 0.001), waist circumference (women r = 0.77; men r = 0.73, p < 0.001), and WHR (women r = 0.72; men r = 0.58, p < 0.001). The ROC curve indi-cated 19.3 cm and 20.5 cm as the threshold values for abdominal sagittal diameter in women and men (sensitivity 85% and 83%, specificity 77% and 82%, respective-ly). Conclusions:There was a high correlation between SAD and VAF. The cut-off values identified for SAD presented a sensitivity and specificity that were consid-ered adequate. (Arq Bras Endocrinol Metab 2007;51/6:980-986)
Keywords: Sagittal abdominal diameter; Waist-hip ratio; Visceral fat; Waist cir-cumference; Body fat distribution
RESUMO
Validade e Confiabilidade do Diâmetro Abdominal Sagital Enquanto Preditor de Gordura Abdominal Visceral.
Objetivos:Avaliar a confiabilidade do diâmetro abdominal sagital e a sua validade enquanto preditor de gordura abdominal visceral, assim como identificar os pontos de corte mais apropriados para identificar a área de gordura visceral que é conhecida por representar fator de risco para doença cardiovascular. Métodos: Desenho: Estudo de validação. Amostra: 92 voluntários saudáveis (57 mulheres, 35 homens), idade: 20–83 anos, índice de massa corporal: 19,3 a 35,9 kg/m2. Medidas: Diâmetro abdominal sagital (DAS), peso, altura, circunferências (cintura, quadril e coxa), pregas cutâneas tricipital e subescapular, índice diâmetro abdominal e razão cintura-quadril (RCQ). Método de escolha: Tomografia computadorizada (TC). Estatística: Curva ROC (receiver operating characteristic). Resultados: A confiabilidade do DAS foi muito alta (coeficiente inter-classe = 0,99). A área de gordura visceral medida pela TC teve uma alta correlação com o DAS (mulheres r = 0,80, homens r = 0,64, p < 0,001), circunferência da cintura (mulheres r = 0,77, homens r = 0,73, p < 0,001) e com a RCQ (mulheres r = 0,72, homens r = 0,58, p < 0,001). A curva ROC indicou 19,3 cm e 20,5 cm como valores limites para o diâmetro abdominal sagital em mulheres e homens (sensibilidade de 85% e 83%, especificidade de 77% e 82%, respectivamente). Conclusões: Observou-se alta correlação entre o DAS e a área de gordura abdominal visceral. Os pontos de corte identificados para o DAS apresentaram sensibilidade e especificidade adequadas. (Arq Bras Endocrinol Metab 2007;51/6:980-986)
Descritores: Diâmetro abdominal sagital; Razão cintura-quadril; Gordura visceral; Circunferência da cintura; Distribuição de gordura corporal
artigo original
LÍLIANR. SAMPAIO EDUARDO J. SIMÕES ANA MARLÚCIAO. ASSIS LUIZR. RAMOS
Departamento Ciência da Nutrição da Escola de Nutrição, Universidade Federal da Bahia (LRS & AMOA), Salvador, BA; Department of Health and Human Services of Centers for Disease Control and Prevention (EJS) e Departamento de
Medicina Preventiva, Universidade Federal de São
Paulo (LRR), São Paulo, SP.
S
TUDIES HAVE DEMONSTRATEDthe importance of theregional distribution of adipose tissue in the devel-opment of metabolic disturbance of glucose and lipids. Central or abdominal obesity has been identified as an important risk factor for diabetes, dyslipidemia, hyper-tension, cardio and cerebrovascular diseases, and con-sequently premature death, independently from body mass (1-5).
Abdominal fat, however, is composed of subcu-taneous fat and intra-abdominal (visceral) fat. The influence on the metabolic processes seems to be mediated by the deposit of visceral fat, hence it is important to quantify this factor in the prediction of morbidity and mortality risks (1).
Computed tomography (CT) and magnetic res-onance (MRI) are considered to be gold standard methods for such quantification, because they discrim-inate the abdominal fatty components appropriately, thereby providing accurate and reliable measurements. However, the high cost of both CT and MRI and exposure to ionizing radiation in CT, as well as the shortage of equipment in developing countries, restricts its use to research centers and hospitals to the detriment of clinical and epidemiologic practice (6).
To overcome these limitations and in view of advantages such as low cost and ease of execution, there has been increasingly more research into the accuracy and precision of anthropometry as an indicator of abdominal fat (6-10). Studies have demonstrated that the classic anthropometric indicators [body mass index (BMI), waist-to-hip ratio and skin fold thickness] are not strong predictors of visceral adiposity, besides they are not sensitive to weight changes (11).
Recent studies have pointed to a new measure-ment — the sagittal abdominal diameter (SAD) — as a strong anthropometric predictor of visceral fat (7,9-10,12-14). The close correlation between this diameter and several risk variables, such as levels of insulin, lipids and uric acid, blood pressure, metabolic syndrome and others, has also been demonstrated (5,15-16).
It is a simple, noninvasive measurement based on the fact that for individuals in the supine position any increase in accumulation of visceral fat maintains the height of the abdomen in the sagittal direction, while subcutaneous fat reduces the height of the abdomen due to the force of gravity (12). There are, indeed, several studies in the literature that have test-ed correlations of SAD with visceral fat and generattest-ed predicting equations for visceral fat (7,9,12-13).
To our knowledge, however, there has been no study to determine a cut-off point for SAD with good sensitivity and specificity to identify the area of
viscer-al fat (measured by CT) that is considered to increase the risk of morbidity and death.
In Brazil, there have been no studies on this anthropometric measurement, which could be included in protocols intended for the evaluation of metabolic conditions and cardiovascular risk. Thus, the objectives of the present work were to evaluate the reliability of the SAD and its validity as a predictor of visceral fat, as well as to identify the most appropriate cut-off points to identify the area of visceral fat that is known to represent a risk factor for cardiovascular disease.
SUBJECTS AND METHODS
A validation study was carried out at the Pavilhão José Fran-cisco Magalhães Neto, in the University Hospital of the Fed-eral University of Bahia (HC-UFB), from August to Octo-ber 2003. The sample of 92 healthy volunteers comprised 57 women with ages ranging from 20 to 83 years and 35 men with ages ranging from 20 to 81 years. The study was approved by the Research Ethics Committees at HC-UFB and at the Federal University of São Paulo (UNIFESP), where data were analyzed. All participants signed a term of informed written consent.
Individuals with characteristics that could influence measurements of fat or anthropometric measurements such as hepato- and/or splenomegaly, ascites or recent abdominal surgery were excluded.
Anthropometry
The following anthropometric measurements were verified in all of the individuals: SAD, weight, height, circumferences (waist, hip and thigh) and the subscapular skinfold thickness. Measurements were done by two trained anthropometric technicians and the technique for the measurements (except weight and height) was based on palpation to locate bone structures.
between the inguinal fold and the proximal border of the patella, while maintaining a slight flexion of the knee. A waist-to-hip ratio (WHR) was composed by dividing the waist circumference by the hip circumference. The sub-scapular skin fold thickness (SST) was verified with the aid of the fold caliper (Lange brand – TBW Importadora Ltda.) in the lower angle of the scapula at a 45º angle.
The SAD was measured with a portable, sliding-beam, abdominal caliper (Holtain, Ltd.; Dyfed, Wales, UK). The caliper's upper arm was brought down to just above an abdominal mark made midway between the iliac crests, a location that approximates to the L4-L5 interspace. The sub-ject was asked to inhale and exhale gently, and the arm of the caliper was brought down to touch the abdominal mark with-out compression (figure 1). All subjects were examined on a conventional, clinic examining table. SAD was evaluated alone and as a composite of the abdominal index (ADI), which is SAD divided by the thigh girth.
To evaluate the reliability of SAD, two observers examined four subjects on the same day. Each observer examined each subject twice. It was ensured that no observ-er took consecutive measurements on the same subject. Each measurement was recorded on a separate form to minimize the influence of previous measurements.
The area of abdominal fat was measured by CT of the abdomen, performed by a radiologist, using a PQ5000 Pick-er Tomograph at the Radiology SPick-ervice of the Fundação Baiana de Cardiologia. The exams were done after 4 hours of complete fasting with the patient in supine position and arms extended above the head. A lateral tomogram was done to precisely locate L4-L5, and then a single axial tomo-graphic slice was performed in this location, with a slice thickness of 10 mm. Neither oral nor intravenous contrast was administered. The preselected attenuation interval cho-sen for fat was -50 to -150 Hounsfield units (17). The area of subcutaneous abdominal fat (SAF) was calculated by sub-tracting the area of visceral area of abdominal fat (VAF) from the area of total of abdominal fat (TAF). The CT and anthropometry were done in the same week.
Statistical analysis
Data are presented as means and standard deviations. With-in each sex group, normality of the distribution was tested for all the variables studied using the Kolmogorov-Smirnov test. Comparisons of the anthropometric measurements between sexes were performed by unpaired Student’s t test. Pearson correlations and partial correlations between mea-surements (i.e., anthropometric and those derived from CT) were also calculated. The intra-and-inter class correlation coefficients were calculated to analyze the reliability of the SAD measurement. The receiver operating characteristic (ROC) curve was constructed using a single cut-off point for the VAF measured by CT. A 100 cm2value was selected as
the threshold for excess VAF. The choice of this cut-off value took into account the low prevalence of individuals with excess VAF (positive reference test) when limits greater than 100 cm2(110 and 130 cm2) were considered.
The sensitivity (probability of correctly detecting true positives) and the specificity (probability of correctly detect-ing true negatives) for each value of SAD were estimated and the cut-off that produced the best combination of sensitivi-ty and specificisensitivi-ty was selected as the most appropriate value for SAD to predict the level of VAF per 100 cm2, for each
sex. The ROC curve was constructed with the aid of SPSS version 10.0 software (18).
RESULTS
The sample of 92 healthy volunteers comprised 57 women with ages ranging from 20 to 83 years and BMI from 19.3 to 35.9 kg/m2, and 35 men with ages
ranging from 20 to 81 years and BMI from 20.6 to 33.9 kg/m2.
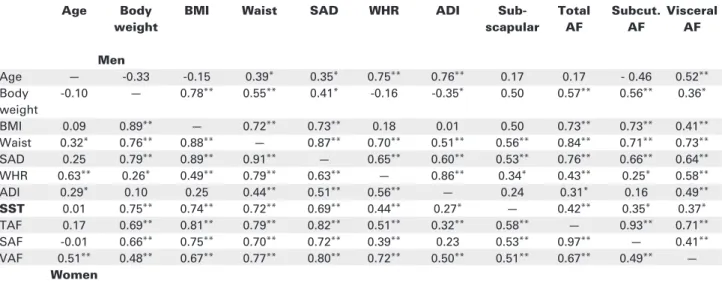
In table 1, sex differences in regional adipose tissue distribution were noted. Although BMI was not significantly different between sexes, women showed a higher mean subcutaneous abdominal adipose tissue area and skinfold thickness than men. However, men had significantly higher VAF, SAD, ADI, waist girth and waist-to-hip ratio (WHR) than women. The prevalence of excess of VAF (> 100 cm2) was higher
among men (51.4% against 22.8% in women). Table 2 shows the correlation coefficients among age and anthropometric variables in men and women. Positive and statistically significant correla-tions of age with waist circumference, SAD, WHR, and ADI were found for both sexes. In both men and women, SAD was positively and significantly correlat-ed with weight, SST, WHR, ADI, TAF, and SAF. A highly significant correlation coefficient was found between SAD and VAF in females (r = 0.80, p < 0.001), while for males, the correlation coefficient was a little less but still highly significant (r = 0.64, p <
0.001). SAD also strongly correlated with the anthro-pometric variables, especially with waist circumference (women: r = 0.91, p < 0.001; men: r = 0.87, p < 0.001) and BMI (women: r = 0.89, p < 0.001; men: r = 0.73, p < 0.001). It was observed that the waist cir-cumference (women: r = 0.77, p < 0.001; men: r = 0.73, p < 0.001) and WHR (women: r = 0.72 p < 0.001; men: r = 0.58, p < 0.001) were the most close-ly correlated to the area of VAF. In both sexes VAF
presented a statistically significant correlation with age (women: r = 0.51, p < 0.001; men: r = 0.52, p < 0.001). Investigation into the influence of subcuta-neous fat on the relationship between SAD and viscer-al fat in both sexes, showed that even after adjustment for sub-scapular skinfold thickness (women: r = 0.71, p < 0.001; men: r = 0.56, p < 0.001) and BMI (women: r = 0.58, p < 0.001; men: r = 0.54, p < 0.001) SAD and VAF correlations remained positive
Table 1.Characteristics of the study sample.
Women (n = 57) Range Men (n = 35) Range p value
Age (y) 57.6 ± 14.6 20–83 54.5 ± 16.8 20–81 NS
Median = 60 Median = 60
Body weight (kg) 60.2 ± 10.3 42.7–86.2 71.2 ± 10.1 51.7–86.9 0.000
Height (cm) 1.54 ± 0.06 1.42–1.70 1.67 ± 0.07 1.48–1.81 0.000
BMI (kg/m2) 25.3 ± 4.1 19.3–35.9 25.6 ± 2.9 20.6–33.9 NS
Waist (cm) 81.8 ± 10.5 62–111.0 89.9 ± 8.1 71.5–109.1 0.000
SAD (cm) 18.6 ± 2.8 13.4–25.2 20.9 ± 2.0 17.5–26.0 0.000
WHR 0.84 ± 0.08 0.65–1.06 0.94 ± 0.07 0.83–1.09 0.000
ADI 0.39 ± 0.05 0.28–0.60 0.43 ± 0.05 0.34–0.53 0.002
Subscapular skinfold (mm) 20.3 ± 8.0 6.0–48.0 19.0 ± 6.2 8.0–35.5 NS
TAF (cm2) 303.0 ± 97.4 105.7–492.4 265.6 ± 76.0 139.9–467.9 NS
SAF (cm2) 218.8 ± 83.1 58.0–383.0 163.1 ± 58.5 84.1–307.1 0.002
VAF (cm2) 84.1 ± 24.5 37.8–164.4 102.5 ± 30.1 53.5–161.2 0.003
VAF ≥100 cm2, n (%) 13 (22.8) — 18 (51.4) —
BMI – Body mass index, SAD – Sagittal abdominal diameter, WHR – Waist-to-hip ratio, ADI – Abdominal diame-ter index (Sagittal abdominal diamediame-ter divided by midthigh girth), SST – Sub scapular skinfold thickness, TAF – Total AF, SAF – Subcutaneous AF, VAF – Visceral AF, NS – not statistically significant.
Table 2.Correlation coefficients among age and anthropometric variables in men (n = 35) and women (n = 57).
Age Body BMI Waist SAD WHR ADI Sub- Total Subcut. Visceral
weight scapular AF AF AF
Men
Age — -0.33 -0.15 0.39* 0.35* 0.75** 0.76** 0.17 0.17 - 0.46 0.52**
Body -0.10 — 0.78** 0.55** 0.41* -0.16 -0.35* 0.50 0.57** 0.56** 0.36*
weight
BMI 0.09 0.89** — 0.72** 0.73** 0.18 0.01 0.50 0.73** 0.73** 0.41**
Waist 0.32* 0.76** 0.88** — 0.87** 0.70** 0.51** 0.56** 0.84** 0.71** 0.73** SAD 0.25 0.79** 0.89** 0.91** — 0.65** 0.60** 0.53** 0.76** 0.66** 0.64** WHR 0.63** 0.26* 0.49** 0.79** 0.63** — 0.86** 0.34* 0.43** 0.25* 0.58**
ADI 0.29* 0.10 0.25 0.44** 0.51** 0.56** — 0.24 0.31* 0.16 0.49**
SST 0.01 0.75** 0.74** 0.72** 0.69** 0.44** 0.27* — 0.42** 0.35* 0.37* TAF 0.17 0.69** 0.81** 0.79** 0.82** 0.51** 0.32** 0.58** — 0.93** 0.71**
SAF -0.01 0.66** 0.75** 0.70** 0.72** 0.39** 0.23 0.53** 0.97** — 0.41**
VAF 0.51** 0.48** 0.67** 0.77** 0.80** 0.72** 0.50** 0.51** 0.67** 0.49** — Women
CT – Computerized tomography, BMI – Body mass index, SAD – Sagittal abdominal diameter, WHR – Waist-to-hip ratio, ADI – Abdominal diameter index (Sagittal abdominal diameter divided by midthigh girth), SST – Sub scapular skinfold thickness, TAF – Total AF, SAF – Subcutaneous AF, VAF – Visceral AF, Subcut. – Subcutaneous
and significant (data not presented in the tables). Like-wise, age did not affect this correlation (women: r = 0.80, p = 0.000; men: r = 0.56, p < 0.001) (data not presented in the table).
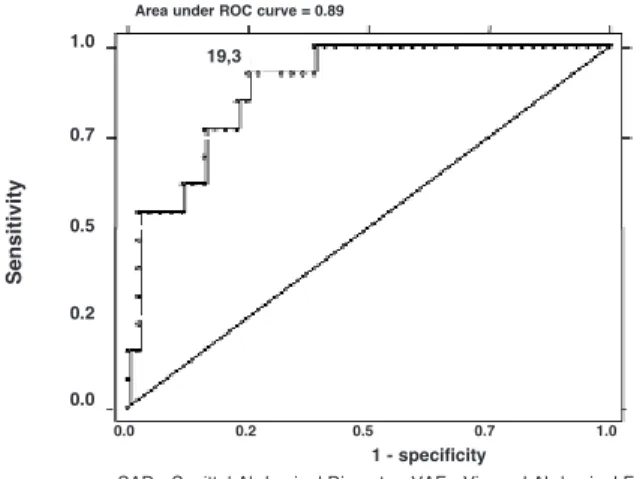
Figures 2 and 3 present the cut-off points for SAD corresponding to the critical amount of VAF that was considered to be of risk (> 100 cm2), and the
respective sensitivity, specificity and areas below the ROC curve for men and women. It was observed that the cut-off points offering the best combination between the highest sensitivity (83% and 85%, respec-tively for men and women) and the highest specificity (82% and 77%; for men and women respectively) were 20.5 cm and 19.3 cm, respectively. The areas below the ROC curve were greater than 0.80, with values of p < 0.001 in both sexes.
The reliability study for the SAD measurement showed that the only source of variability with strong significance was between subjects (p < 0.0001), responsible for approximately 98% of the total vari-ability in the study. Only 2% of this varivari-ability was due to the measurement system (data not shown in tables).
DISCUSSION
This is the first study done in Brazil and in a develop-ing country that uses SAD as an anthropometric pre-dictor of visceral fat. Its correlation with VAF, the reli-ability of its measurement and the optimal cut-off points to detect individuals with an area of visceral fat
≥100 cm2were investigated. One of the weaknesses of
the present study is the relatively small sample, but similar or smaller samples have been reported for most
studies that used radiological imaging techniques such as CT (10,19), indicating that the costs involved with using these techniques make large studies prohibitive. In our study, the SAD measured by anthropom-etry showed an excellent correlation with visceral fat measured by CT. These findings are in agreement with previous studies carried out in developed countries. Tornaghi et al. (19), for example, compared the accura-cy of anthropometric measures and ultrasonography in evaluating the amount of VF using CT as the gold stan-dard, and found a correlation of 0.76 between SAD and VF. Likewise, Zamboni et al. (10) observed a strong association between these two variables, even after adjustment for BMI. Jensen et al. (20) observed a relation of 0.92 between SAD and VF volume. The cor-relation found by Pouliot et al. (9) was greater (r = 0.87 and r = 0.80 for women and men, respectively), howev-er, in this study SAD was measured by CT.
Although statistically significant, our study found a smaller correlation coefficient between SAD and VAF for males than the previously observed (7). Though the results were better for women, they were nevertheless still smaller than correlations presented by other authors. The determination of causes for the dif-ferences observed between sexes requires further investigation since they may be related to sample size and/or proportionality. Overall, for both men and women, SAD and waist circumference were better indicators of VAF than other anthropometric mea-sures, with WHR coming third in a ranking of all esti-mated correlations. However, the waist circumference was a better indicator of VAF than SAD in men, while SAD was a better indicator of VAF than waist circum-ference in women. Indeed, the literature points to
Figure 2.ROC curve for identification of the optimal cut-off values for SAD with VAF level of 100 cm2 in men. Sensitivity and specificity (83% and 82%) for the cut-off value of 20.5 cm
Figure 3.ROC curve for identification of the optimal cut-off val-ues for SAD with VAF level of 100 cm2 in women. Sensitivity and specificity (85% and 77%) for the cut-off value of 19.3 cm.
Sensitivity
1.00
0.75
0.50
0.25
0.00
0.00 0.25 0.50 0.75 1.00
1 - specificity
SAD - Sagittal Abdominal Diameter; VAF - Visceral Abdominal Fat Area under ROC curve = 0.84
Sensitivity
1.0
0.7
0.5
0.2
0.0
0.0 0.2 0.5 0.7 1.0
1 - specificity
SAD - Sagittal Abdominal Diameter; VAF - Visceral Abdominal Fat Area under ROC curve = 0.89
20,5
divergent results in terms of the performance of SAD in relation to the waist circumference in predicting vis-ceral volume (8,14-16).
The ability of SAD to predict visceral fat has been shown to improve when one makes appropriate adjustments for the subcutaneous abdominal fat (14). In this study, direct deduction of subcutaneous fat from the total abdominal fat as measured by CT ren-ders VAF correlations with SAD about the same as that with TAF. In addition, the adjustment for SST and BMI did not influence the correlation between SAD and visceral fat as measured by VAF.
WHR is one of the most common anthropo-metric indexes for evaluation of the distribution of body fat. In the present study, WHR had a much lower correlation with visceral fat than SAD and waist circumference. It has also been suggested by Kahn (4,21) that ADI could be used as a substitute for WHR, with a view to overcoming the disadvantages of measuring the waist and hip. In the present study, ADI presented strong correlation with visceral fat (VAF) but these correlations were much lower than that for SAD, waist circumference, and WHR.
The reliability of the SAD measurement in the present study was high (coefficient = 0.99). The intra-and inter-observer variations for SAD were small. Our results corroborate previous studies. Ramussen et al. (22) evaluated the inter- and intra-observer variation in the measurement of SAD in the supine position and concluded that it is not necessary to use more than one observer or duplication of the measurements, since the inter- and intra-observer variation was not statistically significant. Zamboni et al. (10) reported coefficients of intra- and inter-observer variation of 0.58% and 1.5%, respectively.
Regarding the most appropriate cut-off point for SAD to predict the threshold level of visceral fat considered conducive to higher morbidity (9) and mortality (8), our study showed different values when compared to these investigations. This difference in the study results is probably due to the use of different methodologies and statistical analyses (8,9). Other investigations have used confidence limits for VAF based on the abdominal diameter measured by CT. Pouliot et al. (9), for instance, observed significant alterations in the metabolic profile when SAD values were over 25 cm. This difference could be explained by the magnitude of the metabolic alterations and also the fact that these authors did not evaluate SAD by anthropometric method. Kahn et al. (8), in a case-con-trol study on anthropometric indexes associated to coronary artery disease, observed that the case (SAD =
24.3 cm) and control (SAD = 23.3 cm) groups were well discriminated by SAD. Lemieux et al. (13) observed a higher cut-off point for SAD in females (SAD = 25.2 cm against 22.8 cm for males) corre-sponding to 130 cm2 of VAF, but they used linear
regression analysis rather than ROC curves. ROC curve is considered to be the method of choice for identification of the cut-off points (23).
In conclusion, our study has demonstrated that SAD is a strong and reliable predictor of visceral fat as measured by VAF. The most important result of this study was to determine the cut-off points of SAD val-ues that should be considered as an indication of ele-vated VAF for men and women. The use of SAD in prospective populational studies would be important to assess its predictive value for cardiovascular morbid-ity and mortalmorbid-ity. However, once sample size and dif-ference between the number of males and females are taken into account, further studies using larger and more representative samples are warranted.
ACKNOWLEDGEMENTS
We gratefully acknowledge the contributions of Dr. Leon Rubenstein — Radiologist of the Veterans Hos-pital of Atlanta and Assistant Professor of the Emory University Medical School — for his revision of writ-ten methodology, and Dra. Vanessa de Carvalho Figueiredo — Nutritionist — for her supervision of data collection.
This project was supported by Conselho Nacional de Desenvolvimento Científico e Tecnológi-co (CNPq).
REFERENCES
1. Desprès J-P. Obesity and lipid metabolism: relevance of body fat distribution. Curr Opin Lipidol 1991;2:5-15.
2. Desprès J-P, Lamarche B. Effects of diet and physical activity on adiposity and body fat distribution: implications for the prevention of cardiovascular disease. Nutr Res Rev 1993;6:137-59.
3. Janssen I, Katzmarzyk PT, Ross R. Waist circumference and not body mass index explains obesity-related health risk. Am J Clin Nutr 2004;79:379-84.
4. Kahn HS. Alternative anthropometric measures of risk: possi-ble improvements on the waist-hip ratio. In: Medeiros-Neto G, Halpern A, Bouchard C (eds). Progress in Obesity Research. 9. Libbey: London, 2003. pp. 639-43.
5. Risérus U, Ärnulöv J, Brismar K, Zethelius B, Berglund L, Vessby B. Sagittal abdominal diameter is a strong anthropo-metric marker of insulin resistance and hyperproinsulinemia in obese men. Diabetes Care 2004;27(8):2041-6.
7. Desprès J-P, Prud’homme D, Pouliot MC, Tremblay A, Bouchard C. Estimation of deep abdominal adipose tissue accumulation from simple anthropometric measurements in men. Am J Clin Nutr 1991;54:471-7.
8. Kahn HS, Austin H, Williamson DF, Arensberg D. Simple anthropometric indices associated with ischemic heart dis-ease. J Clin Epidemiol 1996;49:1017-24.
9. Pouliot M-C, Desprès J-P, Lemieux S, Moorjani S, Bouchard C, Tremblay A, et al. Waist circumference and sagittal abdominal diameter: best simple anthropometric indexes of abdominal visceral adipose tissue accumulation and related cardiovascular risk in men and women. Am J Cardiol 1994;73:460-8.
10. Zamboni M, Turcato E, Armellini F, Zivelonghi A, Santana H, Bergano-Andreis IA, et al. Sagittal abdominal diameter as a practical predictor of visceral fat. Intern J Obesity 1998;22:655-60.
11. Lemieux S, Prud’homme D, Tremblay A, Bouchard C, Desprès J-P. Anthropometry correlates to changes in visceral adipose tissue over 7 years in women. Int J Obes Relat Metab Disord 1996b;20:618-24.
12. Kvist H, Chowdhury B, Grangard U, Tylén U, Sjöström L. Total and visceral adipose-tissue volumes derived from mea-surements with computed tomography in adult men and women: predictive equations. Am J Clin Nutr 1988;48:1351-61.
13. Lemieux S, Prud’homme D, Bouchard C, Tremblay A, Desprès J-P. A single threshold value of waist girth identifies normal-weight and overweight subjects with excess visceral adipose tissue. Am J Clin Nutr 1996;65:685-93.
14. Van der Kooy K, Leenen R, Seidell JC, Deurenberg P, Visser M. Abdominal diameters as indicators of visceral fat: com-parison between magnetic resonance imaging and anthro-pometry. Br J Nutr 1993;70:47-58.
15. Ohrvall M, Berglund L, Vessby B. Sagittal abdominal diame-ter compared with other anthropometric measurements in relation to cardiovascular risk. Int J Obes Relat Metab Dis-ord 2000;24:497-501.
16. Turcato E, Bosello O, Di Francesco V, Harris TB, Zoico E, Bis-soli L, et al. Waist circumference and abdominal sagittal diameter as surrogates of body fat distribution in the elderly: Their relation with cardiovascular risk factors. Int J Obes Relat Metab Disor 2000;24:1005-10.
17. Seidell JC, Oosterlee A, Thijssen MAO, Burema J. Assess-ment of intra-abdominal and subcutaneous abdominal fat: relation between anthropometry and computed tomography.
Am J Clin Nutr 1987;45:7-13.
18. Statistical Package for the Social Sciences (SPSS) StatSoft
[computer program], version 10.0, 1999. Chicago, IL, USA. 19. Tornaghi G, Raiteri R, Pozzato C, Rispoli A, Bramani M,
Cipo-lat M, et al. Anthropometric or ultrasonic measurements in assessment of visceral fat? A comparative study. Int J Obes 1994;18:771-5.
20. Jensen MD, Kanaley JA, Reed JE, Sheedy PF. Measurement of abdominal and visceral fat with computed tomography and dual-energy x-ray absorptiometry. Am J Clin Nutr 1995;61:274-8.
21. Kahn HS, Simões EJ, Koponen M, Hanzlick R. The abdominal diameter index and sudden coronary death in men. Am J Cardiol 1996;78(8):961-4.
22. Rasmussen MH, Andersen T, Breum L, Hilsted J, Gotzsche PC. Observer variation in measurements of waist-hip ratio and the abdominal sagittal diameter. Int J Obes 1993;17:323-7.
23. Fletcher RH, Fletcher S, Wagner-RS EH. Epidemiologia Clínica: bases científicas da conduta médica. Porto Alegre: ARTMED, 1989. p. 312.
Endereço para correspondência:
Lílian Ramos Sampaio
Escola de Nutrição da Universidade Federal da Bahia Av. Araújo Pinho 32