Available online at http://www.academicjournals.org/AJB ISSN 1684–5315 © 2008 Academic Journals
Full Length Research Paper
Biodegradability of diesel and biodiesel blends
Adriano Pinto Mariano*, Richard Clayton Tomasella, Luciano Marcondes de Oliveira, Jonas
Contiero and Dejanira de Franceschi de Angelis
Departamento de Bioquímica e Microbiologia - Instituto de Biociências (IB) - Universidade Estadual Paulista (UNESP).
Accepted 16 February, 2008
The biodegradability of pure diesel and biodiesel and blends with different proportions of biodiesel (2%
(commercial); 5% and 20%) was evaluated employing the respirometric method and the redox indicator
2,6-dichlorophenol indophenol (DCPIP) test. In the former, experiments simulating the contamination of
natural environments (soil from a petrol station or water from a river) were carried out in Bartha
biometer flasks (250 ml), and used to measure the microbial CO
2production. With the DCPIP test, the
capability of three inocula to biodegrade the blends was tested. Results show that although biodiesel is
more easily and faster biodegraded than diesel oil, among the blends evaluated (2%, 5% and 20%), only
the blend with higher concentration of biodiesel presented biodegradability significantly different from
diesel and it was not verified an improvement on the biodegradation of the diesel by means of
co-metabolism.
Key words: Biodiesel, diesel, blend, biodegradability, bioremediation.
INTRODUCTION
The introduction of the biodiesel into the Brazilian
ener-getic matrix was determined by a federal law that
establishes a compulsory blend of 2% of biodiesel in
mineral diesel as of 2008 and 5% as of 2013. Currently
Brazil produces approximately 750 million litres of
biodiesel per year, a figure very close to the 840 million
litres necessary to accomplish the 2% blend. Although
either fuel presents the same function, they have very
distinct origins and compositions. Biodiesel is composed
of methyl or ethyl esters of fatty acids with low structural
complexity as oleate, palmitate, estearate, linoleate,
myri-state, laureate and linolenate, derived from different
vegetable oil sources such as soybean, sunflower,
pea-nut, cotton, palm oil, cocopea-nut, babassu and castor oil and
from animal fat (Pinto et al., 2005). Differently, diesel oil
contains 2000 to 4000 hydrocarbons, a complex mixture
of normal, branched and cyclic alkanes, and aromatic
compounds obtained from the middle-distillate fraction
during petroleum separation (Gallego et al., 2001).
Besides the recognised environmental benefits related
to the biodiesel combustion (less emissions of CO
2, CO,
*Corresponding author. E-mail: adrianomariano@yahoo.com.br. Fax: +55-1935264176.
SO
x, volatile organic compounds and particulate material)
(Pinto et al., 2005), the difference between the fuels
compositions also influences their biodegradability. As
occurs to the diesel oil, the commercialization of biodiesel
or the biodiesel/diesel blend may cause environmental
damages due to spills. The clean-up of these
conta-minated areas can be achieved with bioremediation, a
technique based on the action of microorganisms, which
turn hazardous contaminants into non toxic substances
as CO
2, water and biomass. Here again, biodiesel
pre-sents advantages, since studies demonstrate that
biodiesel is more easily biodegraded and less toxic than
diesel oil (Koo-Oshima et al., 1998; Zhang et al., 1998;
Makareviciene and Janulis, 2003; Pasqualino et al.,
2006; Lapinskiené et al., 2006; Khan et al., 2007).
Moreover, some of these works also show that biodiesel
can promote and speed up the biodegradation of diesel
by means of co-metabolism.
Table 1. Soil sample characteristics.
Parameter Value Parameter Value
pH (CaCl2) 6.7 K (mmolc/dm3) 1.1
Organic carbon (%) 0.29 Ca (mmolc/dm3) 15
Total nitrogen (%) 0.02 Mg (mmolc/dm3) 2
Available phosphorus (ppm) 2.0 H+Al (mmolc/dm3) 10
C:N:P 100 : 6.89 : 0.10 Al (mmolc/dm3) -b
Moisture content (%) 12.7 CECa (mmolc/dm3) 28.7
Grain size distribution (%) Sand Silt Clay
81.4 7.3 11.3
Micronutrients(ppm) Heavy metals (ppm)
S Na Fe Mn Cu Zn B Co Mo Ba Cd Cr Ni Pb
12 13 19 3.0 0.6 7.3 0.15 0.56 -b 4.06 0.12 9.93 0.30 7.10
aCation exchange capacity bNot detected
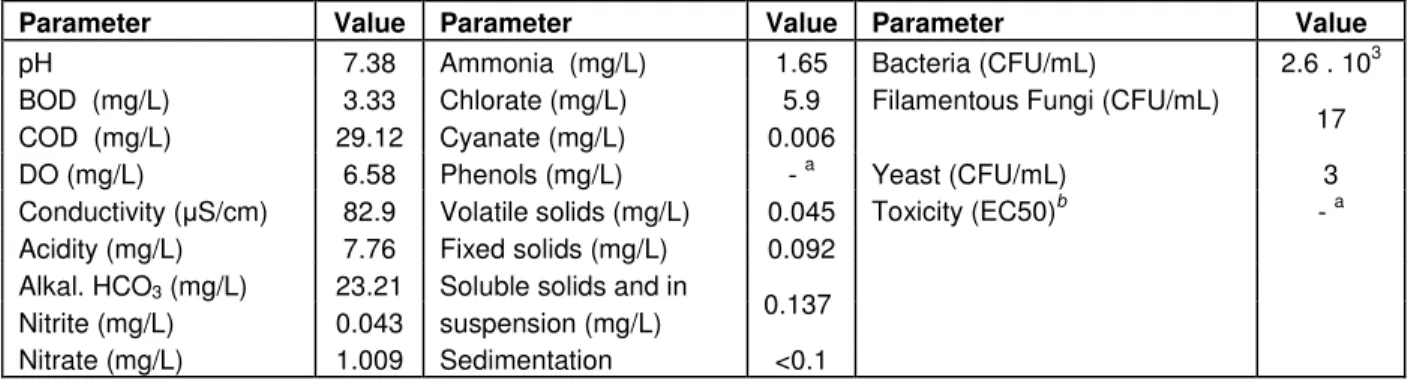
Table 2. Water sample characteristics.
Parameter Value Parameter Value Parameter Value
pH 7.38 Ammonia (mg/L) 1.65 Bacteria (CFU/mL) 2.6 . 103
BOD (mg/L) 3.33 Chlorate (mg/L) 5.9 Filamentous Fungi (CFU/mL)
17 COD (mg/L) 29.12 Cyanate (mg/L) 0.006
DO (mg/L) 6.58 Phenols (mg/L) - a Yeast (CFU/mL) 3
Conductivity ( S/cm) 82.9 Volatile solids (mg/L) 0.045 Toxicity (EC50)b - a Acidity (mg/L) 7.76 Fixed solids (mg/L) 0.092
Alkal. HCO3 (mg/L) 23.21 Soluble solids and in
0.137 Nitrite (mg/L) 0.043 suspension (mg/L)
Nitrate (mg/L) 1.009 Sedimentation <0.1
aNot detected b
Daphnia similis
MATERIAL AND METHODS
Soil and water sampling and their characteristics
The soil sample was collected at a petrol station (Rio Claro/SP/Brazil) during the replacement of underground pipes (0.50 m depth). This sample showed low level of contamination (104 mg/Kg) by unknown fuel, possibly due to leaks in the pipes and ground infiltrations (Mariano et al., 2008a,c). Until performing the biodegradation experiments, the sample was stored at 5oC. Table 1
summarizes some of the soil physicochemical characteristics. Values of heavy metals concentrations are not above the more res-tricted levels set by the Cetesb (São Paulo Environmental Agency – Brazil) and by the Dutch list (Cetesb, 2005).
The soil physicochemical analyses were performed by the labo-ratory “Instituto Campineiro de Análise de Solo e Adubo (ICASA)”, according to the methodology proposed by Embrapa (1997), except the following parameters; total nitrogen (laboratory “PIRASOLO – Laboratório Agrotécnico Piracicaba”, according to Embrapa (1997)) and the moisture content (obtained by the oven drying method).
The water sample was collected at the Jaguari river (22o 42' 00"
S / 47o 08' 06" W) located in Paulínia (SP/Brazil). The composite
sample was obtained at the river surface along a transect perpen-dicular to the flow direction. Nearby the sampling location, an oil
refinery (Replan/Petrobras) and roads represent potential sources of contamination. Table 2 summarizes some of the water characteristics (APHA, 1998).
Respirometric experiment
Biodegradation experiments simulated soil and water contamina-tions, respectively from the petrol station and the Jaguari river. The soil and water contamination was carried out by adding fuel (50 ml/Kg of soil; 10 ml/L of water) with the following volume percent compositions of the biodiesel/diesel blend: 0/100; 2/98; 5/95; 20/80 and 100/0, respectively denominated: B0, B2, B5, B20 and B100. The diesel oil and the B2 blend were obtained at petrol stations (respectively, BR and ALE distributors) in Rio Claro (SP/Brazil). The other blends were prepared in laboratory combining the diesel oil with a biodiesel produced from castor oil.
Biodegradation experiments were carried out in Bartha biometer flasks (250 ml) used to measure the microbial CO2 production
(Bartha and Pramer, 1965; Régis and Bidoia, 2005; Mariano et al., 2007a, 2008a,b,c). The CO2 produced is proportional to the
car-bons consumed by microorganisms from the test substrate. Thus, the amount of CO2 is proportional to the percentage of substrate
0 10 20 30 40 50 60 70 80
0 20 40 60 80 100 120
time (days)
C
O
2
d
ia
ry
p
ro
d
u
ct
io
n
(µ
m
o
l.d
-1 ) control
B0 B5 B20 B100
Figure 1. Daily CO2 production during incubation of the first
respirometric experiment with the soil contamination.
0 1000 2000 3000 4000 5000 6000 7000
0 20 40 60 80 100 120
time (days)
cu
m
ul
at
iv
e
C
O
2
p
ro
du
ct
io
n
(µ
m
ol
) control
B0 B5 B20 B100
Figure 2. Cumulative total amounts of CO2 produced by the first
respirometric experiment with the soil contamination during incubation. Each error bar represents 1 SD of three replicate.
total CO2 production can provide excellent information on the
biodegra-dability potential of hydrocarbons (Balba et al., 1998). CO2
evolution measures ultimate degradation (mineralization) in which a substance is broken down to the final products, while, for instance, the gas chromatography (GC) analysis measures primary degrada-tion only in which the substance is not necessarily transformed to the end products.
For each experimental condition, the biometer flasks were pre-pared in triplicates (3 x 50 g of soil or 50 ml of water) and incubated at 27oC in the dark. The CO
2 produced was trapped in a 10.0 ml
solution of KOH (0.2 N), located in the side-arm of the biometer. This solution was periodically withdrawn by syringe, and the amount of CO2 absorbed was then measured by titrating the
residual KOH (after the addition of barium chloride solution (1 ml; 1.0 N) used to precipitate the carbonate ions) with a standard solution of HCl (0.1 N). During this procedure, the biometers were aerated during 1.5 min through the ascarite filters.
Biodegradability test – DCPIP indicator
The biodegradability of the biodiesel/diesel blends was also verified using the technique based on the redox indicator 2,6-dichlorophe-
0 20 40 60 80 100
0 20 40 60 80 100
time (days)
C
O
2
d
ia
ry
p
ro
du
ct
io
n
(µ
m
o
l.d
-1 ) control
B0
B2 (commercial)
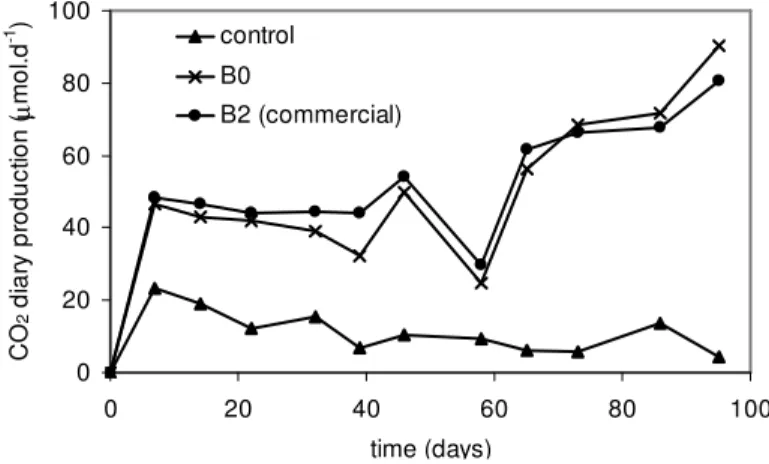
Figure 3. DailyCO2 production during incubation of the second
respirometric experiment with the soil contamination.
nol indophenol (DCPIP) (Hanson et al., 1993). The principle of this technique is that during the microbial oxidation of hydrocarbons, electrons are transferred to electron acceptors such as oxygen, nitrates and sulphate. By incorporating an electron acceptor such as DCPIP to the culture medium, it is possible to ascertain the ability of the microorganism to utilize hydrocarbon substrate by observing the colour change of DCPIP from blue (oxidized) to colourless (reduced). This Hanson et al. (1993) technique has been employed in several works (Cormack and Fraile, 1997; Roy et al., 2002; Mariano et al., 2007b, 2008a,c,d), but for the first time, this technique was used to evaluate the biodegradability of biodiesel/diesel blends.
The capability of three inocula to biodegrade the blends B0, B2, B5, B20, B50 and B100 was tested: consortium 1 (obtained from the soil at the petrol station); consortium 2 (from an uncontaminated soil collected at UNESP campus) and the culture Pseudomonas
aeruginosa LBI (Benincasa et al., 2002).
The inoculum P. aeruginosa LBI was prepared using bacterial
cells transferred from the storage culture tubes and streaked onto the surface of Petri dishes containing PCA medium (Acumedia, EUA). To prepare the other two consortia, 10 g of respective soils were added to Erlenmeyer flasks (125 ml) containing 50 ml of sterile saline solution and kept under agitation for 1 min. After this period, the saline was streaked onto the surface of Petri dishes containing PCA medium. The Petri dishes were incubated during 24h at 35oC and then cells were harvested using sterile saline
solution.
The inocula (1.0 ml, concentration not determined) were added to Erlenmeyer flasks (250 ml, duplicates) that contained sterile Bushnell-Hass (BH) medium (50 ml) and 1% (v/v) of the blends. The concentration of DCPIP was 20 mg/ml. Erlenmeyer flasks were kept under agitation (84 rpm) at 35.0 ± 0.5oC. The BH medium
consists of, gL-1: MgSO
4, 0.2; CaCl2, 0.02; KH2PO4, 1.0; K2HPO4,
1.0; NH4NO3, 1.0; FeCl3, 0.05 (Difco, 1984).
RESULTS
0 1000 2000 3000 4000 5000
0 20 40 60 80 100
time (days)
cu
m
ul
at
iv
e
C
O
2
p
ro
d
uc
tio
n
(µ
m
ol
)
control B0
B2 (commercial)
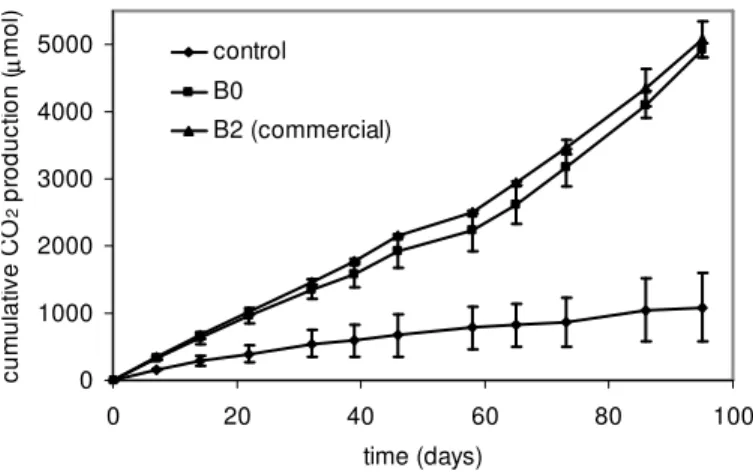
Figure 4. Cumulative total amounts of CO2 produced by the second
respirometric experiment with the soil contamination during incubation. Each error bar represents 1 SD of three replicate.
0 10 20 30 40 50
0 10 20 30 40 50
time (days)
C
O
2
d
ia
ry
p
ro
d
u
ct
io
n
(µ
m
ol
.d
-1 ) controle
B0
B2 - commercial B5
B20 B100
Figure 5. Daily CO2 production during incubation of the
respirometric experiment with the water contamination.
and 2) the total CO
2produced (µmol/ (Kg/day)) from B0,
B5, B20 and B100 were 804.4, 882.6, 911.7 and 1114.9,
respectively. In the second experiment (Figures 3 and 4),
these values for B0 and the blend B2 (commercial) were
1034.5 and 1069.3, respectively. These values and the
curves in the graphics show that the CO
2production
increased as more biodiesel were present in the blend.
Statistically (Anova, p=0.05) only the blend B20 and the
pure biodiesel (B100) differed from B0.
The daily and cumulative CO
2productions during the
respirometric experiment with the water contamination
are shown in Figures 5 and 6, respectively. The total CO
2produced (µmol/(Kg/day)) from B0, B2, B5, B20 and
B100 were 287.1,; 287.5, 334.0, 367.8 and 466.4,
res-pectively. Again, as in the soil contamination, these
values and the curves in the graphics show that the CO
2production increased as more biodiesel was present in
the blend. Statistically (Anova, p=0.05) only the blend
B20 and the pure biodiesel (B100) differed from B0.
0 200 400 600 800 1000 1200
0 10 20 30 40 50
time (days)
cu
m
ul
at
iv
e
C
O
2
p
ro
du
ct
io
n
(µ
m
o
l) control
B0
B2 - commercial B5
B20 B100
Figure 6. Cumulative total amounts of CO2 produced by the
respirometric experiment with the water contamination during incubation. Each error bar represents 1 SD of three replicate.
The results obtained with the biodegradability test using
the redox indicator DCPIP (Table 3) show that the time
necessary to decolourization of the DCPIP indicator
decreased with the increase of the concentration of
biodiesel in the blend.
DISCUSSION
Previous works related to the biodegradation of biodiesel
and diesel blends mainly focused on the water
conta-mination (Zhang et al., 1998; Makareviciene and Janulis,
2003; Pasqualino et al., 2006) with the exception of the
work by Lapinskiené et al. (2006), which evaluated the
microbial transformation of these compounds in soil.
These works demonstrated that biodiesel and the
biodiesel/diesel blends are more easily and faster
bio-degraded than diesel oil. In the present work, similar
results were obtained now with the contamination of soil
from a petrol station and water from a river. Experimental
evidences are the CO
2production in the respirometric
experiments that increased as more biodiesel was
present in the blend and the time necessary for
de-colourization of the indicator in the biodegradability test
using the redox indicator DCPIP, which decreased with
the increase of the concentration of biodiesel in the
blend.
Table 3. Time (in hours) to decolourization of the DCPIP indicator.
Microorganism
first experiment second experiment
B0 B5 B20 B50 B100 B0 B2 (commercial)
consortium 1a 36 29 27 24 22 120 90
consortium 2b 68 44 24 20 20 64 41
P. aeruginosa LBI 28 13 9 8 3 72 20
aFrom the soil at the petrol station bFrom a non-contaminated area
Obs: During the test, no decolourization of the substrate control (without inoculum) or of the inoculum control (without oil) was observed.
0 1000 2000 3000 4000 5000 6000 7000
0 20 40 60 80 100 120
time (days)
cu
m
ul
at
iv
e
C
O
2
p
ro
du
ct
io
n
(µ
m
ol
)
B0
B20 (experimental data) B20 (linear combination) B100
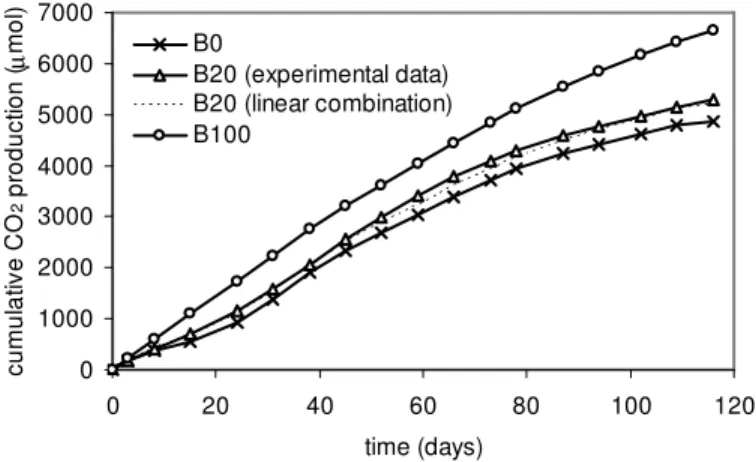
Figure 7. Evaluation of the synergic effect (co-metabolism) for the blend B20 (first respirometric experiment with the soil contamination).
Moreover, the presence of aliphatic cyclic hydrocarbons,
polycyclic aromatic hydrocarbons (PAHs) and
alkylben-zenes, as well as their derivatives such as toluene,
xylenes and PCBs (phenyl and biphenyls) gives the
diesel a composition much more chemically complex.
Another point to be discussed is that Zhang et al.
(1998) and Pasqualino et al. (2006) verified that biodiesel
can promote and speed up the biodegradation of diesel
by means of co-metabolism, that is a term used to
des-cribe the process in which microorganisms use a second
substrate (readily degradable) as the carbon (energy)
source to degrade the first substrate which otherwise is
scarcely attacked by the microorganisms when it is the
sole carbon source. Based on this concept, researchers
verified that in some cases biodiesel can be applied in
contaminated areas as an enhancement agent to
bio-remediation processes (Mudge and Pereira, 1999; Taylor
and Jones, 2001; Obbard et al., 2004 and
Fernández-Álvarez et al., 2006, 2007).
To determine how biodiesel can improve the
bio-degradability of the pure diesel, the synergic effect was
evaluated for the mixtures according to the methodology
proposed by Pasqualino et al. (2006), that is based on
the measurement of CO
2in a respirometric experiment.
The total amount of CO
2(cumulative value) produced
with a certain blend (B2, B5 and B20) was compared to a
linear combination (LC) (Equation 1) of the total amount
of CO
2produced with the pure compounds (B0 and
B100), as follows:
LC = D.(CO
2)
B0+ B.(CO
2)
B100(1)
Where D is the percentage of diesel in the blend, B the
percentage of biodiesel in the blend, (CO
2)
B0the total
amount of CO
2(cumulative value) produced with B0 and
(CO
2)
B100the total amount of CO
2(cumulative value)
produced with B100.
This linear combination was compared with the
experimental values of the blends during the days of the
experiments. Figure 7 shows the results for the soil
con-tamination with the blend B20. This case exemplifies
what was observed for all the other blends considering
both soil and water contaminations. According to the
methodology of analysis adopted, the curves of the
experimental data and that of the linear combination are
coincident, it indicates that, the biodiesel did not improve
the biodegradation of the diesel by means of
co-metabo-lism. It is important to comment that this methodology of
analysis has limitations since it is not based on
chromatographic analysis, which could indicate that only
the biodegradation of certain compounds present in the
diesel could be favoured by the co-metabolism as
observed by Fernández-Álvarez et al. (2007).
The results obtained with the biodegradability test using
the redox indicator DCPIP also indicate that the soil of
the petrol station (from where was obtained consortium 1)
had a microbiota adapted to degrade the fuels and the
tests with consortium 2 show that the presence of
hydrocarbonoclastic microorganisms in soils is
ubiqui-tous, even in unpolluted soils (Venkateswaran and
Harayama, 1995; Ron and Rosenberg, 2002 apud Lee et
al., 2006; Mariano et al., 2008c).
The time demanded by inoculum 1 for the
decolouri-zation of the blend B0 in comparison to B5 decreased
19.4% and for
P. aeruginosa
LBI, 53.6% (Table 3). This
mixed cultures, commensalisms play an important role
since each species may have a specific function in the
enzymatic reaction sequences, responsible for the
breakdown of more complex molecules. Thus, consortia
have less difficulty in biodegrading diesel. This fact is in
agreement with the respirometric data, where the CO
2produced with the blends B2 and B5 did not differ
significantly from the pure diesel (B0).
Conclusion
Although biodiesel is more easily and faster biodegraded
than diesel oil, among the blends evaluated (2%, 5% and
20%), only the blend with higher concentration of
bio-diesel presented biodegradability significantly different
from diesel and it was not verified an improvement on the
biodegradation of the diesel by means of co-metabolism.
In natural environments, as considered in this work, the
commensalisms between different communities of
microorganisms facilitates the biodegradation of diesel
oil, for this reason, the addition of low quantities of
biodiesel (2% or 5%) may not represent a gain when the
biodegradability aspect is concerned.
AKNOWLEDGMENT
The authors acknowledge the
Agência Nacional do
Petróleo, Gás Natural e Biocombustíveis
(ANP)
(PRH-05).
REFERENCES
APHA (American Public Health Association) (1998). Standard methods for the examination of water and wastewater. 20. ed. Washington: American Public Health Association, AWWA, WPCF, p. 1569. Balba MT, Al-Awadhi N, Al-Daher R (1998). Bioremediation of
oil-contaminated soil: microbiological methods for feasibility assessment and field evaluation. J. Microbiol. Methods 32: 155-164.
Bartha R, Pramer D (1965). Features of flask and method for measurement of the persistence and biological effects of pesticides in soil. Soil Sci. 100(1): 68-70.
Benincasa M, Contiero J, Manresa MA, Moraes IO (2002). Rhamnolipid production by Pseudomonas aeruginosa LBI growing on soapstock as the carbon source. J. Food Eng., 54: 283-288.
Cetesb - Companhia de Tecnologia de Saneamento Ambiental (2005). Relatório de estabelecimento de valores orientadores para solos e águas subterrâneas no Estado de São Paulo. Relatório técnico. Cormack WPM, Fraile ER (1997). Characterization of a hydrocarbon
degrading psychrotrophic Antarctic bacterium. Antarctic Sci.
9(2):150-155.
Difco (1984). Difco Manual, 10ed. Detroit: Difco Laboratories.
EMBRAPA - Empresa Brasileira de Pesquisa Agropecuária (1997). Serviço Nacional de Levantamento e Conservação de Solos. Manual de Métodos de Análises de Solos. Rio de Janeiro.
Fernández-Álvarez P, Vila J, Garrido-Fernández JM, Grifoll M, Lema JM (2006). Trials of bioremediation on a beach affected by the heavy oil spill of the Prestige. J. Hazard. Mater., 137: 1523–1531.
Fernández-Álvarez P, Vila J, Garrido-Fernández JM, Grifoll M, Lema JM (2007). Evaluation of biodiesel as bioremediation agent for the treatment of the shore affected by the heavy oil spill of the Prestige. J. Hazard. Mater. 147(3): 914-922.
Gallego JLR, Loredo J, Llamas JF, Vázquez F, Sánchez J (2001). Bioremediation of diesel-contaminated soils: Evaluation of potential in situ techniques by study of bacterial degradation. Biodegradation 12: 325-335.
Hanson KG, Desai JD, Desai AJ (1993). A rapid and simple screening technique for potential crude oil degrading microorganisms. Biotechnol. Tech. 7: 745-748.
Khan N, Warith MA, Luk GA (2007). Comparison of Acute Toxicity of Biodiesel, Biodiesel Blends, and Diesel on Aquatic Organisms. J. Air Waste Manage. Assoc. 57(3): 286-296.
Koo-Oshima S, Hahn N, Van Gerpen J (1998). Comprehensive Health and Environmental Effects of Biodiesel as an Alternative Fuel. Proceedings of the Fall meeting of the Society for Risk Analysis, Paris, France.
Lapinskiené A, Martinkus P, Rebzdaite V (2006). Eco-toxicological
studies of diesel and biodiesel fuels in aerated soil. Environ. Poll. 142: 432-437.
Lee M, Kim MK, Singleton I, Goodfellow M, Lee ST (2006). Enhanced biodegradation of diesel oil by a newly identified Rhodococcus
baikonurensis EN3 in the presence of mycolic acid. J. Appl. Microb.
100: 325-333.
Makareviciene V, Janulis P (2003). Environmental effect of rapeseed oil ethyl ester. Renewable Energy 28: 2395–2403.
Mariano AP, Kataoka APAG, Bonotto DM, Angelis DF (2007a). Laboratory study on the bioremediation of diesel oil contaminated soil from a petrol station. Braz. J. Microbiol. 38: 346-353.
Mariano AP, Bonotto DM, Angelis DF (2007b). Monitoramento de indicadores geoquímicos e avaliação de biodegradação em área contaminada com óleo diesel. Rev. Eng. Sanit. Amb. 12(3): 296-304. Mariano AP, Bonotto DM, Angelis DF, Pirôllo MPS, Contiero J (2008a).
Biodegradability of commercial and weathered diesel oils. Braz. J. Microbiol. 39: 133-142.
Mariano AP, Crivelaro SHR, Angelis DF, Bonotto DM (2008b). The use of vinasse as an amendment to ex-situ bioremediation of soil and groundwater contaminated with diesel oil. Braz. Arch. Biol. Technol. Accepted for publication.
Mariano AP, Bonotto DM, Angelis DF, Pirôllo MPS, Contiero J (2008c). Investigation about the efficiency of the bioaugmentation technique when applied to diesel oil contaminated soils. Braz. Arch. Biol. Technol. Accepted for publication.
Mariano AP, Bonotto DM, Angelis DF, Pirôllo MPS, Contiero J (2008d). Use of weathered diesel oil as a low-cost raw material for biosurfactant production. Braz. J. Chem. Eng. Accepted for
publication.
Obbard JP, NG, KL, XU, R (2004). Bioremediation of petroleum conta-minated beach sediments: use of crude palm oil and fatty acids to enhance indigenous biodegradation. Water, Air Soil Pollut. 157: 149-161.
Pasqualino JC, Montané D, Salvadó J (2006). Synergic effects of biodiesel in the biodegradability of fossil-derived fuels. Biomass Bioenergy 30: 874-879.
Pinto AC, Guarieiro LLN, Rezende MJC, Ribeiro NM, Torres EA, Lopes WA, Pereira PAP, Andrade JB (2005). Biodiesel: An Overview. J. Braz. Chem. Soc. 16(6B): 1313-1330.
Régis G, Bidoia ED (2005). Electrolytic treatment applied to the industrial effluent containing persistent wastes monitored by Bartha respirometric assays. Braz. Arch. Biol. Technol. 48(2): 319-325. Roy S, Hens D, Biswas D, Kumar R (2002). Survey of
petroleum-degrading bacteria in coastal waters of Sunderban Biosphere Reserve. World J. Microb. Biotechnol. 18: 575-581.
Taylor LT, Jones DM (2001). Bioremediation of coal tar PAH in soils using biodiesel. Chemosphere 44: 1131-1136.
Venkateswaran K, Harayama S (1995). Sequential enrichment of microbial populations exhibiting enhanced biodegradation of crude oil. Can. J. Microbiol. 41: 767-775.