45
Plant Phytomass Changes in a Larch Forest of the Lake Hövsgöl Area,
Northern Mongolia
Jamsran Oyumaa
1and Tseden Jamsran
21Dalai Van College, Muren, Hövsgöl Aimag, Mongolia, E-mail: [email protected] 2Department of Botany, FacultyofBiology, National University Mongolia, Ulaanbaatar 210646, Mongolia
Abstract
In the present study we related the decrease of the vegetation productivity in a larch forest with an increase of the air temperature over a 20-year period (1987-2007). During the years of the study the data
from nearby weather stations showed warming and drying trends in climatic conditions: a 1.60C increase
of mean annual temperature, increase in maximum and minimum temperature extremes, and delay of summer rains. Plant community changes include the shift in species dominance from mesophytes to xerophytes, decrease in vegetation cover and plant height, and transformation of a single July blooming peak to the more diffuse blooming season. We also showed the plant phytomass of the larch forest of the Hövsgöl region is decreasing in response to the climate changes.
Key words: Phytomass dynamics, air temperature, precipitation, Lake Hövsgöl, vegetation cover
Introduction
The Lake Hövsgöl National Park is located
in the northern part of Mongolia at 500-510N,
980-1010E. This protected area surrounds
Lake Hövsgöl, which is reported to contain the world’s freshest water. The area includes two distinct vegetation landscape types: alpine and mountain taiga forest to the west of the lake, and forest-steppe to the east. The forests consist predominantly of coniferous trees, constituting a boreal, typical Siberian taiga. They are subdivided
into the dark colored pine forest (Pinus sibirica
and Picea obovata) and the light colored coniferous larch forest (Larix sibirica). The larch forest is predominant across the forest-steppe area on the east of the lake. Its vegetation cover
includes diverse forbs and shrubs (Betula humilis,
Rhododendron parvifolium, Vaccinium vitisi-daea
and V. uliginosum) (Batraeva et al., 1982).
The Hövsgöl region experiences a harsh continental climate with four sharply de! ned seasons and large diurnal temperature " uctuations. Winter season is long, cold and dry; summer is short, hot and dry. Average monthly temperatures range from ¡120C in July to -210C in January. Mean
yearly temperature is equal to -4.50C, absolute
maximum of ¡350C, and absolute minimum of
-490C (Nandintsetseg et al., 2007). Average annual
precipitation ranges from 250 to 450 mm with a mean of 300 mm. Precipitation peaks in the
summer months, averaging 22.4 mm for May, 52.6 mm for June, 87.6 mm for July, and 77.1 mm for August. Wind direction is predominantly from the northwest and south and its speed averages 2-3 m/sec (Bufal et al, 1989).
The protected area is underlain by continuous permafrost, which keeps the soils of the forests cool and wet in summer months. As the Arctic or boreal regions, permafrost and its associated plant communities are threatened by global climate change and warming. The effects of these warming patterns on different landscapes can be diverse, changing plant development, reproduction, vegetation type, cover and phytomass (IGBP, 1999).
Since 1963, a weather station has been maintained in the village Hatgal at the southern end of Lake Hövsgöl, providing excellent local weather records. Statistical analysis of the weather data for 1963-2002 revealed a clear record of
a regional warming trend (1.60C increase in
average annual air temperature for the period) (Nandintsetseg et al., 2007).
In 1987, we established a new geobotanical research plot near the weather station at the southern end of the lake to monitor plant phenology and phytomass, successional changes in the plant community and anthropogenic in" uences from tourism and livestock grazing in the national park (Oyumaa & Erdenetsetseg, 2004, 2008).
Recent environmental conditions have
contributed to vegetation change. From 1995 to 1997, extreme wild! res destroyed large areas of regional forests. Unusual insect outbreaks and increasing livestock grazing around the lake area affected further on the forests and steppes. This combination of ! re, insect damage and overgrazing has contributed to the climate warming by
increasing levels of atmospheric CO2 and, as a
result, air temperatures (Foley et al., 2000). Our goal was to study the responses of plant growth to climate warming. In the present work, we examine the plant phytomass dynamics in a larch forest. We studied the ! ve variables of the vegetation over twenty-years of period to estimate their change in the Hövsgöl Lake region.
In this report, we analyze the plant phytomass data from this research plot for the years of 1987-1989 and 1991-2007 (hereafter referred to as 1987-2007), relating to the meteorological data from the Hatgal weather station.
Material and methods
The study area, Ar Davkhar is located at
50025.386N, 100015.872E on the eastern side of
Lake Hövsgöl. At the present time, there is no herding of animals or nomadic camps in the area. Larch forest prevails, and the vegetation cover
consisted of mesophytic forbs, such as Aconitum
exelsum, A. barbatum, Geranim pratense, Vicia
cracca, Lathyrus humilis and Bromus inermis.
We choose our study plots with as little direct human impact as possible, i.e., they are not currently used as pasture by domestic herds. We started data collection when plants start to grow, and ended each season when the biomass is decreased.
We measured aboveground cover phytomass of the brome-forbs with ten-day intervals during the growing season for twenty years. The four corners of the study area, 50 x 50 m of size were marked inside the larch forest. In the study area, the sampling plots were randomly selected with area of 25 x 25 cm each with ! ve replications.
Results
In the larch forest of the eastern side of Hövsgöl Lake the mesophytic plants predominate with a few grasses that regerminate from the perennating bud. At the beginning of the growing season, the soil contains no plants, but is covered by the old larch needles, cones, and torn branches. The growth, following germination, budding or bolting in forest vegetation starts later than the growth in nearby steppe and meadow communities that are dominated by large-leaved
plants, light in weight, e.g. Bromus inermis,
Saussurea amara, Delphinium crassifolium, Aconitum Czekanovskyi, A. barbatum, Geranium
Table 1. Plant phytomass (g/m2) changes in a larch forest of the eastern side of Lake Hövsgöl (1987-2007)
year May decade June decades July decades August decades M±m
20-30 1-10 10-20 20-30 1-10 10-20 20-30 1-10 10-20
sibiricum and Vicia cracca. In the forest, the plant phytomass was greater that of the ! rst 10 years.
The earliest growing plants are Potentilla nivea,
Dendranthemum zawadskii, Bromus inermis and
some othermesophytic species.
Table 1 demonstrates the changes in the plant phytomass throughout the growing season over the 20-year period.
For the mesophytic plants, the biomass increases to reach its maximum value at the time of blooming and seed set. By the end of August, these plant species becoming dry and matted, and their biomass declines. In case of short-lived species, those that bloom after two years of growth, the ! rst year plants are reduced to ground-level buds, “bold off,” and the phytomass decreases.
Seasonal dynamics of the plant phytomass. In northern Mongolian, spring germination, budding, and bolting start later in the forests than in other vegetation types. In May, there was almost no phytomass on the ground of the forest, but only previous year’s decaying litter was available. By the end of May only a few species, such as
Potentilla nivea, Dendranthemum zawadskii, Bromus inermis etc. are begin to grow. However, because of these plants have short stems and grow sparsely, their phytomass increases very slowly.
At the beginning of June, mesophytes,
such as Aconitum exelsum, A. barbatum,
Campanula Turczaninovii, Geranium pratense, G. pseudosibiricum, Aegopodium alpestre, and
Peucedanum baicalense begin growing and soon cover the ground, and their phytomass increases
quickly (up to 40.0 g/m2). During this period, we
recorded 20 to 30 species of plants in the study plots; however the species composition was different from year to year.
In mid summer, between July 10 and August 10, the plant vegetative organs, stems and leaves, reached their maximum size, and subsequently their growth stopped. Many of the plants show intensive development of generative organs, " owers and bracts, followed by fruit and seeds. In this period, plants with large, wide leaves, often on tall stems, cover the ground and phytomass
reaches its maximum value (156 g/m2) (Table 1).
After August 10, the vegetative organs of the large-leaved plants begin to dry up and becoming yellowish and the phytomass decreases steadily (to 65 g/m2). Although their leaves still stay large,
they quickly become very light in weight. At this time most of the biomass consists of sparse
bromes and grasses, such as Bromus inermis, Poa
sibirica, Festuca sibirica, and Carex ensifolia.
Because these grasses have very strong, ! brous
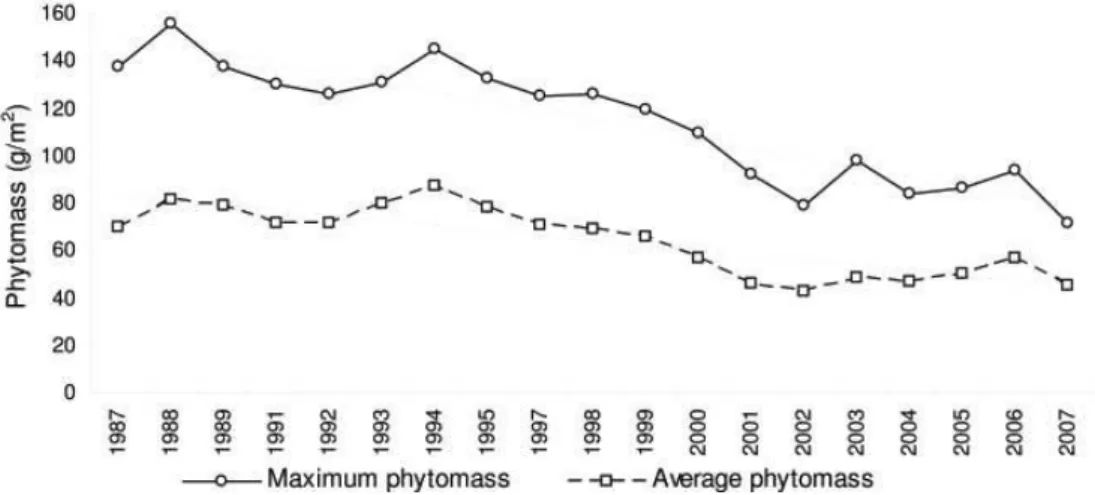
roots and resistant leaves, they keep their stems throughout the fall and winter. During our study, the phytomass of herbs in the larch forest was more or less constant (Fig. 1).
Over the 20 years of study, we revealed a decrease in the yearly phytomass production of plant. In the ! rst half of the study (1987-1997) the average yearly phytomass " uctuated between 70 and 88 g/m2, but in the last 10 years the plant
phytomass decreased. Results of our study show that, the phytomass dynamics are affected due to average air temperature and total precipitation.
We related the decrease of the plant phytomass with changes of the air temperature and precipitation over the same period. In the ! rst 10 years of the study, the average air temperature of
the growing season was constant, between ¡70C
and ¡80C, and the precipitation was plentiful
during the growing season. But, over the last 10
years of the study, the average air temperature is
increased by 0.90C over the growing season, with
signi! cant increases of average temperature in May (1.30C), June (1.760C), and July (1.60C). The
correlation between decreases in plant biomass with increases in average air temperature suggests that climate change is impacting the vegetation.
For example, the lowest phytomass value (43.2
g/m2) in the 20-year period was measured in 2002,
a year with very high temperatures (mean value
¡150C) in July, and very low precipitation (35.6
mm) during the growing season. This growing season was the hottest and driest ever recorded in the Hövsgöl region.
From 2002 to the end of the study period, the average plant phytomass was lower than in the ! rst ten years. In 2003, a year of adequate precipitation and optimal average temperature, the phytomass is increased over the 2002 value, but only reached
48.3 g/m2. The phytomass value in 2006 was the
maximum for the last 10 years of the study, but was lower than those in the ! rst 10 years. Also, for the last 10 years the plant growth is continued through August, later than in previous years. The factor that may have positively in" uenced on phytomass production is high amount of precipitation early in the 2003 growing season. May 2003 had 39 mm of precipitation, much more than in other years. However, even with these excellent growing conditions, the phytomass production was low, perhaps due to the lasting effects of the 2002 growing season. From this we can conclude that precipitation is not suf! cient factor to explain annual phytomass values.
The timing of the phytomass maximum was very different among the years of the study. For example, in 1994 phytomass reached its maximum
value (145 g/m2) in July. However, precipitation
was higher in that year than other years (yearly total 442.7 mm), but most of which fallen early in the growing season (23 mm in May, 150 mm in June),
and the air temperature was warm (¡100C). As a
result, plant development has started and ended earlier than in other years. When precipitation was high in early growing season as in 1994, the high air temperature can lead to the increase of phytomass. Figure 2 shows phytomass decrease in the Lake Hövsgöl region over the 20-year period. Whereas degradation of worldwide vegetation cover has been reported since 1970’s (Iwasa et al., 1996; Kohyama & Shigasada, 1996; IGBP, 1999), our research shows the signi! cant degradation of vegetation cover in the Hövsgöl region has appeared in the last 10 years only. For example, the phytomass of plants decreased by 26-30% between 1997 and 2007 as compared to data for 1987-1997. Earlier studies (1981-1985) of the ! eld station in Hanh showed a stable or slightly increased amount of plant phytomass (Barytskaya
et al., 1988). We observed decrease in the vegetation cover, plant height and phytomass. We found that mesophytic species for the area that are characteristic of larch forest did not complete their growth and development, and they were being replaced by xerophytic species.
Correlation between phytomass amount and some weather conditions. The changes in the plant phytomass by years were correlated to changes of air temperature and precipitation amounts.
In the study area photosynthesis and phytomass increase should have their highest values at the beginning of the vegetation period, when
average air temperature is no more than ¡100C,
and total precipitation is more than 40 mm per
month. However, in recent years the average air temperature in July has reached ¡150C in this area
(see Table 2), and much of the precipitation has fallen too late in the growing season.
Over the study period, average annual air temperature and cumulative precipitation have both increased, although air temperature shows a greater increase than precipitation, with regression of 0.739 and 0.011, respectively. Average air
temperature has increased by as much as 0.90C,
over the last 10 years. Over the same period, the average phytomass of the vegetation is decreased steadily.
Therefore, average phytomass was negatively
and strongly correlated to temperature (r=-0.66,
p=0.002) (Fig. 3A) and not correlated to cumulative
precipitation (r=0.15, p=0.57) of the growing
season (Fig. 3B).
It is likely that the phytomass decrease is not related to the cumulative precipitation for any year, but to the timing of the precipitation falling early in the growing season, which leads to phytomass increases.
The phytomass of May has weak positive relationship to precipitation (r=0.3), the phytomass
of June has mean positive relationship (r=0.5)
to total precipitation. However, relationship of the phytomass and air temperature of July, were
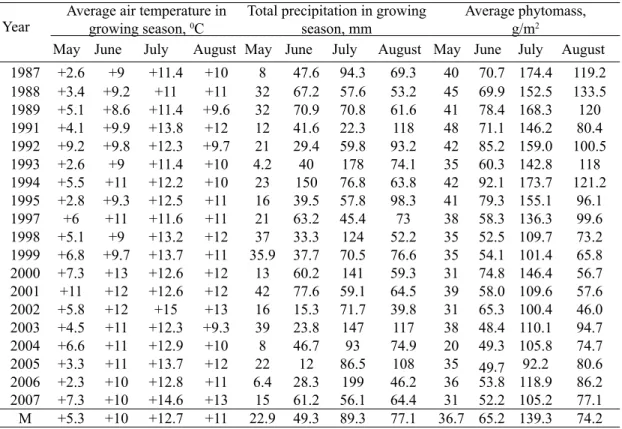
Table 2. Some parameters of the weather and plant phytomass
Year
Average air temperature in growing season, 0C
Total precipitation in growing season, mm
Average phytomass, g/m2
May June July August May June July August May June July August
1987 ¡2.6 ¡9 ¡11.4 ¡10 8 47.6 94.3 69.3 40 70.7 174.4 119.2
1988 ¡3.4 ¡9.2 ¡11 ¡11 32 67.2 57.6 53.2 45 69.9 152.5 133.5
1989 ¡5.1 ¡8.6 ¡11.4 ¡9.6 32 70.9 70.8 61.6 41 78.4 168.3 120
1991 ¡4.1 ¡9.9 ¡13.8 ¡12 12 41.6 22.3 118 48 71.1 146.2 80.4
1992 ¡9.2 ¡9.8 ¡12.3 ¡9.7 21 29.4 59.8 93.2 42 85.2 159.0 100.5
1993 ¡2.6 ¡9 ¡11.4 ¡10 4.2 40 178 74.1 35 60.3 142.8 118
1994 ¡5.5 ¡11 ¡12.2 ¡10 23 150 76.8 63.8 42 92.1 173.7 121.2
1995 ¡2.8 ¡9.3 ¡12.5 ¡11 16 39.5 57.8 98.3 41 79.3 155.1 96.1
1997 ¡6 ¡11 ¡11.6 ¡11 21 63.2 45.4 73 38 58.3 136.3 99.6
1998 ¡5.1 ¡9 ¡13.2 ¡12 37 33.3 124 52.2 35 52.5 109.7 73.2
1999 ¡6.8 ¡9.7 ¡13.7 ¡11 35.9 37.7 70.5 76.6 35 54.1 101.4 65.8
2000 ¡7.3 ¡13 ¡12.6 ¡12 13 60.2 141 59.3 31 74.8 146.4 56.7
2001 ¡11 ¡12 ¡12.6 ¡12 42 77.6 59.1 64.5 39 58.0 109.6 57.6
2002 ¡5.8 ¡12 ¡15 ¡13 16 15.3 71.7 39.8 31 65.3 100.4 46.0
2003 ¡4.5 ¡11 ¡12.3 ¡9.3 39 23.8 147 117 38 48.4 110.1 94.7
2004 ¡6.6 ¡11 ¡12.9 ¡10 8 46.7 93 74.9 20 49.3 105.8 74.7
2005 ¡3.3 ¡11 ¡13.7 ¡12 22 12 86.5 108 35 49 7 92.2 80.6
2006 ¡2.3 ¡10 ¡12.8 ¡11 6.4 28.3 199 46.2 36 53.8 118.9 86.2
2007 ¡7.3 ¡10 ¡14.6 ¡13 15 61.2 56.1 64.4 31 52.2 105.2 77.1
M ¡5.3 ¡10 ¡12.7 ¡11 22.9 49.3 89.3 77.1 36.7 65.2 139.3 74.2
signi! cantly negative relationship (r=-0.66).
Given the negative correlation between average air temperature and average phytomass, continued increases in temperature may result in further declines in vegetation cover.
Conclusions
In a larch forest in the eastern of Lake Hövsgöl, the phytomass of the brome-forb vegetation cover has continuously decreased since 1995. This phytomass decrease is strongly and negatively,
correlated (r=-0.66) with the average air
temperature of the growing season that may be a consequence of global warming. Not only the average air temperature has increased, but also the maximum air temperature of growing season has
increased by 2.30C over the last 10 years. Over
the same time span, the average phytomass of the larch forest’s vegetation has decreased by 21.3 g/ m2, i.e. by 28%.
productivity may be more related to the timing of precipitation than its amount.
Result of 20 years study shows the optimal condition for the phytomass productivity of vegetation cover in the larch forest of the Lake Hövsgöl region is when the average air temperature not greater than ¡100C, and total precipitation is
more than 40 mm in early growing season (May and June). Ongoing global warming changes in the timing of precipitation have the potential of further reducing phytomass productivity of the vegetation cover in larch forests, and changing the characteristics of these communities.
Acknowledgements
We thank the specialists and rangers from Lake Hövsgöl National Park Administration, who collected some research materials. We would like to thank Paula De Priest, Claudia Rector and B.
Bayartogtokh for their comments that improved the manuscript.
References
Barytskaya, B. A., Ivelskaya, B. I., Frolova, M. B. & Jamsran, Ts. 1988. Seasonal and yearly dynamics of the productivity of steppe phytocoenosis in Northern Hövsgöl. In:
Natural Conditions and Resources of Hövsgöl Region. Irkutskyi State University Press. 16: 24-26. (in Russian)
Batraeva, A. A., Ivelskaya, B. I., Malyshev, L. I. & Frolova, M. B. 1982. Patterns of plant growth in the phytocoenosis of Northern Hövsgöl
Region. In:Natural Conditions and Resources
of Hövsgöl Region. Moscow. 12: 55-58. (in Russian)
Bufal, V. V., Filippov. A. Kh., Batdelger, D., Tsoozol, M. 1989. Climate and water of
the Hövsgöl Region. In O. M. Kozhova., O.
Shagdarsuren. & A. Dashdorj. (ed): Lake
Hövsgöl Atlas. Ministry of Geodesy and Cartography of USSR. Moskow. pp.101-102. (in Russian)
Foley, J. A., Levis, S., Costa, M., Corner, W. & Pollard, D. 2000. Incorporating dynamic vegetation cover within global climate models.
Ecological Applications 10 (6): 1620-1632. Global Change. Vegetation Model. 1999.
Natural disturbences and Human Land Use in Dynamic
Global Vegetation Model. International
Geosphere-Biosphere Programme (IGBP) of the International Council of Scienti! c Unions (ICSU), Series 3. 102 pp.
Iwasa, Y., Kubo, T. & Sato, K. 1996. Maintenance of forest species diversity and latitudinal gradient. In T. Hirose. & MJA. Werger. (ed.):
Global Change and Terrestrial Ecosystems in Monsoon Asia. London: Kluwer Academic Publishers. pp. 127-133.
Kohyama, T. & Shigasada, N. 1996. A size-distribution-based model of forest dynamics
along a latitudinal gradient. In T. Hirose.
& MJA. Werger. (ed.): Global Change and Terrestrial Ecosystems in Monsoon Asia.
Kluwer Academic Publishers. London. pp.117-126.
Nandintsetseg, B., J, Greene, S. & Goulden, C. E.. 2007. Trend in extreme daily precipitation and temperature near Lake Hövsgöl, Mongolia.
International Journal of Climatology 27: 341-347.
Oyumaa, J. & Erdenetsetseg, B. 2004. Results of dynamics of phytomass of the graminae-forb steppe in the Eastern Hövsgöl Lake.
Proceeding of the Institute of Meteorology and Hydrology 26: 74-79. (in Mongolian)
Oyumaa, J. & Erdenetsetseg, B. 2008. Weather in" uence on the plant development of the
southern part of the Lake Hövsgöl. Proceeding
of the Institute of Meteorology and Hydrology
30. (in Mongolian; in press)
!"#$$%&"'
™{‹‡†‚` ˆˆ? \•}@|\‹•` ••?•‹•‹‰ ˆ?|\•\‹ `••?•|‰ ‡{?‡{` `•‹••‹˜ Q\‚|\\| †‹?__‹{‡ …•?†‹|••? *•€@|•‹ `ˆˆ?•` …__` ••`•ƒ ‰\‹ƒ •?^†‡ ^†`{@{` •‚` @•|••€•?-\‹\| •€@‰ Q_‹|{•ƒ‹†‚` •€@‹•| ˆ?|\•‹•` |\…?•` ƒ{{ƒ ‡{@|†‚` ¬†‰••\@@•` ‡•ƒ‹•‹…_‚| 1987-2007 •` ‡_?‰{‹ 20 ˜†‹†‚` ‰ˆ?^ @ˆƒ\‹˜, ‰ˆ‡\‚` ‡ˆ|\—\\`• ‡ˆ? ‰ˆ`\ƒ\@, \|\\?•` ‰£•Š£?\‰ˆ?‰\‚ ‡•‹Q•` a€• _…‹{{. ¤ˆƒ\‹|\\`• {‡`†‚ 10 ˜†‹{{@ @__‹†‚` 10 ˜†‹ƒ \|\\?•`
‰£•Š£?\‰ˆ? 5-? @\?ƒ 1.30¤, 6-? @\?ƒ 1.70¤,
7-? @\7-?ƒ 1.60¤-\\? ‰ˆ@ ‰ˆ@ `{•{|ƒ{˜, ˆ?|\•‹•`
ˆ?|\‹‰•` ‡ˆ|\—\\`ƒ ¡300¤-{{@ †‹__ |\?• ‡\‹˜
Q\‚|\\ `} ¬†‰••\@@•` ‡ˆ?†•‰‹\‹ƒ @•?|••?
`•‹••‹˜, ˆ?|\—•` ‡{•˜{{ 15-35 |/•2 QˆŒˆ
23%-\\? Qˆˆ?•{{. ž`{‡__ Qˆˆ?\‹‰\`ƒ `•‹••‹•‡ ‡_•†` …_‚‹†‚` ‡\•\\?‹•| ‰••—•˜ _…{‡{ƒ ‡ˆ?
‰ˆ`\ƒ\@‰\‚ 5-? @\?ƒ Q\|\ (r=0.3), 6-? @\?ƒ ƒˆ`ƒ
(r=0.5) …{?{| ‡\•\\?\‹‰\‚ Q\‚|\\ Q•‹ 7-? @\?ƒ
\|\\?•` ‰£•Š£?\‰ˆ? `{•{|ƒ{˜ Q\‚|\\‰\‚ ‡_•‰{‚
@•?•| ‡\•\\?\‹‰\‚ (r=-0.66) Q\‚`\. ¤ˆƒa‹|\\`•
‡ˆ|\—\\`ƒ *•€@|•‹ `ˆˆ?•` ••`•ƒ ‡{@{|‰ ˜†‹†‚` ‡ˆ? ‰ˆ`\ƒ\@`• `†‚‹Q{? ‡{•˜{{ ‡{€†‚` _…__‹{‹‰‰{‚ Q\‚|\\ Q•‹•€• ‡ˆ? ‰ˆ`\ƒ\@`• †‡{`‡ `} ˆ?|\•‹•` ‡•|˜†‹ |_‚—@{`†‚ ƒ\?\\ •?˜ Q\‚|\\ `} ¬†‰••\@@•` Qˆˆ?\x\ƒ `•‹••‹˜ Q\‚`\. *•€@|•‹ `ˆˆ?•` •?•†•ƒ 5, 6-? @\?ƒ
\|\\?•` ƒˆ`ƒ\˜ ‰£•Š£?\‰ˆ? ¡100¤-{{@ †‹__|_‚,
‡ˆ? ‰ˆ`\ƒ\@ 5-? @\?ƒ 20 ••, 6-? @\?ƒ 40 ••, 7-? @\?ƒ 70 ••-{{@ Q\|\|_‚ Q\‚‡\ƒ ˆ?|\•‹•` ˆ?|\‹‰ ‡{€†‚` +€\|ƒ\˜, ¬†‰••\@@•` ‡ˆ?†•‰‹\‹ ‡{€†‚` QˆŒˆ •‹•` ˜†‹†‚` ƒˆ`ƒ˜†‚` ‡{•˜{{`ƒ Q\‚ƒ|†‚| ‰•|‰••‹••.