Submitted 31 July 2015 Accepted 12 October 2015 Published29 October 2015
Corresponding author
Cassidy C. D’Aloia, [email protected]
Academic editor
Peter Prentis
Additional Information and Declarations can be found on page 17
DOI10.7717/peerj.1369
Distributed under
Creative Commons Public Domain Dedication
OPEN ACCESS
Genetic models reveal historical patterns
of sea lamprey population fluctuations
within Lake Champlain
Cassidy C. D’Aloia1,2, Christina B. Azodi3,4, Sallie P. Sheldon2, Stephen C. Trombulak5and William R. Ardren6
1Department of Ecology & Evolutionary Biology, University of Toronto, Toronto, Ontario, Canada
2Department of Biology, Middlebury College, Middlebury, VT, USA
3Department of Plant Biology, Michigan State University, East Lansing, MI, USA
4Department of Molecular Biology and Biochemistry, Middlebury College, Middlebury, VT, USA
5Department of Biology and Program in Environmental Studies, Middlebury College, Middlebury, VT, USA
6Western New England Complex, US Fish and Wildlife Service, Essex Junction, VT, USA
ABSTRACT
The origin of sea lamprey (Petromyzon marinus) in Lake Champlain has been heavily debated over the past decade. Given the lack of historical documentation, two competing hypotheses have emerged in the literature. First, it has been argued that the relatively recent population size increase and concomitant rise in wounding rates on prey populations are indicative of an invasive population that entered the lake through the Champlain Canal. Second, recent genetic evidence suggests a post-glacial colonization at the end of the Pleistocene, approximately 11,000 years ago. One limitation to resolving the origin of sea lamprey in Lake Champlain is a lack of historical and current measures of population size. In this study, the issue of population size was explicitly addressed using nuclear (nDNA) and mitochondrial DNA (mtDNA) markers to estimate historical demography with genetic models. Haplotype network analysis, mismatch analysis, and summary statistics based on mtDNA noncoding sequences for NCI (479 bp) and NCII (173 bp) all indicate a recent population expansion. Coalescent models based on mtDNA and nDNA identified two potential demographic events: a population decline followed by a very recent population expansion. The decline in effective population size may correlate with land-use and fishing pressure changes post-European settlement, while the recent expansion may be associated with the implementation of the salmonid stocking program in the 1970s. These results are most consistent with the hypothesis that sea lamprey are native to Lake Champlain; however, the credibility intervals around parameter estimates demonstrate that there is uncertainty regarding the magnitude and timing of past demographic events.
Subjects Aquaculture, Fisheries and Fish Science, Ecology, Genetics
INTRODUCTION
The origin of the landlocked population of sea lamprey (Petromyzon marinus) in Lake Champlain has been the subject of an ongoing debate in recent years (Bryan et al., 2005;
Waldman, Grunwald & Wirgin, 2006;Waldman et al., 2009;Eshenroder, 2009;Eshenroder, 2014). The sea lamprey is an anadromous fish that has a parasitic juvenile phase during which it feeds on the bodily fluids of a variety of prey fishes, including large salmonids such as lake trout (Salvelinus namaycush), Atlantic salmon (Salmo salar), and lake whitefish (Coregonus clupeaformis), as well as lake sturgeon (Acipenser fulvescens). Recent research has suggested that native coastal populations of sea lamprey may have positive environmental impacts on freshwater streams. For example, post-spawning sea lamprey carcasses may be important sources of marine-derived nutrients and materials in oligotrophic streams (Guyette et al., 2014). However, the overall effect of landlocked sea lamprey populations in the Great Lakes and Lake Champlain has been detrimental. Lamprey-induced collapses of native fish populations have been well documented in the region since the 1970s (Smith, 1971;Smith & Tibbles, 1980).
Consequently, control efforts were developed in the Great Lakes to suppress sea lamprey populations and facilitate restoration of native species. Control methods are varied and include widespread biocide use, physical migration barriers, and spawning-phase traps in tributaries. Although these methods have been criticized for the potential negative effects that non-target species may experience (McLaughlin, Marsden & Hayes, 2003), the effort has been largely successful in terms of lamprey control. Using the methods developed in the Great Lakes, an experimental lamprey control program was implemented in Lake Champlain in 1990, followed by a long-term program beginning in 2001. Although the control methods in Lake Champlain are similar to those in the Great Lakes, a major difference is the consensus regarding the fish’s status as native versus invasive; in the Great Lakes, sea lamprey are known to be invasive (with the exception of Lake Ontario), while much debate surrounds the population in Lake Champlain.
Lakes populations using mitochondrial non-coding DNA and concluded that the data were most consistent with a post-glacial colonization during a period when modern-day Lake Champlain was an arm of the Atlantic Ocean called the Champlain Sea. However, neither hypothesis has been widely accepted throughout the scientific and management communities. The “nonnative” hypothesis has been criticized because it is based on the absence of species documentation data during the 1800s—a time when systematic biological censuses were not conducted in the lake—and because it lacks due consideration of the post-glacial geological history of the region. Likewise, the “native” hypothesis has recently been called into question after an extensive review of historical documentation suggested that the time of origin used in genetic models (1841) was based on an erroneous species identification and, subsequently, may have biased the results (Eshenroder, 2014).
As a result of this ongoing debate, prior research has focused exclusively on the timing of the origin ofP. marinusin Lake Champlain, while little is known about the rest of the population’s history. The two previous genetic studies ofP. marinusin the lake were regional studies that compared the Lake Champlain sea lamprey population to other populations from the Great Lakes and the Atlantic Ocean (Bryan et al., 2005;Waldman, Grunwald & Wirgin, 2006). While both studies found evidence for long-term vicariance from anadramous and other freshwater populations, it has proven challenging to reconcile the results with the complete lack of historical documentation of sea lamprey in Lake Champlain (Bryan et al., 2005). Given that these regional studies have already shown the Lake Champlain population to be differentiated from all other populations, additional analyses can further probe the genetic data by conducting rigorous intra-population analyses to model historical population dynamicswithinLake Champlain. An objective assessment of the timing and magnitude of fluctuations in population size over time may therefore provide a more complete understanding of the history ofP. marinusin Lake Champlain, while simultaneously shedding new light on the contentious topic of whether or not the species is invasive.
In cases such as this one, where historical census data are unavailable, genetic markers can be powerful tools for inferring demographic fluctuations. These inferences are possible because the census population size (Nc) is generally proportional to the effective
popu-lation size (Ne). Effective population size is the size of an idealized population (i.e., with
binomial variance in reproductive success, an equal sex ratio, and discrete generations), that is subject to the same level of genetic drift and inbreeding as the census population (Wright, 1938). Drawing on the relationship between effective and census population size, and the fact that rapid demographic fluctuations can be detected with genetic markers, we can investigate how effective population size has changed over time and, in turn, infer proportional changes in the overall population (Waples, 1989;Frankham, 1995).
Traditionally, genetic approaches to estimating historical demography have used summary statistics to test whether extant population-level data deviate from theo-retical expectations under alternative models of population stasis, contractions, and expansions (Cornuet & Luikart, 1996;Harpending et al., 1998;Schneider & Excoffier, 1999;
the distribution of observed pairwise differences between all haplotypes in a population to the distribution expected under a specified population change. Expansions, contractions, and equilibrium each generate a particular pattern of the distribution of pairwise diff er-ences among sequer-ences. Contractions or equilibrium lead to multimodal, ragged distribu-tions while expansions result in a smooth unimodal Poisson distribution of pairwise diff er-ences (Harpending et al., 1998;Schneider & Excoffier, 1999). These moment-based metrics are widely used because they are easy to obtain with sequence and/or allele frequency data. However, they provide crude approximations of population changes, and their precision is linked to the timing and magnitude of the demographic change in question.
Arguably, a more powerful approach to inferring past demographic change is coalescent modeling (Storz & Beaumont, 2002;Beaumont & Rannala, 2004). Coalescent theory seeks to describe the ancestral relationship of a particular gene or set of genes by recognizing that the probability of two lineages coalescing during a particular generation is inversely proportional to effective population size at that time (Beaumont & Rannala, 2004;Kuhner, 2008). Thus, these models trace separate genetic lineages back to their most recent com-mon ancestor (Kuhner, 2008) and connect these genealogies to changes in effective pop-ulation size (Storz & Beaumont, 2002). Models such as BEAST and Msvar adopt Bayesian Markov chain Monte Carlo (MCMC) methods to explore parameter space and sample the posterior distributions of the demographic parameters of interest (Beaumont, 1999; Drum-mond & Rambaut, 2007). A key advantage to these methods is the ability to include time as one of the estimated parameters, as opposed to using fixed time points as assumptions in the model. Directly estimating time is particularly important for models of historical sea lamprey demography, as previous genetic studies that focused on the population’s origin have been criticized for using fixed, potentially-incorrect dates (Eshenroder, 2014).
lamprey. First, moment-based methods—including a mismatch distribution and Fu’s Fsstatistic—were used to generate coarse estimates of historical population expansions
and/or contractions based on mtDNA sequence data (NCI and NCII). Second, two coalescent MCMC models were used to explicitly estimate changes in effective population size over time. Mitochondrial sequence data (NCII) were used to generate a Bayesian Skyline Plot (BSP) in the program BEAST to model effective population size history while taking into account coalescent and phylogenetic uncertainty. Previously-published allele frequency data for eight nuclear microsatellite loci (Bryan et al., 2005) were also used in the program Msvar to estimate four demographic parameters: historical effective population size, current effective population size, mutation rate, and time. In total, we used 10 loci (n=2 non-coding mtdna;n=8 nuclear microsatellites), and employed
both moment-based methods as well as two classes of coalescent models to explore historical demography. Taken together, these data can provide insight into signatures of demographic events within two separate genomes.
METHODS
Sample collection and mitochondrial DNA sequencing
To estimate historical population fluctuations within Lake Champlain, fin tissue samples from spawning-phase sea lamprey were obtained from the US Fish and Wildlife Service (USFWS) in May–June 2009. All tissue collection was conducted as part of routine USFWS sampling; the authors of this study received tissue, but did not handle any vertebrate specimens. First, to estimate fluctuations based on mtDNA sequence data, samples were collected at three Lake Champlain tributaries: Great Chazy River (n=33), Malletts Creek
(n=33), and Beaver Brook (n=28), representing the northern, central, and southern
regions of Lake Champlain, respectively. A broad geographic sampling regime was used in order to test for population structure. All tissue samples were stored in 95% non-denatured ethanol and genomic DNA was extracted using DNeasy Blood and Tissue Kits (Qiagen, Venlo, Netherlands).
The two non-coding regions of the mtDNA genome, NCI and NCII, were amplified in all Lake Champlain samples using PCR with the lamprey-specific primers CR1 (Waldman et al., 2004) and LampR (5′
-AATAGACGGTTGGTGGGACA-3′
). PCR reactions were performed in 25µl volumes with the following reagents: 0.2µl Qiagentaqpolymerase
(5 units/µl), 2.5µl 10X PCR buffer (with 1.5 mM MgCl2), 10µM each primer, 10µM
dNTP, and 50–100 ng template DNA. Thermal cycler settings were set at an initial denaturation at 95◦
C for 5 min followed by 40 cycles of 95◦
C for 45 s, 56.5◦
C for 45 s, and 72◦
C for 1 min; and a final extension at 72◦
C for 10 min. PCR products were cleaned using the Wizard SV Gel and PCR Clean-Up Kit (Promega, Madison, Wisconsin, USA) and eluted in 25µl H2O.
To sequence the Lake Champlain samples at both non-coding regions, forward extension reactions were run for each individual using the forward primers CR1 (for NCI) and CASSFN (for NCII) (5′
- GACCCCTAAGTTCATTGC-3′
using Primer3 (Untergrasser et al., 2012). Extension reactions were prepared using 1/4 reactions from the BigDye Terminator v3.1 Cycle Sequencing Kit (Applied Biosystems, Foster City, California, USA). For each 20µl reaction, the following reagents were
combined: 2µl Ready Reaction Mix, 3µl 5×sequencing buffer, 3.2µl primer (1µM), 1
µl DNA template (20–30 ng), and 10.8µl water. Thermal cycler settings were set at an initial
denaturation at 96◦
C for 1 min followed by 30 cycles of 96◦
C for 20 s, 50◦
C for 20 s, and 60◦
C for 4 min. Reactions were cleaned with 2µl of 2.2% sodium dodecyl sulfate and
returned to the thermal cycler at 98◦
C for 5 min followed by 25◦
C for 10 min. Reactions were then purified in Sephadex size-exclusion columns (GE Healthcare Life Sciences, Little Chalfont, UK) and 12µl of purified products were loaded into an Applied Biosystems 3130
Genetic Analyzer for sequencing.
Sequences from individuals that successfully amplified at both non-coding regions (n=54) were concatenated into a single sequence denoted by NCtotal. Concatenated
sequences were then trimmed to a 652-bp region to exclude repetitive portions of reads prone to slippage (NCI: excluded 14 bp before position 15382; NCII: excluded 28 bp after position 16173). Regions prone to slippage were identified by superimposed sequences on the chromatograms. All trimmed sequences were aligned with the MUSCLE algorithm (Edgar, 2004). Finally, a haplotype network was generated for all NCtotalhaplotypes to
visualize their relationship using TCS v.1.18 (Clement, Posada & Crandall, 2000). Second, to estimate population fluctuations based on nuclear microsatellite data, we used previously-published allele frequency data (Bryan et al., 2005).Bryan et al. (2005)
genotyped individuals from Great Chazy River (n=40) and Lewis Creek (n=40) at
8 microsatellite loci. There was no evidence for linkage disequilibrium or significant deviations from Hardy–Weinberg equilibrium (seeBryan et al., 2005for more details).
Moment-based analyses of historical population changes
Historical population fluctuations were inferred using three moment-based methods. First, the mismatch distribution of pairwise differences between NCtotalhaplotypes
was plotted. The observed distribution of pairwise differences was compared to the expected number of pairwise differences under a model of population expansion with 1,000 bootstrap replicates in Arlequin v.3.1 (Excoffier, Laval & Schneider, 2005). Second, Harpending’s raggedness index (r) was used to test whether the observed distribution was significantly different from the expected theoretical distribution under a model of expansion (Harpending, 1994). Third, an alternative metric, Fu’sFsstatistic, was used
to test the selective neutrality of mutations (Fu, 1997). Fu’sFscan detect an excess (or
deficiency) of haplotypes, given the observed haplotype diversity, thereby indicating a population expansion (or contraction).
Coalescent analyses of historical population changes
applies a Bayesian coalescent-based procedure, using MCMC to sample the posterior distribution of genealogical trees, demographic parameters over time, and coalescent events given sequence information and a set of priors. For our demographic model, we applied the Bayesian Skyline Plot (BSP). BSP is a change-point model that, assuming a single panmictic population, estimates fluxes in population size through time and uses a smoothing procedure to visualize these changes (Drummond et al., 2005). To determine which nucleotide substitution model fit the data, Akaike information criteria (AIC) values were calculated in jMODELTEST v.0.1.1 (Guindon & Gascuel, 2003). The substitution model selected by AIC was then used as a prior in BEAST. For our baseline study, we assumed a strict molecular clock of 3.6× 10⁻⁸substitutions per base per year (i.e., 3.6%
substitutions per million years), based on previous estimates of divergence in mtDNA noncoding regions in fishes (Donaldson & Wilson, 1999). The BSP group number (m) was set to 15. The parametermallows adjacent coalescent intervals to be grouped so that they can have the sameNe—it serves to smooth the resulting BSP. The maximum
effective population size was set at 10,000, a high estimate based on preliminary coalescent model runs. MCMC chains were run for 506iterations in triplicate, sampling the posterior distribution every 1,000 iterations. The sampling distribution of the model was evaluated in TRACER v.1.5, with the first 10% discarded as burn-in (Rambaut et al., 2014). Quality of the MCMC convergence was assessed by the effective sample sizes (ESS): if the ESS value was less than 100, it was assumed that the MCMC chain had not been run long enough to get an accurate representation of the posterior distribution and the trace was discarded (Drummond et al., 2007).
A sensitivity analysis for the BEAST modeling was carried out on two parameters— clock rate and maximum effective population size—to assess whether priors biased parameter estimates. These parameters were selected because the priors were based on our preliminary estimates. For each parameter change, three additional MCMC chains were run keeping all other baseline input values constant. We used two alternative maximum population sizes (20,000 and 100,000) and one alternate clock rate (2.0×10⁻⁸
substitutions per base per year, i.e., 2.0% substitutions per million years). To determine how sensitive model results were to the priors, runs with altered priors were compared.
Historical demographic changes were also inferred from coalescent modeling of nuclear microsatellite data. Allele frequencies at eight microsatellite loci, previously published byBryan et al. (2005), were used as input for the Bayesian MCMC model Msvar v.1.3 (Beaumont, 1999). Msvar uses probable genealogies of allele frequency data to generate posterior probability distributions of four demographic parameters: current effective population size (N0), historical effective population size (N1), mutation rate (µ), and time
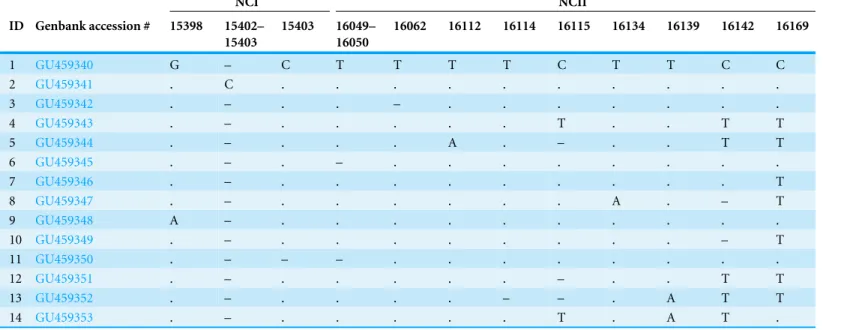
Table 1 Polymorphic sites among 14 mtDNA haplotypes from the concatenated non-coding region sequences (NCtotal), relative to the most common haplotype (first entry).Base pair positions relative to the reference mitochondrial genome are provided (Lee & Kocher, 1995).
NCI NCII
ID Genbank accession # 15398 15402– 15403
15403 16049– 16050
16062 16112 16114 16115 16134 16139 16142 16169
1 GU459340 G – C T T T T C T T C C
2 GU459341 . C . . . .
3 GU459342 . – . . – . . . .
4 GU459343 . – . . . T . . T T
5 GU459344 . – . . . A . – . . T T
6 GU459345 . – . – . . . .
7 GU459346 . – . . . T
8 GU459347 . – . . . A . – T
9 GU459348 A – . . . .
10 GU459349 . – . . . – T
11 GU459350 . – – – . . . .
12 GU459351 . – . . . – . . T T
13 GU459352 . – . . . . – – . A T T
14 GU459353 . – . . . T . A T .
Notes.
Dots indicate no change, dashes indicate a deletion, and G/C/A/T represent point mutations.
of 8×10⁸iterations, with sample points taken once every 10,000 iterations. The burn-in
portion of the chain was excluded by truncating runs to consider only the second half. To estimate each demographic parameter, the five truncated chains were combined into one posterior distribution and peak density values were recorded for each parameter, along with 95% highest probability density (HPD) credibility intervals. A Bayes factor was also calculated to test whether there was more support for a population expansion or contrac-tion using the method described byStorz & Beaumont (2002). Under the Bayesian statisti-cal framework, a Bayes factor is an appropriate metric for comparing alternative models.
Sensitivity analyses were not conducted for Msvar because the model is computationally demanding; however, simulation modeling has revealed that Msvar has the power to detect true population contractions even with broad priors (Girod et al., 2011). These simulation models have also shown that the precision of estimates increases when demographic parameters are scaled using coalescent theory. Thus the marginal posterior distributions of the following scaled parameters were also plotted:θ0=4N0µandθ1=4N1µ(effective
population sizes scaled by mutation rate);tf =t/(2N0)(time scaled by current effective
population size).
RESULTS
Haplotype diversity & population structure
We observed 14 unique haplotypes among the 54 NCTotal mitochondrial sequences
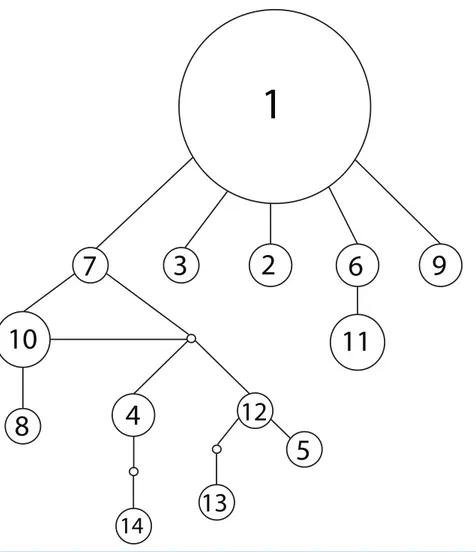
(Table 1). The haplotype network of all 14 NCtotalhaplotypes visualizes their relationships
1
7
3
2
6
9
11
10
4
5
8
12
14
13
Figure 1 Haplotype network for 14 concatenated mtDNA haplotypes found in Lake Champlain, constructed using TCS v1.2.1 with 95% parsimony.The size of the circle is proportional to the relative abundance of the haplotype. Solid lines represent one point mutation and small, unfilled circles represent inferred haplotypes. The mutations resulting in branching offof haplotype 7 are concentrated in the repetitive region of the NCII 3′region, which has an elevated mutation rate due to strand slippage.
with five other rare haplotypes (2, 3, 6, 7, and 9) having only one base pair difference from haplotype 1. Most of the mutations within these five haplotypes are point mutations within NCI or the 5′
end of NCII (Table 1). In contrast, most of the remaining rare haplotypes branch offof haplotype 7 and are characterized by mutations within the A/T-rich, repetitive 3′
region of NCII. In general, these mutations in the repetitive region were retained in each subsequent repeat of the sequence, leading to a larger number of overall mutations in NCII.
An exact test of population differentiation revealed that haplotypes were randomly distributed across the three sampling locations (n=54;p=0.265; # dememorization
steps=10,000; # steps Markov chain=100,000). Thus, the Lake Champlain population
0 0.05 0.1 0.15 0.2 0.25 0.3 0.35 0.4
0 1 2 3 4 5 6 7 8 9 10
Relativ
e
fr
equenc
y
Number of pairwise differences (bp)
Observed
Simulated
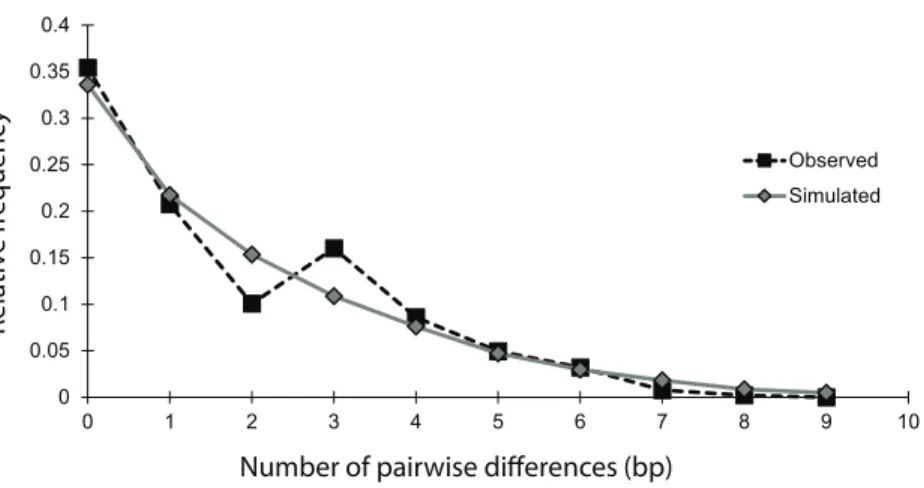
Figure 2 Mismatch distribution of the 14 concatenated mtDNA haplotypes, conducted in Arlequin v.3.1.The black squares represent the observed number of pairwise bp differences between haplotypes, while the gray diamonds represent the expected number of pairwise bp differences between haplotypes, based on a model of population expansion (bootstrap replicates=1,000). The relatively smooth and unimodal shape of the observed distribution closely matches the expected distribution for a demographic expansion.
Moment-based analyses of historical population changes
The mismatch distribution of NCtotalwas smooth and unimodal, suggesting that the sea
lamprey population has undergone an expansion (Fig. 2). The distribution of observed pairwise differences closely matches the expected distribution of pairwise differences under a model of population expansion, with a raggedness index that was positive, but not significant (r=0.04;n=54;p=0.86). This indicates that there was no significant deviation from the theoretical model of expansion. Additionally, Fu’sFs statistic was
significantly negative (Fs= −6.61;n=54;p=0.02), indicating an excess of rare
haplotypes, which would be predicted under a scenario of a recent population expansion. Overall, these moment-based methods of studying historical demography with mtDNA data strongly support a population expansion, without explicit estimates of the timing and magnitude of the event.
Coalescent analyses of historical population changes
For the BEAST analysis of mtDNA NCII data, the best-fit model of sequence evolution determined by jMODELTEST was Hasegawa, Kishino and Yano (HKY)+I, where I means
there is a significant proportion of invariable sites. The BSP derived from the NCII data shows a decrease in effective population size starting around 400 years ago that continued until 50 to 100 years ago, at which point effective population size slowly began to increase (Fig. 3). The sensitivity analysis showed that the maximum population size prior was directly proportional to the currentNeestimate; when doubled, theNeestimates also
doubled. However, changes in the maximum population size and clock rate priors did not affect the overall pattern of the BSP (Table S2).
Years before 2009
Estimat
ed N
e
A
B
Estimat
ed N
e
Years before 2009
10000
8000
6000
4000
2000
0
0 1000 2000 3000 4000 5000 6000 7000 8000 9000 10000
4000
3600
3600
3200 3800
3000
0 50 100 150 200 250 300 350 400
European settlement wave (1753) Salmon
extirpation (1830) Lake trout extirpation (1890)
Salmonid stocking (1972)
Champlain Barge Canal (1916)
Figure 3 Bayesian skyline plot (BSP) derived from NCII sequence alignments from Lake Champlain lamprey collected in May–June 2009.(A) The mean effective population size is estimated from the Bayesian posterior distribution and is shown as the thick solid line. The horizontal dashed lines show the 95% HPD intervals around theNeestimate. The dashed red box highlights the portion of the BSP shown in B; (B) Zoom-in of the BSP for 400 years prior to 2009. The dashed vertical gray lines represent the timing of relevant historical events in the region. Note that thexandyaxes differ between the two panels.
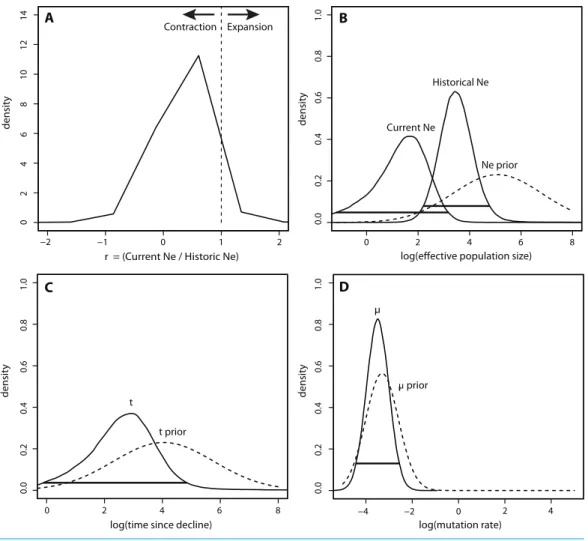
potential scale reduction factor of 1.2 (Brooks & Gelman, 1998) for all four demographic parameters, indicating that there was good convergence of parameter estimates. The Bayes factor (BF) for a population contraction indicated very strong support for a population contraction over a population expansion(2∗
ln(BF)=10.3)(Kass & Raftery, 1995), with
the vast majority of MCMC iterations estimating a population contraction (Fig. 4A). The posterior density distributions reveal the estimates for each demographic parameter with 95% HPD intervals (Figs. 4B–4D). There was a decrease in effective population size from approximately 2,660 (HPD95%=153, 65750) down to approximately 50 currently
(HPD95%=0.06, 1440) (Fig. 4B). The density peak was higher, with narrower credibility
intervals, for historical effective population size compared to current effective population size. This population contraction was estimated to have begun approximately 820 years ago, although the peak density was only 40% for this time parameter, with wide credibility intervals (HPD95%=0.81, 71558) (Fig. 4C). Finally, there was a high density peak for
C D
log(mutation rate)
density
log(effective population size)
log(time since decline)
densit
y
B A
r = (Current Ne / Historic Ne)
density density −2 −1 10 12 14
0 1 2
8 6 4 2 0 Expansion Contraction 0.4 0.6 0.8 1.0 Current Ne Historical Ne Ne prior 0.2 0.0
0 2 4 6 8
−4 −2
u
prior
0 2 4
0.4 0.6 0.8 1.0 0.2 0.0 u t t prior
0 2 4 6 8
0.4 0.6 0.8 1.0 0.2 0.0
Figure 4 Msvar results based on microsatellites.(A) Density plot across MCMC iterations forr, which represents the ratio of currentNe to historicalNe, withr>1 indicating a population expansion and r<1 indicating a population contraction. (B–D) Posterior density distributions for each demographic parameter, plotted on a log10 scale. Solid lines represent posterior density distributions and dashed lines represent prior distributions (with solid horizontal lines representing the 95% HPD credibility intervals for the posterior distributions); (B) Effective population sizes; (C) time in years since population contraction; (D) mutation rate as # mutations/site/generation.
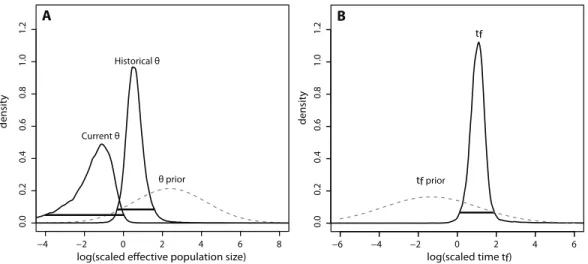
The posterior distributions of the scaled demographic parameters also indicate a pop-ulation contraction (Fig. 5). As predicted by simulation analyses, scaling the parameters increased the precision of parameter estimates. The magnitude of the scaled population size estimates were very similar to the unscaled estimates. Modalθestimates corresponded with a decline from approximately 2,335 individuals historically (HPD95%=359, 29614)
to 60 individuals currently (HPD95%=0.08, 772). Despite increased precision, there
B A
density
density
log(scaled time tf) log(scaled efective population size)
−4 −2
0.0
0.2
0.4
0.6
0.8
1.0
1.2
0 2 4 6 8 −6 −4 −2 0 2 4 6
0.0
0.2
0.4
0.6
0.8
1.0
1.2
θ prior tf prior
tf
Historical θ
Current θ
Figure 5 Marginal posterior distributions of scaled parameters from Msvar. Solid lines represent posterior density distributions and dashed lines represent prior distributions (with solid horizontal lines representing the 95% HPD credibility intervals for the scaled posterior distributions). (A) Scaled effective population sizes on a log10scale; (B) scaled time on a log10scale.
DISCUSSION
Genetic-based methods can be useful tools for studying demographic changes in the absence of historical population records, though their precision is linked to the timing and magnitude of the events themselves (Beaumont & Rannala, 2004;Lawton-Rauh, 2008). In this study, we applied multiple analytical approaches and used two sets of genetic markers to investigate the population history ofP. marinusin Lake Champlain. Synthesizing the results to draw conclusions about the most likely historic scenario of demographic change requires a critical analysis of the results generated by each method, an exploration of sea lamprey ecology, and consideration of the history of land-use and management practices in the region.
Moment-based analyses of historical population changes
1.74 mismatches, which supports a ‘recent’ expansion. Yet, without explicit guidelines for differentiating between ‘low’ and ‘high,’ or inferring what ‘recent’ and ‘ancient’ indicate on an evolutionary timescale, caution should be used in interpreting these results. Instead, these results are more appropriately used as supplemental evidence to be considered alongside inferences made by coalescent-based analyses.
Coalescent analyses of historical population changes
BEAST and Msvar analyses both detected an initial decline in effective population size. These congruent results between two separate genomes strengthen the evidence for a decline; however, the magnitude and timing of the event(s) remain uncertain. The BSP generated using BEAST provides credibility intervals at every time point that reflect both coalescent and phylogenetic uncertainty. This proved to be important, as the BSP shows that the credibility intervals for effective population size ranged from 51 to 9,500. These wide credibility intervals aroundNecould be due to the limited number of segregating sites
within the NCII sequence data. The sensitivity analysis also showed that the maximum population size prior affected the BSP results, with the estimatedNebeing proportional to
the prior. However, the overall pattern of demographic change was consistent regardless of the priors (seeTable S2), indicating that the estimated meanNealways showed a
contraction followed by an expansion.
Scenario 1: evidence for fluctuations within a native population
Capitalizing on multiple analytical approaches and two unique genetic data sets used in this study, it is possible to infer multiple demographic fluctuations. While the mismatch distribution detected a population expansion and coalescent modeling using Msvar detected a decline, the results may not be in conflict. Instead, they may be detecting the two different demographic changes that are both evident in the BSP generated by BEAST. By considering known events in the ecological history of Lake Champlain and the approximate time scale estimated by each method, we present the most parsimonious demographic history of a native sea lamprey population in Lake Champlain.
The decline in effective population size detected by both coalescent models may correlate with land-use changes and fishing pressures that began after the arrival of European settlers in the mid-18th century. The BSP from BEAST indicated that the decline began approximately 400 years ago. Given that there is uncertainty around this time estimate, one hypothesis is that a gradual decline in population size began around 1753 when a large number of European settlers arrived in the area. At this time, human impact on the landscape increased with the onset of large-scale agricultural and clear-cutting practices and, later, the construction of mills and dams that would have limited upstream lamprey spawning migrations (Klyza & Trombulak, 1999). Moreover, the acceleration of the decline shown in the BSP correlates with the extirpation of salmonids in Lake Champlain—the primary food source of parasitic-phase sea lamprey. The last documentation of native Atlantic salmon in the basin was 1830, with lake trout extirpation following shortly thereafter in the 1890s (Fisheries Technical Committee, 2009). Thus, it is plausible that the population contraction detected by both coalescent models can be explained by known ecological changes in the region, though some caution is warranted given that the scaled Msvar distributions suggest that the decline was more ancient (ca. 1,230 years ago).
The mismatch distribution analysis may be detecting a more recent population expansion associated with salmonid stocking in Lake Champlain. This recent expansion is supported by the upward trend in effective population detected in the BSP in the last 50 years. A stocking program began for both Atlantic salmon and lake trout in 1972 and now focuses on stocking the main part of the lake with yearlings (Marsden et al., 2003;
Fisheries Technical Committee, 2009). The reintroduction of their primary food source could have allowed the sea lamprey population to expand.
average mutation rate due to strand slippage. Indeed, Msvar estimated a fast mutation rate for the microsatellites used in the study, with the narrow posterior distribution peaking at 3.24×10⁻⁴mutations/site/generation. Nevertheless, Msvar, a model that uses
microsatellite markers exclusively, has been shown to have a bias towards detecting ancient declines in effective population size (Beaumont, 1999). Most recently, this tendency has been rigorously confirmed through simulation studies (Girod et al., 2011). Therefore, even if there were signatures of two demographic fluctuations in the population’s history, Msvar, which can only identify a single event, is predicted to detect the more ancient decline. As to whether or not the mtDNA sequence data show a true signature of expansion within the last 40 years, some insight can be gained from a comparison between BEAST model inputs and outputs. Even though an extremely strict (i.e., slow) molecular clock was used as an input in this analysis, the posterior distribution of effective population size still shows an upward trend beginning approximately 50 years ago. Posterior estimates that deviate from prior predictions generally indicate a strong genetic signal. Taken together, these lines of evidence suggest that the population fluctuations detected are likely to be real.
Scenario 2: evidence for a founder event in the early 20th century
Differentiating between founder events resulting from an invasion versus bottlenecks within native populations can be challenging, as both events are predicted to lead to a decline in effective population size and a loss of genetic diversity (Nei, Maruyama & Chakraborty, 1975). Thus, an alternative interpretation of the data is that the population contraction detected in Msvar represents a bottleneck immediately following an invasion from the anadromous Atlantic Coast population sometime after the completion of the Champlain Barge Canal in 1916, while the expansion detected in the moment-based and BEAST analyses represents the population boom in the 1970s. While the timing of such an invasion falls within the bounds of the BEAST and unscaled Msvar credibility intervals, both coalescent models assume a single panmictic population. Therefore, if the present-day Lake Champlain population is significantly differentiated from the anadromous population, the coalescent models could not accurately estimate historical changes beginning in the differentiated population of origin. Indeed,Bryan et al. (2005)
found evidence for significant genetic structure between Lake Champlain and anadromous sea lamprey populations, and long-term vicariance for the Lake Champlain population.
CONCLUSIONS AND FUTURE DIRECTIONS
This study builds upon previous research by modeling historical sea lamprey population fluctuations in Lake Champlain. Considering both coalescent models and moment-based genetic approaches, we conclude that multiple demographic events are likely to have occurred over the past 300 years. Importantly, however, there is a large amount of uncertainty around these estimates. While we argue that the data largely align with prior genetic studies and are most consistent with the native hypothesis, the wide credibility intervals around our estimates cannot exclude an alternative interpretation that a founder event occurred in the early 20th century.
As such, we propose two potential lines of future research aimed at resolving the residency debate. First, expanded genomic sampling could provide more accurate estimates of historical population sizes within Lake Champlain, as well as the timing of divergence between the Lake Champlain and Atlantic populations. Second, given the uncertain results from neutral genetic data, it would be useful to investigate genes that may be under selection, e.g., those regulating Na/K-ATPase pumps in the gills. Population genetic analyses, gene expression analyses, and physiological saltwater challenges could be undertaken in tandem. Together, these lines of research may provide further clarity to the history of sea lamprey in Lake Champlain.
ACKNOWLEDGEMENTS
The authors thank US Fish and Wildlife Service professionals in Essex Junction, VT for providing sea lamprey tissue. We also thank Vicenta Hudziak and Livingston Burgess for assistance in DNA sequencing and Jeremy Ward, Wayne Bouffard, Steve Smith, and Brad Young for providing feedback. We are grateful to John Waldman, Amy Russell, and one anonymous reviewer for helpful comments on the manuscript. The findings and conclusions in the article are those of the authors and do not necessarily represent the views of the USFWS.
ADDITIONAL INFORMATION AND DECLARATIONS
Funding
This project was funded by the Middlebury College Senior Work Fund and two student research grants from the Lake Champlain Research Consortium. The funders had no role in study design, data collection and analysis, decision to publish, or preparation of the manuscript.
Grant Disclosures
The following grant information was disclosed by the authors: Middlebury College Senior Work Fund.
Lake Champlain Research Consortium.
Competing Interests
Author Contributions
• Cassidy C. D’Aloia and Christina B. Azodi conceived and designed the experiments,
performed the experiments, analyzed the data, wrote the paper, prepared figures and/or tables, reviewed drafts of the paper.
• Sallie P. Sheldon and Stephen C. Trombulak conceived and designed the experiments,
contributed reagents/materials/analysis tools, reviewed drafts of the paper.
• William R. Ardren conceived and designed the experiments, analyzed the data,
contributed reagents/materials/analysis tools, reviewed drafts of the paper.
Animal Ethics
The following information was supplied relating to ethical approvals (i.e., approving body and any reference numbers):
The authors received tissue samples from the US Fish and Wildlife Service as part of routine annual lamprey collections. As such, the authors never handled vertebrate animals and this project did not require IACUC approval from Middlebury College.
DNA Deposition
The following information was supplied regarding the deposition of DNA sequences: GenBank accession numbersGU459340–GU459353.
Data Availability
The following information was supplied regarding data availability:
Microsatellite allele frequency data are previously published, as noted in the text. MCMC priors are provided as a supplemental table.
Supplemental Information
Supplemental information for this article can be found online athttp://dx.doi.org/ 10.7717/peerj.1369#supplemental-information.
REFERENCES
Avise JC. 1994.Molecular markers, natural history and evolution. Norwell: Chapman & Hall.
Beaumont MA. 1999.Detecting population expansion and decline using microsatellites.Genetics
153:2013–2029.
Beaumont MA, Rannala B. 2004.The Bayesian revolution in genetics.Nature Reviews Genetics
5:251–261DOI 10.1038/nrg1318.
Brooks SP, Gelman A. 1998.General methods for monitoring convergence of iterative simulations.
Journal of Computational and Graphical Statistics7:434–455
DOI 10.1080/10618600.1998.10474787.
Bryan MB, Zalinksi D, Filcek B, Libants S, Li W, Scribner KT. 2005.Patterns of invasion and colonization of the sea lamprey (Petromyzon marinus) in North America as revealed by mi-crosatellite genotypes.Molecular Ecology14:757–3773DOI 10.1111/j.1365-294X.2005.02716.x.
Clement M, Posada D, Crandall K. 2000.TCS: a computer program to estimate gene genealogies.
Cornuet JM, Luikart G. 1996.Description and power analysis of two tests for detecting recent population bottlenecks from allele frequency data.Genetics144:2001–2014.
Donaldson KA, Wilson Jr RR. 1999. Amphi-panamic geminates of snook (Percoidei:
Centropomidae) provide a calibration of the divergence rate in the mitochondrial DNA control region of fishes.Molecular Phylogenetics and Evolution13:208–213.
Drummond AJ, Ho SYW, Rawlence N, Rambaut A. 2007.A rough guide to BEAST 1.4. New Zealand: University of Auckland.
Drummond AJ, Rambaut A. 2007.BEAST: Bayesian evolutionary analysis by sampling trees.BMC Evolutionary Biology7:214DOI 10.1186/1471-2148-7-214.
Drummond AJ, Rambaut A, Shapiro B, Pybus OG. 2005.Bayesian coalescent inference of past population dynamics from molecular sequences.Molecular Biology and Evolution
22:1185–1192.
Edgar RC. 2004.MUSCLE: multiple sequence alignment with high accuracy and high throughput.
Nucleic Acids Research32:1792–1797DOI 10.1093/nar/gkh340.
Eshenroder RL. 2009.Comment: mitochondrial DNA analysis indicates sea lampreys are indigenous to Lake Ontario.Transactions of the American Fisheries Society138:1178–1189
DOI 10.1577/T08-035.1.
Eshenroder RL. 2014.The role of the Champlain Canal and Erie Canal as putative corridors for colonization of Lake Champlain and Lake Ontario by sea lampreys.Transactions of the American Fisheries Society143:634–649DOI 10.1080/00028487.2013.879818.
Excoffier L, Laval G, Schneider S. 2005.Arlequin ver. 3.1: an integrated software package for population genetics data analysis.Evolutionary Bioinformatics Online1:47–50.
Eytan RI, Hellberg ME. 2010.Nuclear and mitochondrial sequence data reveal and conceal different demographic histories and population genetic processes in Caribbean reef fishes.
Evolution64:3380–3397DOI 10.1111/j.1558-5646.2010.01071.x.
Fisheries Technical Committee of the Lake Champlain Fish and Wildlife Management
Cooperative. 2009.Strategic plan for Lake Champlain fisheries. Essex Junction: Lake Champlain Fish and Wildlife Management Cooperative, USFWS.
Frankham R. 1995.Effective population size/adult population size ratios in wildlife: a review.
Genetics Research2:91–107DOI 10.1017/S0016672300034455.
Fu YX. 1997.Statistical tests of neutrality of mutations against population growth, hitchhiking and background selection.Genetics147:915–925.
Garza JC, Williamson EG. 2001.Detection of reduction in population size using data from microsatellite loci.Molecular Ecology10:305–318DOI 10.1046/j.1365-294x.2001.01190.x.
Girod C, Vitalis R, Leblois R, Fr´eville H. 2011.Inferring population decline and expansion from microsatellite data: a simulation-based evaluation of the Msvar method.Genetics188:165–179
DOI 10.1534/genetics.110.121764.
Goossens B, Chikhi L, Ancrenaz M, Lackman-Ancrenaz I, Andau P, Bruford MW. 2006.
Genetic signature of anthropogenic population collapse in orangutans.PLoS Biology4:e25
DOI 10.1371/journal.pbio.0040025.
Guindon S, Gascuel O. 2003.A simple, fast and accurate method to estimate large phylogenies by maximum-likelihood.Systematic Biology52:696–704DOI 10.1080/10635150390235520.
Guyette MQ, Loftin CS, Zydlewski J, Cunjak R. 2014.Carcass analogues provide marine subsidies for macroinvertebrates and juvenile Atlantic salmon in temperate oligotrophic streams.
Hardisty MW, Potter IC (eds.) 1971.The biology of lampreys, vol. 1. New York: Academic Press.
Harpending RC. 1994.Signature of ancient population growth in a low-resolution mitochondrial DNA mismatch distribution.Human Biology66:591–600.
Harpending HC, Batzer MA, Gurven M, Jorde LB, Rogers AR, Sherry ST. 1998.Genetic traces of ancient demography.Proceedings of the National Academy of Sciences USA of the United States of America95:1961–1967DOI 10.1073/pnas.95.4.1961.
Kass RE, Raftery AE. 1995.Bayes factors.Journal of the American Statistical Association90:773–795
DOI 10.1080/01621459.1995.10476572.
Klyza CM, Trombulak SC. 1999.The story of Vermont: a natural and cultural history. Hanover: University Press of New England.
Kuhner MK. 2008.Coalescent genealogy samplers: windows into population history.Trends in Ecology & Evolution24:86–93DOI 10.1016/j.tree.2008.09.007.
Lawton-Rauh A. 2008.Demographic processes shaping genetic variation.Current Opinion in Plant Biology11:103–109DOI 10.1016/j.pbi.2008.02.009.
Lee WJ, Kocher TD. 1995.Complete sequence of a sea lamprey (Petromyzon marinus) mitochondrial genome: early establishment of the vertebrate genome organization.Genetics
139:873–887.
Marsden JE, Chipman BD, Nashett LJ, Anderson JK, Bouffard W, Durfey L, Gersmehl JE, Schoch WF, Staats NR, Zerrenner A. 2003.Sea lamprey control in Lake Champlain.Journal of Great Lakes Research29:655–676.
McLaughlin RL, Marsden JE, Hayes DB. 2003.Achieving the benefits of sea lamprey control while minimizing effects on nontarget species: conceptual synthesis and proposed policy.Journal of Great Lakes Research29:755–765DOI 10.1016/S0380-1330(03)70529-2.
Nei M, Maruyama T, Chakraborty R. 1975.The bottleneck effect and genetic variability in populations.Evolution29:1–10DOI 10.2307/2407137.
Okello JB, Nyakaana S, Masembe C, Siegismund HR, Arctander P. 2005.Mitochondrial DNA variation of the common hippopotamus: evidence for a recent population expansion.Heredity
95:206–215DOI 10.1038/sj.hdy.6800711.
Rambaut A, Suchard MA, Xie D, Drummond AJ. 2014.Tracer v1.6.Available athttp://beast.bio.
ed.ac.uk/Tracer(accessed 29 July 2015).
Rogers AR, Harpending H. 1992.Population growth makes waves in the distribution of pairwise genetic differences.Molecular Biology and Evolution9:552–569.
Schneider S, Excoffier L. 1999.Estimation of past demographic parameters from the distribution of pairwise differences when the mutation rates vary among sites: application to human mitochondrial DNA.Genetics152:1079–1089.
Smith BR. 1971.Sea lampreys in the Great Lakes of North America. In: Hardisty MW, Potter IC, eds.The biology of lampreys, vol. 1. New York: Academic Press, 207–247.
Smith BR, Tibbles JJ. 1980.Sea Lamprey (Petromyzon marinus) in Lakes Huron, Michigan, and Superior: history of invasion and control, 1936–1978.Canadian Journal of Fisheries and Aquatic Sciences37:1780–1801DOI 10.1139/f80-222.
Storz JF, Beaumont MA. 2002.Testing for genetic evidence of population expansion and contraction: an empirical analysis of microsatellite DNA variation using a hierarchical Bayesian model.Evolution56:154–166DOI 10.1111/j.0014-3820.2002.tb00857.x.
Untergrasser A, Cutcutache I, Koressaar T, Ye J, Faircloth BC, Remm M, Rozen SG. 2012.
Primer3—new capabilities and interfaces.Nucleic Acids Research40:e115
Waldman JR, Daniels R, Hickerson M, Wirgin I. 2009.Mitochondrial DNA analysis indicates sea lampreys are indigenous to Lake Ontario: response to comment.Transactions of the American Fisheries Society138:1190–1197DOI 10.1577/T08-035R.1.
Waldman JR, Grunwald C, Roy NK, Wirgin I. 2004.Mitochondrial DNA analysis indicates sea lampreys are indigenous to Lake Ontario.Transactions of the American Fisheries Society
133:950–960DOI 10.1577/T03-104.1.
Waldman JR, Grunwald C, Wirgin I. 2006.Evaluation of the native status of sea lampreys in Lake Champlain based on mitochondrial DNA sequencing analysis.Transactions of the American Fisheries Society135:1076–1085DOI 10.1577/T05-055.1.
Waples R. 1989.A generalized approach for estimating effective population size from temporal changes in allele frequencies.Genetics121:379–391.
White DJ, WolffJN, Pierson M, Gemmell NJ. 2008.Revealing the hidden complexities of mtDNA inheritance.Molecular Ecology17:4925–4942DOI 10.1111/j.1365-294X.2008.03982.x.
Wright S. 1938.Size of population and breeding structure in relation to evolution.Science