Submitted 30 November 2014 Accepted 28 October 2015 Published19 November 2015
Corresponding author Gary D. Powney, [email protected]
Academic editor Andrea Sundermann
Additional Information and Declarations can be found on page 10
DOI10.7717/peerj.1410
Copyright 2015 Powney et al.
Distributed under
Creative Commons CC-BY 4.0
OPEN ACCESS
Trait correlates of distribution trends in
the Odonata of Britain and Ireland
Gary D. Powney1, Steve S.A. Cham2, Dave Smallshire3and Nick J.B. Isaac1
1Biological Records Centre, NERC Centre for Ecology & Hydrology, Wallingford, UK 2British Dragonfly Society, (BDS), Silsoe, UK
3Dragonfly Conservation Group, British Dragonfly Society, Chudleigh, UK
ABSTRACT
A major challenge in ecology is understanding why certain species persist, while others decline, in response to environmental change. Trait-based comparative analyses are useful in this regard as they can help identify the key drivers of decline, and highlight traits that promote resistance to change. Despite their popularity trait-based comparative analyses tend to focus on explaining variation in range shift and extinction risk, seldom being applied to actual measures of species decline. Furthermore they have tended to be taxonomically restricted to birds, mammals, plants and butterflies. Here we utilise a novel approach to estimate occurrence trends for the Odonata in Britain and Ireland, and examine trait correlates of these trends using a recently available trait dataset. We found the dragonfly fauna in Britain and Ireland has undergone considerable change between 1980 and 2012, with 22 and 53% of species declining and increasing, respectively. Distribution region, habitat specialism and range size were the key traits associated with these trends, where habitat generalists that occupy southern Britain tend to have increased in comparison to the declining narrow-ranged specialist species. In combination with previous evidence, we conclude that the lower trend estimates for the narrow-ranged specialists could be a sign of biotic homogenization with ecological specialists being replaced by warm-adapted generalists.
Subjects Biodiversity, Conservation Biology, Ecology, Entomology
Keywords Dragonfly, Climate change, Comparative analysis, Range change, Species characteristics
INTRODUCTION
to gain a better understanding of this interspecific variation in response to environmental change, i.e., what enables certain species to persist while others decline?
Species traits play an important role in determining species’ ability to resist envi-ronmental change. For example, several studies have shown that ecological generalists out-perform specialists in times of environmental change (Walker & Preston, 2006;Ozinga et al., 2012;Newbold et al., 2013). Such comparative trait-based analyses are popular, as the models help to identify the main drivers of change and allow the prediction of future biodiversity changes based on environmental forecasts (Fisher & Owens, 2004;Cardillo et
al., 2006). Previous comparative trait analyses have tended to focus on explaining variation
in range shift (Angert et al., 2011;Mattila et al., 2011;Grewe et al., 2012) and extinction risk (Purvis et al., 2000;Koh, Sodhi & Brook, 2004;Cardillo et al., 2008;Cooper et al., 2008;
Fritz, Bininda-Emonds & Purvis, 2009). Despite its popularity, the comparative trait-based approach has seldom been applied to direct measures of species’ changing status (i.e., rates of decline or increase). Currently data on such measures of decline are rare, particularly at large (e.g., national) scales and across multiple species. With the increase in public participation in biological recording, the availability of large-scale distribution datasets has increased (Silvertown, 2009). Such data tend to be collected without systematic protocols and thus contain many forms of sampling bias and noise, making it hard to detect genuine signals of change (Tingley & Beissinger, 2009;Hassall & Thompson, 2010;Isaac et al., 2014). However, recent advances in analytical approaches have improved our ability to estimate reliable trends from these unstructured biological records (Isaac et al., 2014). In this study, we utilise these novel approaches to estimate trends in occurrence for the Odonata in Britain and Ireland, and use species traits to test hypotheses for the interspecific variation in trends.
We chose to examine Odonata for a number of reasons. Firstly, previous trait-based comparative analyses have tended to focus on birds, mammals, plants and butterflies. Despite being highly species rich and their crucial role across ecosystems, the non-butterfly invertebrate fauna are comparatively poorly studied (ICUN, 2001;Dirzo et al., 2014). Secondly, Odonata are thought to be excellent bioindicators as they are sensitive to degradation of water ecosystems (Samways & Steytler, 1996;Sahl´en & Ekestubbe, 2001;
Lee Foote & Rice Hornung, 2005). Thirdly, they provide a valuable ecosystem service as they feed on many insect pests (Brooks & Lewington, 2007). Finally, the publication of a new atlas (Cham et al., 2014) and trait datasets (Powney et al., 2014) for British Odonata together constitute some of the best quality data of any non-butterfly invertebrate group. Previous research based on Odonata occurrence data has focussed on the impact of climate change on phenology and distribution. For example,Hassall et al. (2007)discovered that emergence from overwintering had significantly advanced over the past 50 years, while
Hickling et al. (2005)showed that the upper latitudinal margin shifted north between 1960
and 1995. Outside Britain,Bush et al. (2014)used species distribution models (SDMs) to predict which Australian odonates were under threat from climate change.
In terms of phenological advancement,Hassall et al. (2007)noted that spring species and those without egg diapause exhibited increased phenological shifts.Angert et al. (2011)
examined trait correlates of range shift across multiple taxonomic groups, finding that exophytic Odonata species in Britain shifted further north, on average, than endophytic species. These insights, combined with extensive knowledge about their natural history
(Brooks & Lewington, 2007), form the basis of seven competing hypotheses (outlined
below) that aim to explain the interspecific variation in the distribution trends among British Odonata.
All traits included in the analysis have been shown to affect species’ ability to respond to environmental change. Habitat breadth is frequently related to species trends, where habitat generalists outperform specialists due to their greater ability to adapt to novel environmental conditions (Fisher & Owens, 2004;Men´endez et al., 2006;Botts, Erasmus
& Alexander, 2012).Ball-Damerow, M’Gonigle & Resh (2014)found evidence of the
widespread expansion of habitat generalists which has led to biotic homogenization in the dragonfly fauna of California and Nevada over the last century. We test the hypothesis that Odonata in Britain and Ireland follow the patterns outlined above, with generalists out-performing specialists. Dispersal ability affects species’ ability to respond to environmental pressures, with higher dispersal ability linked to an enhanced ability to respond (Thomas et al., 2001;P¨oyry et al., 2011;Grewe et al., 2012). Using SDMs,Hof
et al. (2012)found lentic (i.e., pond and lake dwelling) species had a greater ability to
track changes in their climatic niche. This was linked to greater dispersal ability, which is essential given the ephemeral nature of their breeding sites (Hof, Brandle & Brandl, 2006). We predict lentic species will have higher (more positive) trend estimates than lotic species as their increased dispersal ability enables them to persist during times of environmental change through the efficient relocation to newly suitable areas. Geographic range size and body size are both frequently used as surrogates for a whole host of traits associated with ecological specialism and competitive ability (Gittleman, 1985;Gaston, 2003;Angert et
al., 2011). We predict that widespread species and the larger, therefore more competitive
flight periods have increased dispersal ability, and therefore have a greater capacity to adapt in response to environmental change.
MATERIALS & METHODS
Occurrence trends
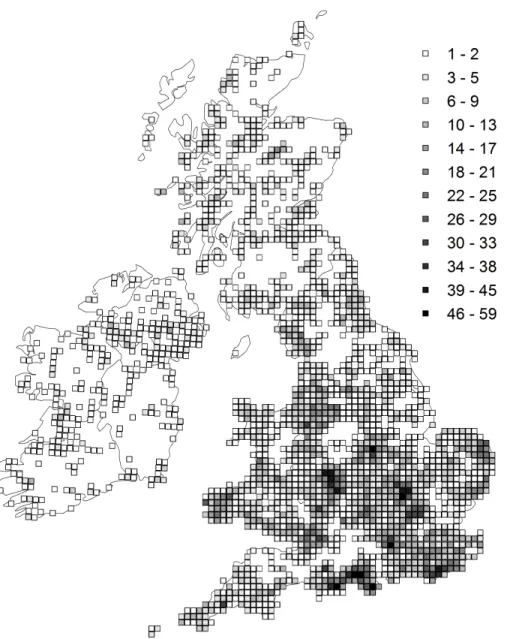
Trends were estimated from Odonata distribution records in Britain and Ireland collected by the Dragonfly Recording Network and coordinated by the British Dragonfly Society. Our analyses are based on 588,480 records of 36 native species collected between 1980 and 2012 where the recording date is known and the location was recorded to 1 km2 precision or better. As these occurrence records were collected without a specific sampling design they contain a variety of bias which inhibit their use in estimating reliable trends. For example, the number of records collected each year has increased dramatically over time (Cham et al., 2014), such that simply counting the number of occupied sites would produce biased trend estimates (Prendergast et al., 1993;Isaac et al., 2014). To account for these biases we estimated species trends using an approach based on Bayesian occupancy modelling (Van Strien, Van Swaay & Termaat, 2013;Isaac et al., 2014). We first arranged the records into 212,574 visits, which were defined as unique combinations of date and 1 km2grid cell (site). For each visit, each of the 36 species was coded as either recorded (1) or not-recorded (0). We then selected sites with at least three years of data, ensuring we retained only the well-sampled sites (Fig. 1). Our final dataset contains 467,899 records from 157,507 visits to 11,435 sites (64,005 site-year combinations). We ran occupancy models for each species based on the methodology ofVan Strien, Van Swaay & Termaat
(2013)andIsaac et al. (2014). The approach uses two hierarchically coupled sub-models,
one, the state model, governs the true presence/absence of a species at a site in a given year, the second, the observation model, governs the probably of detecting that species given its presence or absence, and is therefore conditional on the state model. The detection probability per visit is a function of the number of species recorded on that visit (the ‘list length’: seeAppendix S1for detailed model description). For each site-year combination the model estimates presence or absence for the species in question given variation in detection probability: from this the proportion of occupied sites (‘occupancy’) was estimated for each year. Finally, within the Bayesian framework, a linear trend was fitted to these annual proportions to identify a temporal trend in species occupancy. The slope of this regression of occupancy against year was used as the species-specific trend measure in the cross-species comparative analysis.
Species’ trait data
Figure 1 The distribution and density of sites (monads) from which the trend estimates were de-rived.The shading represents the number of unique sites within the hectad that were included in the analysis.
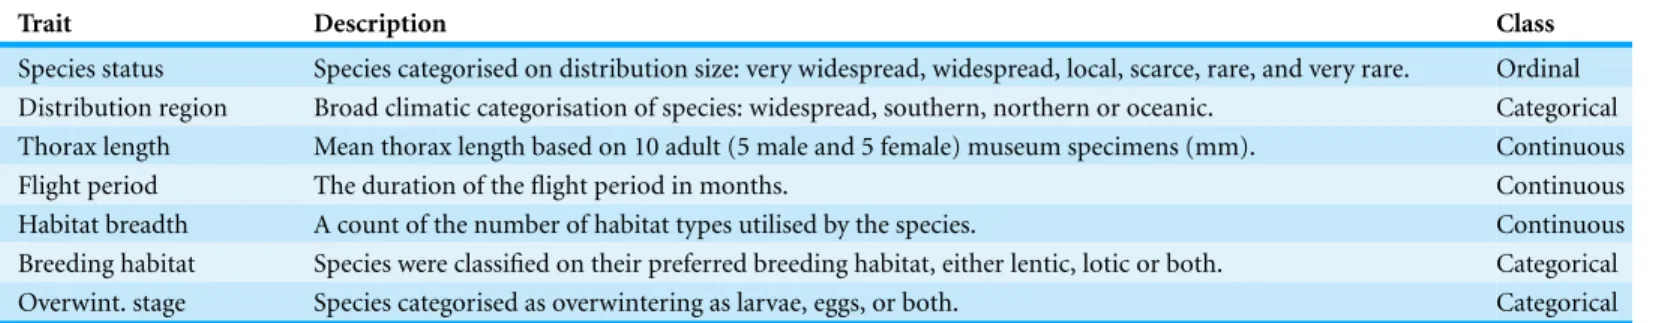
Table 1 An overview of the Odonata traits included in the comparative analysis.
Trait Description Class
Species status Species categorised on distribution size: very widespread, widespread, local, scarce, rare, and very rare. Ordinal Distribution region Broad climatic categorisation of species: widespread, southern, northern or oceanic. Categorical Thorax length Mean thorax length based on 10 adult (5 male and 5 female) museum specimens (mm). Continuous
Flight period The duration of the flight period in months. Continuous
Habitat breadth A count of the number of habitat types utilised by the species. Continuous
Breeding habitat Species were classified on their preferred breeding habitat, either lentic, lotic or both. Categorical Overwint. stage Species categorised as overwintering as larvae, eggs, or both. Categorical
continuous term in the analysis (as opposed to a factor). All continuous traits were centred on zero prior to the analysis.
Comparative analysis
We used thepglsfunction from the R packagecaper(Orme, 2012) to run phylogenetically informed linear models to examine trait-trend relationships while accounting for phylogenetic non-independence (Freckleton, Harvey & Pagel, 2002). In all phylogenetically informed models, the level of phylogenetic correction (Pagel’sλ) was estimated via
maxi-mum likelihood (Pagel, 1999;Freckleton, Harvey & Pagel, 2002). Due to data limitations, we used a phylogeny based on taxonomy for the analyses. The phylogeny was built using the
as.phylofunction from the R packageape(Paradis, Claude & Strimmer, 2004) with nodes based on Suborder, Family, Genus and Species, and all branch lengths were set to one.
We tested seven hypotheses about the drivers of species’ trends whilst incorporating uncertainty in the trend estimates of each species. To do this, we fitted 10,000 trait-trend models: in each model we selected, at random, one value from the posterior distribution of trend estimates for each species. In all 10,000 models, we estimated the coefficients for each of the seven traits (described above) as fixed effects. From these models, we then calculated the mean and 95% confidence intervals for the trait-trend parameter estimates across all iterations.
RESULTS
We found substantial variation in the trend estimates between species. Of 36 species included in the analysis, 8 had negative trends and 19 had positive trends where the 95 percentiles (2.5 and 97.5 percentiles) did not bridge zero (Appendix S2). Species that showed the greatest declines included:Aeshna junceaandSympetrum danae, whileAnax imperatorandAeshna mixtashowed the greatest increases.
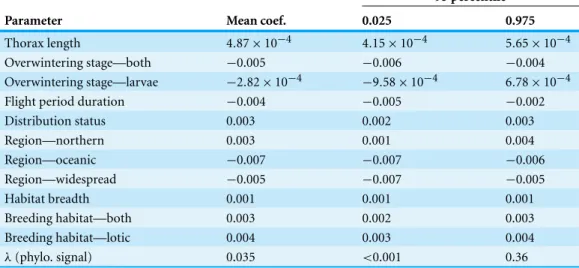
Table 2 The mean and 95 percentiles of the trait coefficients estimated from 10,000 model itera-tions.The coefficients for the categorical variables (overwintering stage, region and breeding habitat) are shown as contrasts to the reference category (eggs, southern and lentic, respectively). The mean level of phylogenetic signal (λ) across the 10,000 iterations is presented alongside its 95 percentiles.
95 percentile
Parameter Mean coef. 0.025 0.975
Thorax length 4.87×10⁻⁴ 4.15×10⁻⁴ 5.65×10⁻⁴
Overwintering stage—both −0.005 −0.006 −0.004
Overwintering stage—larvae −2.82×10⁻⁴ −9.58×10⁻⁴ 6.78×10⁻⁴
Flight period duration −0.004 −0.005 −0.002
Distribution status 0.003 0.002 0.003
Region—northern 0.003 0.001 0.004
Region—oceanic −0.007 −0.007 −0.006
Region—widespread −0.005 −0.007 −0.005
Habitat breadth 0.001 0.001 0.001
Breeding habitat—both 0.003 0.002 0.003
Breeding habitat—lotic 0.004 0.003 0.004
λ(phylo. signal) 0.035 <0.001 0.36
pumilioandGomphus vulgatissimusboth of which were classified as southern species. Northern species showed the largest increases, although this result is highly uncertain (reflected in the wide 95% CI across the 10,000 iterations). Lentic species tended to have lower trend estimates than lotic species and those species that utilise both breeding habitat strategies. Finally, there appeared to be little evidence of an influence of overwintering stage on species trend. Trends tended to be similar between species that overwinter as eggs and those that overwinter as larvae. Species that can overwinter as both eggs and larvae had the lowest average trend estimates, however this category was comprised of four species only. In general, the phylogenetic signal across the model iterations was low, with a mean of 0.035 (0.0–0.36).
DISCUSSION
We found that the dragonfly fauna in Britain and Ireland has undergone considerable change during recent decades, with high levels of interspecific variation in occurrence trends. We found 8 species (22%) had declined, whereas 19 species (53%) showed increasing trends. The large number of species with positive trends is likely to reflect the recovery of dragonfly populations in response to increased water quality in Britain since the mid-20th century. Although a greater number of species increasing than declining is good news for conservation, this could reflect biotic homogenization, i.e., the fauna becoming dominated by a certain group of species, leading to the erosion of local and regional difference between communities (Keith et al., 2009).
Figure 2 The mean and 95 percentiles of the trait coefficients across 10,000 model iterations.Each categorical variable had a reference category which had a parameter estimate set to 0. The reference categories were as follows: region, “southern”; breeding habitat, “lentic”; and for overwintering stage, “eggs.”
A variety of studies have provided evidence of this relationship, i.e.,Devictor et al. (2008)
found bird communities in France between 1989 and 2006 were increasingly dominated by species that prefer warmer conditions, whileLima et al. (2007)found evidence of northward range expansions in warm-water adapted Portuguese algae.Hickling et al.
(2005)used distribution region to explain variation in range shift and expansion in British
Odonata, finding that southern species showed greater poleward shifts and expansions compared to northern species. We found little evidence of a difference between northern and southern species, however this is likely due the low number of northern species (n=4) included in our dataset. Interestingly,Angert et al. (2011)found no correlation between range shift and position of the northern range limit (which is related to our measure of distribution region). Despite the wealth of evidence that points to climate change as the likely driver of increases in southern species, we cannot ignore the role of improved water quality and standing water availability in southern Britain (Hickling et al., 2005;Vaughan & Ormerod, 2012;Cham et al., 2014).Durance & Ormerod (2009)noted that improved water quality can confound attempts to detect the impact of climate change on freshwater macroinvertebrates. Southern species are likely to have benefitted from both the increased water quality in southern Britain and improved climate suitability, while the former was the main positive driver for widespread species, this could explain the greater increases in southern compared to widespread species. Not all southern species showed positive trends (notablyIschnura pumilioandGomphus vulgatissimus); here the limited expansion is likely due to a lack of suitable habitat.
Botts, Erasmus & Alexander, 2012). Much of the evidence of this relationship is based on studies of terrestrial organisms (Biesmeijer et al., 2006;Ozinga et al., 2012;Newbold et al., 2013), with a notable exception fromBall-Damerow, M’Gonigle & Resh (2014). Here, we found that the relationship holds in the Odonata fauna of the UK as habitat breadth was positively correlated with occurrence trend. The likely cause of this relationship is that habitat generalists have a greater ability to adapt to novel environmental conditions, which is particularly important in our current climate of anthropogenically driven environmental change (Travis, 2003;Newbold et al., 2013). Thorax length and distribution status (used here as a measure of range size) were positively related to occurrence trends, i.e., narrow ranged, “rare,” small sized species tended to have lower trend estimates than wider ranging, larger species. Geographic range size and thorax length are often used as surrogates for traits associated with ecological specialism and competitive ability (Gittleman, 1985;
Gaston, 2003;Angert et al., 2011). Therefore, as with habitat specialism above, we believe this result is driven by the greater ability of competitive ecological generalists to adapt to environmental change than specialists.
Hof et al. (2012)found lentic (i.e., pond and lake dwelling) species had a greater ability to track changes in their climatic niche due to their greater dispersal ability, essential given the ephemeral nature of their breeding sites. We hypothesised that the greater dispersal ability of lentic species would promote their resilience to environmental change leading to a higher average trend estimate than lotic species. The results in this study do not support our hypothesis as lentic species tended to have lower trend estimates than lotic species. Differences in mean trend between lentic and lotic species are likely due to differences in the impact environmental stressors (e.g., climate change, eutrophication and other forms of habitat degradation), interactions between them and subsequent restoration between rivers and lakes (Vaughan & Ormerod, 2012). A study aimed at improving our understanding of the variation between lentic and lotic species is a prime candidate for future work.
Finally, we found that flight period was negatively related to occurrence trend, a result contrary to expectations. As with the lentic/lotic hypothesis, initially we suspected that species with greater dispersal ability would show higher trends as increased dispersal capacity increases the ability to mitigate the negative effects of environmental. We used flight period as a surrogate of dispersal ability on the premise that the longer the flight season the more time a species has to disperse (Grewe et al., 2012). It is plausible that the use of a more direct measure of dispersal ability would have produced a result that is consistent with the literature on dispersal ability and species trends. It is worth noting that the reliability of the trait-trend results depend on the accuracy of the underlying trait and trend data, and we note that within a given species, traits can vary spatially. One such plastic trait includes flight period that has been shown to vary with latitude (Corbet, 2004). Summarising this variation into a single value per trait per species is a common approach but can create noise in model results.
that habitat generalists that occupy southern Britain tend to have increased in comparison to the narrow-ranged specialist species of dragonfly. We believe this reflects the impact of environmental change, particularly climate change, as the increased ambient temperature in Britain and Ireland better suits species that are adapted to warmer conditions. The lower trend estimates for specialist species is a cause of conservation concern as this result combined with evidence in previous studies could be a sign of biotic homogenization with ecological specialists being replaced by warm-adapted generalists.
ACKNOWLEDGEMENTS
We are indebted the British Dragonfly Society and its vast collection of volunteer recorders, without them this project would not be possible. We thank Oliver Pescott, Colin Harrower, Tom August and Louise Barwell for their advice on the data analysis. We thank Christopher Hassall and Lester Yuan for providing valuable feedback on an earlier draft of this study.
ADDITIONAL INFORMATION AND DECLARATIONS
Funding
This work was funded by the Natural Environment Research Council (NERC). The funders had no role in study design, data collection and analysis, decision to publish, or preparation of the manuscript.
Grant Disclosures
The following grant information was disclosed by the authors: Natural Environment Research Council (NERC).
Competing Interests
Gary D. Powney and Nick J.B. Isaac are employees of NERC Centre for Ecology & Hydrology. Steve Cham and Dave Smallshire are members of the British Dragonfly Society.
Author Contributions
• Gary D. Powney conceived and designed the experiments, performed the experiments, analyzed the data, contributed reagents/materials/analysis tools, wrote the paper, prepared figures and/or tables, reviewed drafts of the paper.
• Steve S.A. Cham and Dave Smallshire performed the experiments, contributed reagents/materials/analysis tools, reviewed drafts of the paper.
• Nick J.B. Isaac conceived and designed the experiments, performed the experiments, analyzed the data, contributed reagents/materials/analysis tools, wrote the paper, reviewed drafts of the paper.
Data Availability
Supplemental Information
Supplemental information for this article can be found online athttp://dx.doi.org/ 10.7717/peerj.1410#supplemental-information.
REFERENCES
Angert AL, Crozier LG, Rissler LJ, Gilman SE, Tewksbury JJ, Chunco AJ. 2011.Do species’ traits predict recent shifts at expanding range edges?Ecology Letters14:677–689
DOI 10.1111/j.1461-0248.2011.01620.x.
Ball-Damerow JE, M’Gonigle LK, Resh VH. 2014.Changes in occurrence, richness, and biological traits of dragonflies and damselflies (Odonata) in California and Nevada over the past century.
Biodiversity and Conservation23:2107–2126DOI 10.1007/s10531-014-0707-5.
Bellard C, Bertelsmeier C, Leadley P, Thuiller W, Courchamp F. 2012.Impacts of climate change on the future of biodiversity.Ecology Letters15:365–377DOI 10.1111/j.1461-0248.2011.01736.x.
Biesmeijer JC, Roberts SPM, Reemer M, Ohlem¨uller R, Edwards M, Peeters T, Schaffers AP, Potts SG, Kleukers R, Thomas CD, Settele J, Kunin WE. 2006.Parallel declines in pollinators and insect-pollinated plants in Britain and the Netherlands. Science313:351–354
DOI 10.1126/science.1127863.
Botts EA, Erasmus BFN, Alexander GJ. 2012.Small range size and narrow niche breadth predict range contractions in South African frogs.Global Ecology and Biogeography 22:567–576 DOI 10.1111/geb.12027.
Brooks SJ, Lewington R. 2007.Field guide to the Dragonflies and Damselflies of Great Britain and Ireland. Dorset: British Wildlife Publishing.
Bush AA, Nipperess DA, Duursma DE, Theischinger G, Turak E, Hughes L. 2014.
Continental-scale assessment of risk to the Australian odonata from climate change.PLoS ONE9:e88958DOI 10.1371/journal.pone.0088958.
Butchart SHM, Walpole M, Collen B, Van Strien A, Scharlemann JPW, Almond REA, Baillie JEM, Bomhard B, Brown C, Bruno J, Carpenter KE, Carr GM, Chanson J, Chenery AM, Csirke J, Davidson NC, Dentener F, Foster M, Galli A, Galloway JN, Genovesi P, Gregory RD, Hockings M, Kapos V, Lamarque J-F, Leverington F, Loh J, McGeoch MA, McRae L, Minasyan A, Morcillo MH, Oldfield TEE, Pauly D, Quader S, Revenga C, Sauer JR, Skolnik B, Spear D, Stanwell-Smith D, Stuart SN, Symes A, Tierney M, Tyrrell TD, Vi´e J-C, Watson R, Hern´andez Morcillo M. 2010.Global biodiversity: indicators of recent declines.Science328:1164–1168DOI 10.1126/science.1187512.
Cardillo M, Mace GM, Gittleman JL, Jones KE, Bielby J, Purvis A. 2008.The predictability of extinction: biological and external correlates of decline in mammals.Proceedings of the Royal Society B—Biological Sciences275:1441–1448DOI 10.1098/rspb.2008.0179.
Cardillo M, Mace GM, Gittleman JL, Purvis A. 2006.Latent extinction risk and the future battlegrounds of mammal conservation.Proceedings of the National Academy of Sciences of the United States of America103:4157–4161DOI 10.1073/pnas.0510541103.
Cham S, Nelson B, Parr A, Prentice S, Smallshire D, Taylor P. 2014.Atlas of Dragonflies in Britain and Ireland. Telford: Field Studies Council.
Chen I-C, Hill JK, Ohlemuller R, Roy DB, Thomas CD, Ohlem¨uller R. 2011.Rapid range shifts of species associated with high levels of climate warming.Science333:1024–1026
Cooper N, Bielby J, Thomas GH, Purvis A. 2008.Macroecology and extinction risk correlates of frogs.Global Ecology and Biogeography17:211–221DOI 10.1111/j.1466-8238.2007.00355.x.
Corbet P. 2004.Dragonflies—behaviour and ecology of Odonata. Colchester: Harley Books.
De Vos JM, Joppa LN, Gittleman JL, Stephens PR, Pimm SL. 2014.Estimating the normal background rate of species extinction.Conservation Biology29:452–462
DOI 10.1111/cobi.12380.
Devictor V, Julliard R, Couvet D, Jiguet F. 2008.Birds are tracking climate warming, but not fast enough.Proceedings of the Royal Society B—Biological Sciences275:2743–2748
DOI 10.1098/rspb.2008.0878.
Dingemanse NJ, Kalkman VJ. 2008.Changing temperature regimes have advanced the phenology of Odonata in the Netherlands.Ecological Entomology33:394–402
DOI 10.1111/j.1365-2311.2007.00982.x.
Dirzo R, Young HS, Galetti M, Ceballos G, Isaac NJB, Collen B. 2014.Defaunation in the Anthropocene.Science345:401–406DOI 10.1126/science.1251817.
Durance I, Ormerod SJ. 2009.Trends in water quality and discharge confound long-term warming effects on river macroinvertebrates.Freshwater Biology54:388–405
DOI 10.1111/j.1365-2427.2008.02112.x.
Fisher DO, Owens IPF. 2004.The comparative method in conservation biology.Trends in Ecology & Evolution19:391–398DOI 10.1016/j.tree.2004.05.004.
Foufopoulos J, Kilpatrick AM, Ives AR. 2011.Climate change and elevated extinction rates of reptiles from Mediterranean islands.The American Naturalist177:119–129
DOI 10.1086/657624.
Freckleton RP, Harvey PH, Pagel M. 2002.Phylogenetic analysis and comparative data: a test and review of evidence.The American Naturalist160:712–726DOI 10.1086/343873.
Fritz SA, Bininda-Emonds ORP, Purvis A. 2009.Geographical variation in predictors of mammalian extinction risk: big is bad, but only in the tropics.Ecology Letters12:538–549 DOI 10.1111/j.1461-0248.2009.01307.x.
Gaston KJ. 2003.The structure and dynamics of geographic ranges. Oxford: Oxford University Press.
Gittleman JL. 1985.Carnivore body size: ecological and taxonomic correlates.Oecologia 67:540–554DOI 10.1007/BF00790026.
Grewe Y, Hof C, Dehling DM, Brandl R, Br¨andle M. 2012.Recent range shifts of European dragonflies provide support for an inverse relationship between habitat predictability and dispersal.Global Ecology and Biogeography22:403–409DOI 10.1111/geb.12004.
Hassall C, Thompson DJ. 2010.Accounting for recorder effort in the detection of range shifts from historical data.Methods in Ecology and Evolution1:343–350
DOI 10.1111/j.2041-210X.2010.00039.x.
Hassall C, Thompson DJ, French GC, Harvey IF. 2007.Historical changes in the phenology of British Odonata are related to climate.Global Change Biology13:933–941
DOI 10.1111/j.1365-2486.2007.01318.x.
Hickling R, Roy DB, Hill JK, Fox R, Thomas CD. 2006.The distributions of a wide range of taxonomic groups are expanding polewards. Global Change Biology 12:450–455 DOI 10.1111/j.1365-2486.2006.01116.x.
Hill JK, Thomas CD, Fox R, Telfer MG, Willis SG, Asher J, Huntley B. 2002.Responses of butterflies to twentieth century climate warming: implications for future ranges.Proceedings of the Royal Society B—Biological Sciences269:2163–2171DOI 10.1098/rspb.2002.2134.
Hof C, Brandle M, Brandl R. 2006.Lentic odonates have larger and more northern ranges than lotic species.Journal of Biogeography33:63–70DOI 10.1111/j.1365-2699.2005.01358.x.
Hof C, Br¨andle M, Dehling DM, Mungu´ıa M, Brandl R, Ara ´ujo MB, Rahbek C. 2012.Habitat stability affects dispersal and the ability to track climate change.Biology Letters8:639–643 DOI 10.1098/rsbl.2012.0023.
Isaac NJB, Van Strien AJ, August TA, De Zeeuw MP, Roy DB. 2014.Statistics for citizen science: extracting signals of change from noisy ecological data.Methods in Ecology and Evolution 5:1052–1060DOI 10.1111/2041-210X.12254.
ICUN. 2001.IUCN red list categories and criteria—version 3.1. Gland: ICUN Species Survival Commission.Available athttp://www.iucnredlist.org/technical-documents/categories-and-criteria/ 2001-categories-criteria.
Keith SA, Newton AC, Morecroft MD, Bealey CE, Bullock JM. 2009.Taxonomic homogenization of woodland plant communities over 70 years.Proceedings of the Royal Society B—Biological Sciences276:3539–3544DOI 10.1098/rspb.2009.0938.
Koh LP, Sodhi NS, Brook BW. 2004.Ecological correlates of extinction proneness in tropical butterflies.Conservation Biology18:1571–1578DOI 10.1111/j.1523-1739.2004.00468.x.
Lee Foote A, Rice Hornung CL. 2005.Odonates as biological indicators of grazing effects on Canadian prairie wetlands.Ecological Entomology30:273–283
DOI 10.1111/j.0307-6946.2005.00701.x.
Lima FP, Ribeiro PA, Queiroz N, Hawkins SJ, Santos AM. 2007.Do distributional shifts of northern and southern species of algae match the warming pattern?Global Change Biology 13:2592–2604DOI 10.1111/j.1365-2486.2007.01451.x.
Mattila N, Kaitala V, Komonen A, P¨aivinen J, Kotiaho JS. 2011.Ecological correlates of distribution change and range shift in butterflies.Insect Conservation and Diversity4:239–246 DOI 10.1111/j.1752-4598.2011.00141.x.
Men´endez R, Meg´ıas AG, Hill JK, Braschler B, Willis SG, Collingham Y, Fox R, Roy DB,
Thomas CD. 2006.Species richness changes lag behind climate change.Proceedings of the Royal Society B—Biological Sciences273:1465–1470DOI 10.1098/rspb.2006.3484.
Myers P, Lundrigan BL, Hoffman SMG, Haraminac AP, Seto SH. 2009.Climate-induced changes in the small mammal communities of the Northern Great Lakes Region.Global Change Biology 15:1434–1454DOI 10.1111/j.1365-2486.2009.01846.x.
Newbold T, Scharlemann JPW, Butchart SHM, Sekercio˘glu CH, Alkemade R, Booth H, Purves DW, Sekercioglu CH. 2013.Ecological traits affect the response of tropical forest bird species to land-use intensity.Proceedings of the Royal Society B—Biological Sciences 280:2012–2131.
Orme CDL. 2012.The caper package: comparative analyses in phylogenetics and evolution in R.
Available athttp://caper.r-forge.r-project.org.
Ozinga WA, Colles A, Bartish IV, Hennion F, Hennekens SM, Pavoine S, Poschlod P,
Hermant M, Schamin´ee JHJ, Prinzing A. 2012.Specialists leave fewer descendants within a region than generalists.Global Ecology and Biogeography22:213–222
DOI 10.1111/j.1466-8238.2012.00792.x.
Paradis E, Claude J, Strimmer K. 2004.APE: analyses of phylogenetics and evolution in R language.Bioinformatics20:289–290DOI 10.1093/bioinformatics/btg412.
Powney GD, Brooks SJ, Barwell LJ, Bowles P, Fitt RNL, Pavitt A, Spriggs R, Isaac NJB. 2014.
Morphological and geographical traits of the British Odonata.Biodiversity Data Journal2:e1041 DOI 10.3897/BDJ.2.e1041.
P¨oyry J, Leinonen R, S¨oderman G, Nieminen M, Heikkinen RK, Carter TR. 2011.
Climate-induced increase of moth multivoltinism in boreal regions.Global Ecology and Biogeography20:289–298DOI 10.1111/j.1466-8238.2010.00597.x.
Prendergast JR, Wood SN, Lawton JH, Eversham BC. 1993.Correcting for variation in recording effort in analyses of diversity hotspots.Biodiversity Letters1:39–53DOI 10.2307/2999649.
Purvis A, Gittleman JL, Cowlishaw G, Mace GM. 2000.Predicting extinction risk in declining species.Proceedings of the Royal Society B—Biological Sciences267:1947–1952
DOI 10.1098/rspb.2000.1234.
Sahl´en G, Ekestubbe K. 2001.Identification of dragonflies (Odonata) as indicators of general species richness in boreal forest lakes.Biodiversity and Conservation10:673–690
DOI 10.1023/A:1016681524097.
Samways MJ, Steytler NS. 1996.Dragonfly (Odonata) distribution patterns in urban and forest landscapes, and recommendations for riparian management.Biological Conservation 78:279–288DOI 10.1016/S0006-3207(96)00032-8.
Silvertown J. 2009.A new dawn for citizen science.Trends in Ecology & Evolution24:467–471 DOI 10.1016/j.tree.2009.03.017.
Thomas CD, Bodsworth EJ, Wilson RJ, Simmons AD, Davies ZG, Musche M, Conradt L. 2001.
Ecological and evolutionary processes at expanding range margins.Nature411:577–581 DOI 10.1038/35079066.
Thomas JA, Telfer MG, Roy DB, Preston CD, Greenwood JJD, Asher J, Fox R, Clarke RT, Lawton JH. 2004.Comparative losses of British butterflies, birds, and plants and the global extinction crisis.Science303:1879–1881DOI 10.1126/science.1095046.
Tingley MW, Beissinger SR. 2009.Detecting range shifts from historical species occurrences: new perspectives on old data.Trends in Ecology & Evolution24:625–633
DOI 10.1016/j.tree.2009.05.009.
Travis JMJ. 2003.Climate change and habitat destruction: a deadly anthropogenic cocktail. Pro-ceedings of the Royal Society B—Biological Sciences270:467–473DOI 10.1098/rspb.2002.2246.
Van Strien AJ, Van Swaay CAM, Termaat T. 2013.Opportunistic citizen science data of animal species produce reliable estimates of distribution trends if analysed with occupancy models.
Journal of Applied Ecology50:1450–1458DOI 10.1111/1365-2664.12158.
Vaughan IP, Ormerod SJ. 2012.Large-scale, long-term trends in British river macroinvertebrates.
Global Change Biology18:2184–2194DOI 10.1111/j.1365-2486.2012.02662.x.