TEXT FOR DISCUSSION
TEXT FOR DISCUSSION
Drug Battles and School Achievement:
Joana Monteiro
Researcher of Applied Economics of FGV/IBRE
June de 2013
By Joana Monteiro and Rudi Rocha∗
This paper examines the effects of armed conflicts between drug gangs in Rio de Janeiro’s favelas on student achievement. We explore variation in violence that occurs across time and space when gangs battle over territories. Within-school estimates indi-cate that students from schools exposed to violence score less in math exams. The effect of violence increases with conflict inten-sity, duration, and proximity to exam dates; and decreases with the distance between the school and the conflict location. Finally, we find that school supply is an important mechanism driving the achievement results; armed conflicts are significantly associated with higher teacher absenteeism, principal turnover, and tempo-rary school closings.
JEL: I25, K42, O12
Keywords: slums, violence, drug gangs, student achievement
∗ Monteiro: Brazilian Institute of Economics, Get´ulio Vargas Foundation (IBRE/FGV), Rio de Janeiro, Brazil
(joana.monteiro@fgv.br). Rocha: Institute of Economics, Federal University of Rio de Janeiro (IE/UFRJ), Rio de Janeiro, Brazil (rudi.rocha@ie.ufrj.br). We thank Filipe Campante, Ign´acio Cano, Melissa Dell, Claudio Ferraz, S´ergio Ferreira, Asim Khwaja, Horacio Larreguy, Joana Naritomi, Rohini Pande, Dan Posner, Heather Schofield, Rodrigo Soares, David Yanagizawa-Drott and seminar participants at the 2012 NEUDC, MIT Political Economy Breakfast, the 33rd Meeting of the Brazilian Econometric Society, the 1st Meeting of AL CAPONE-Lacea, PUC-Rio, and Harvard Development Lunch for helpful comments. We are extremely grateful to Paulo Ferraz for his support over the project and Disque-Den´uncia for providing access to data. Bruna Camargo provided excellent research assistance. We are also thankful to M´arcio Costa, Giovanni Zambotti, Zeca Borges, Fernando Cavalieri, ´
Alvaro Crispin, Michelle Jorge, Luiz Roberto Arueira da Silva, Paulo Teixeira and Marco Antonio Zambelli. Joana Monteiro gratefully acknowledges Corporaci´on Andina de Fomento (CAF), CAPES and CNPq financial support and the hospitality of the Center for International Development at Harvard University.
Drug Battles and School Achievement: Evidence from Rio de
Drug-related violence perpetrated by criminal gangs is a widespread phenomenon in many developed and developing countries, particularly in urban areas. In recent years, violence involving drug trafficking organizations has notoriously reached unprecedented levels in Mexico and Central America (Rios (2012), Geneva Declaration (2011)). Conflicts between drug dealers using combat weapons caused Marseille, France, to experience one of the most extreme periods of violence in its history in 2012 (New York Times (2012)). In the US, retail drug trade and the distribution activities are routinely associated with violent, and often lethal, disputes over control of drug territory and enforcement of drug debts (FBI (2011)). Although the negative consequences of drug-related violence may go far beyond the casualties of those directly involved in the criminal activity and its victims, little is known about whether this phenomenon has other detrimental impacts on the population of affected areas. In particular, violence can have serious welfare consequences both in the short and in the long run if it impacts education production, children’s schooling, and accumulation of human capital.
This paper studies the negative spillovers of conflicts between drug gangs in Rio de Janeiro by analyzing how they affect educational outcomes of children attending schools located in and around conflict areas. In recent decades, several favelas (slums) scattered across the city have been dominated by drug gangs, who use the territory to sell drugs and hide from police (Misse (1999), Silva et al. (2008)).1 When gangs fight to gain territory local
violence skyrockets. These conflicts are extremely violent and rely on heavy weaponry, such as grenades and modern military-grade machine guns. As a consequence, once a conflict is triggered, safety concerns and threats to individuals’ lives dramatically increase in the conflict’s location. In this setting, we may expect potential connections between violence and our main outcome variable, student test scores. For instance, violence may disrupt the school routine, increase teacher and student absenteeism, and cause major psychological distress.
The estimation of the causal effects of drug-related violence on educational outcomes is not a trivial exercise due to two main empirical challenges. First, conflict-prone areas are markedly different from non-violent ones in terms of hard-to-measure individual and community characteristics, confounding cross-section analysis that aims to identify the violence effects. We circumvent this problem by exploring variation in drug-related conflicts
1
over time and space. Most of the disputes occur because gangs have no access to legally enforceable contracts or property rights and, therefore, typically rely on violence as the primary tool to resolve disputes. Indeed, our data suggest that drug gang conflicts are not rare events: on 65 percent of the days between 2003 and 2009, there was at least one favela in conflict in Rio de Janeiro. Such high conflict frequency supports the view that the equilibrium of power among gangs is very unstable. The qualitative evidence indicates that conflicts in Rio de Janeiro are triggered by factors exogenous to local socioeconomic conditions, such as the imprisonment or release of a gang leader, betrayals, or revenge. Similar factors have been pointed out by studies on street gangs in the US and drug gangs in Mexico. Levitt and Venkatesh (2000) suggest that social/nonpecuniary factors are likely to play an important role in explaining why gangs initiate conflicts, and emphasize that the decision-making of gang members cannot be reconciled with that of optimizing agents. In addition, they point out that a single member of a gang can easily initiate a dispute to show toughness, and that once such violence occurs, it is difficult for the opposing gang not to retaliate. Topalli et al. (2002) found in interviews with active drug dealers that vengeance and the maintenance of reputations for dangerousness are reported as motives for gang violence in St Louis, Missouri. Guerrero-Gutierrez (2011) argues that alliances between drug trafficking organizations in Mexico have been highly unstable during the past five years and that, within drug trafficking organizations, most decisions about day-to-day operations are decentralized. Our empirical strategy allows us to estimate the causal effect of violence on education since it explores idiosyncratic temporal variation in violence rather than cross-sectional differences in neighborhood chronic violence or even in the persistent presence of drug gangs. By doing so, our strategy disentangles the effects of violence from other types of socioeconomic disadvantages that correlate with educational outcomes.
We focus our analysis on young students (5th graders) from schools located inside or on the borders of favelas. We provide evidence that students from schools which are exposed to violence perform worse on standardized math exams. Conflicts during the academic year are associated with a decrease of 0.054 standard deviations in math test scores. The violence effect increases with conflict intensity and duration, and when the conflict occurs in the months just before the exam. The effect rapidly decreases with the distance between the school and the conflict location, which supports the view that the negative spillovers on education are geographically localized. Although there are significant short-run impacts, there is no evidence that the effect of violence persists over time. The results are not driven by student selection and are robust to placebo tests. In particular, we find no association between violence that occurs after the exam and performance at the exam. Finally, we find that the impact of violence on school supply is an important mechanism driving our results. Armed conflicts are significantly associated with higher teacher absenteeism, principal turnover and temporary school shutdown.
To the best of our knowledge, there is no causal estimate in the literature that provides unequivocal evidence linking violence and educational outcomes. The existing literature relies on cross-sectional analyses and faces difficulties in disentangling violence from other types of socioeconomic disadvantage that also have negative impacts on children’s educa-tion, such as poverty, domestic violence and parental education (as in Grogger (1997), Aizer (2007), Severnini and Firpo (2009)). For instance, Grogger (1997) documents that violence within schools, measured with data from principal reports, is negatively correlated with the likelihood of high school graduation and the probability of college attendance. However, violent schools are more likely to be in poorer neighborhoods, where families may suffer from other forms of disadvantage. It may be the differences in family backgrounds, not in school violence per se, that are responsible for the results.
A growing number of studies examines negative spillovers of disputes in drug markets. Fryer et al. (forthcoming) suggest that the expansion of crack cocaine markets in the US led to adverse consequences such as an increase in homicide rates and low birth weight among blacks. Evans et al. (2012) argue that the introduction of crack cocaine in the US and the consequent spike in violence lowered life expectancy of young black males and decreased their high-school graduation rates. Contrary to our results, they find that drug markets impact educational outcomes through changes in the returns to education, while our results emphasize the school supply channel. Dell (2011) analyzes the drug war in Mexico and finds suggestive evidence that drug trafficking presence is associated with lower informal sector wages and female labor force participation. Frischtak and Mandel (2012) show that the removal of drug traffickers’ rule from favelas in Rio is correlated with an increase in property values.2
The remainder of the paper is organized as follows. Section I describes the institutional background, while section II presents the data on violence and primary education in Rio de Janeiro. Section III presents a conceptual discussion and our identification strategy. In sections IV and V we provide the results of the analysis. Section VI concludes.
I. Institutional Background
A. Drug Gangs and Violence in Rio de Janeiro
In 2009, 2,155 people were murdered in the city of Rio de Janeiro, resulting in a homicide rate of 32 per 100,000 habitants. This rate is comparable to those of the most violent cities in the United States, such as Detroit (40 murders per 100,000 habitants), Baltimore (37) and Newark (26).3 This record, already high by international standards, masks striking differences in exposure to violence within the city. In 2009, poor neighborhoods in the Northern zone of the city experienced 60.3 deaths per 100,000 inhabitants, while rich neighborhoods in the Southern zone recorded a homicide rate of approximately 6.6 per 100,000 habitants.4
Violence in Rio de Janeiro increased rapidly in the early 1980s. This period is marked by the foundation of Comando Vermelho (CV), the first major organized drug gang in Rio
2
Similarly, but focusing instead on terrorism, Besley and Mueller (2012) exploit within-region variability in violence and house prices over time in Northern Ireland to show that the peace process resulted in an increase in housing prices.
3
Source: FBI’s Uniform Crime Reporting (UCR) Program.
4
de Janeiro (Dowdney (2003)). During this time, drug dealers utilized the marijuana trade network already established in Rio de Janeiro’s favelas to sell cocaine. Control over the favelas’ territory became crucial to protecting the illicit and lucrative trade. The favelas’ geography, with tiny streets and crowded corners, as well as a lack of enforcement of formal rules within its boundaries, make them an important market for drugs as well as a strategic place to hide from police (Silva et al. (2008)). The higher profitability of cocaine trade changed drug trade dynamics and soon led to an increasing disputes among gang members. As a result, some members left Comando Vermelho and created Terceiro Comando (TC) in the late 1980s (Misse (1999)). In the 1990s, two additional gangs, Amigos dos Amigos (ADA) and Terceiro Comando Puro (TCP), were created by dissidents of the two former gangs. This fractionalization led to more armed conflicts over the control of favelas, and to an increasing militarization of the drug gangs (Misse (1997)). The arsenal used in the conflicts has often included heavy weaponry, such as grenades and modern military machine guns (for instance, M-16, AK-47, AR-15, .30 and .50 caliber machine guns), leading to high death tolls even among those not directly involved in the drug trade.5
We gathered qualitative evidence from research in sociology, media coverage, and conver-sations with the Intelligence Unit of the Military Police in order to better characterize drug gangs’ behavior and understand the determinants of conflicts. Overall, we find evidence supporting the view that the conflicts between drug gangs are not strategically planned and instead often respond to idiosyncratic triggers, such as the imprisonment or release of a gang leader, betrayals, and revenge. According to Misse (1997) and Souza (2001), the Rio de Janeiro’s drug gangs do not have a hierarchical structure ruled by a drug baron as in the models found in Colombia or in the Italian mafia. Dowdney (2003) defines the drug gangs of Rio de Janeiro as “networks of affiliated independent actors”, while Baptista et al. (2000) emphasize that the gangs are controlled by a group of independent leaders who are inexperienced and young. Though some coordination may occur among leaders within gangs,6 each favela typically has a local boss who runs the operations independently and who decides how to defend the territory and whether to attack his rivals.
Case studies and conversations with officers of the Intelligence Unit of the Military Police support the view that there is an unstable equilibrium among local drug traffickers. The local boss controls the favela and maintains the order until the “peace” is broken by the
5
According to the 2009 ISP Annual Report, about 30% of all illegal weapons collected through police operations in 2009 in the State of Rio de Janeiro were classified as weapons of “high destructive power”, such as large-caliber machine guns.
6
imprisonment or release of a gang leader, betrayal, honor-related violence, or assassinations of gang members. In the words of a favela resident quoted in Perlman (2010), “things are quiet here when a gang is in control. But if the leader is killed or imprisoned, all hell breaks loose - there is a war over who will control the turf”. The newspaper coverage also supports that conflicts are triggered in a quasi-random manner. For example:
Excerpt 1: Three people died and eight were wounded after Vila dos Pinheiros invasion by Baixa do Sapateiro drug dealers...The invasion was led by Nei da Concei¸c˜ao Cruz, known as Fac˜ao (machete), the main leader of Terceiro Comando Puro (TCP). The conflict began at 10 pm and lasted the whole night. The operation was supported by Matem´atico (mathematician) (...). Fac˜ao and Matem´atico left the jail last month after winning in Court the right to work outside the jail and come back to sleep. Both criminals did not return to jail after the first day under the new sentence. (Source: Meia Hora, 5/31/2009)
Excerpt 2: Drug dealers from Morro dos Macacos reobtained the control of three favelas in ´Agua Santa with the support of drug dealers from Rocinha and S˜ao Carlos (...). The area was under militia control since last year. The conflict lasted five hours. According to the police department, the invasion was led by Luciano de Oliveira Felipe, known as Cotonete (cotton swab), who is the former favela traffic manager. He was deposed one year ago and was hidden in Morro dos Macacos. (Source: Meia Hora, 6/12/2009)
Excerpt 3: ...in July, Marcus Vinicius Martins Vidinhas J´unior, known as Palha¸co (clown), betrayed his father-in-law, Celsinho da Vila Vint´em, who is in jail but is still the favela drug baron. Palha¸co killed 13 drug gang members in order to control drug trade slots. Two days later, Celsinho’s allies deposed Palha¸co, who ran away with guns and R$
1 million. (Source: Meia Hora, 9/22/2009)
People who are associated with a drug gang can be evicted from their homes or murdered when a new gang assumes control. In addition, as the excerpts show, conflict duration can vary greatly. Conflicts to depose a gang can take anywhere for a few hours to multiple days. Though incumbents often succeed the battle, cases of deposal are usually followed by attempts to reconquer the territory further extending the period of violence. This effort to regain control may occur in the same week or a few months later, depending on how much support the deposed gang can gather from other leaders. Therefore, when a conflict begins, it is hard to predict when it will end. The impact of these conflicts on the daily routine of the Rio de Janeiro’s habitants is also attested to with the responses from a victimization survey conducted in 2007. Fear of a stray bullet (60%) and being caught in the crossfire (44%) were mentioned as the violent events which respondents were most afraid of, followed by robberies (37%).7
The police force in Rio de Janeiro has low wages, a long history of corruption, and less effective weapons than the drug gangs (Perlman (2010)). Hence, the police does not always intervene in the gang conflicts. When they intervene, however, it is usually after the first battles, and in particular when the conflict reaches larger proportions and public attention. Until recently, the interventions attempted only to interrupt the conflict, and not to definitively remove the drug dealers’ control over the favelas.8
B. The Favelas of Rio de Janeiro
The Rio de Janeiro’s City Plan defines favelas as those areas used mainly for housing, characterized by tiny and irregular streets, irregular plot size, poor urban services and a lack of the usual legal procedures of formal licensing and construction.9 There are 979
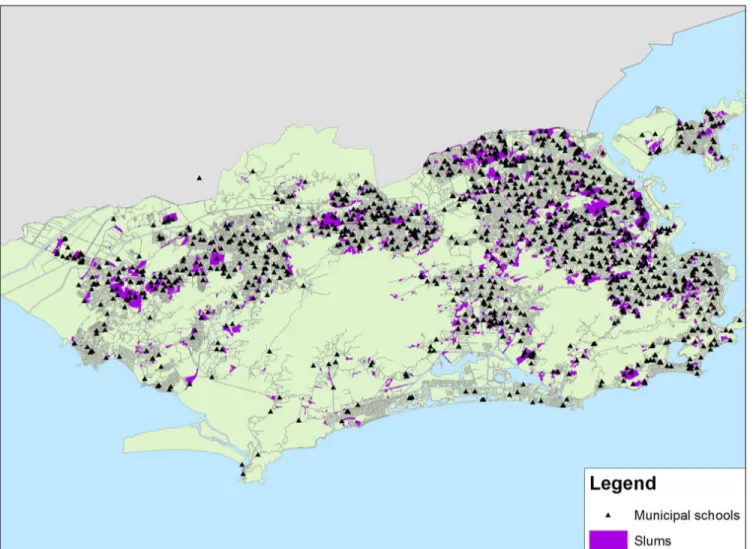
favelas in Rio de Janeiro according to Instituto Pereira Passos, which concentrate 1.093 million people or 19 percent of the city population (2000 Census data) in those areas. Figure 1 shows the map of the city of Rio de Janeiro with the favelas’ locations. As we can see, the favelas are quite widespread across the city.
While most of the conflicts occur in favelas, not all favelas are controlled by drug gangs or are constantly under conflict. Favelas are also not a synonym of poverty. Although favelas typically have high poverty rates, not all families that live in favelas are poor, nor
7
This survey was carried out by DATAUFF and interviewed 4,000 people in the Rio de Janeiro metropolitan area. The percentage shown corresponds to answers from people who live in the city of Rio de Janeiro.
8
The police force strategy started to change only by the end of 2008, when the state government implemented the first Pacifying Police Unit (UPP), which aims to permanently remove the drug traffickers rule from the favelas.
9
do all the urban poor live in favelas (Perlman (2010)). Access to urban infrastructure, especially water and electricity distribution, has improved in the favelas in the last two decades (Vianna (2008)). Yet, social inequalities still persist. According to Neri (2010), in 2007-2008 earnings and education amongst the favela inhabitants were significantly lower than the earnings and education levels of non-favela inhabitants (average earnings were 49 percent lower, while years of education were 3.5 lower amongst favela dwellers).
C. The Municipal Education System
The municipal administration is the main elementary school provider in Rio de Janeiro. The municipal system of Rio is one of the largest in Brazil, comprising 1,063 elementary schools and 550,000 students. First to fifth graders correspond to 46 percent of the students enrolled in the system. There are no school districts in the city and students have some choice of which school they would like to attend. However, some schools have more demand than others, so some students are not able to enroll in their first choice.10 The public school network is complemented by a private system, although private school enrollment is low among poor students. Only 2.5 percent of favela inhabitants attend private schools, while 12.7 percent of other city inhabitants study in the private system (Neri (2010)).
About 36,000 teachers work in the municipal school system. All school employees are hired through public exams. Wages are the same across schools but vary with seniority and additional duties. Recently hired teachers are allowed to choose among open placements across different regions, but do not have control over the specific school within the chosen region. Mobility across schools between years depends on seniority. After three years working in the system, employees can apply to transfer to another school. Conversations with professionals suggest that some teachers do move away from violent areas between school years. Within years, however, it is not possible to transfer and teachers can only respond to episodes of violence with absenteeism and attrition.
Figure 1 shows that schools are widely distributed across the city. This feature, along with the fact that 98% of the children of school age living in the city attend school in Rio de Janeiro, indicates that school coverage is not a main concern in the city. However, school quality is highly variable. An assessment made by the Municipal Secretariat of Education in 2009 showed that 15% of students (28,000) at the 4th, 5th, and 6th grades were actually functionally illiterate (Prefeitura (2009)). In addition, inequalities across the city are still
10
persistent. Neri (2010) shows that favela inhabitants spend 1 hour and 15 minutes less per week in school compared to other city inhabitants, due to a combination of higher dropout rates, lower school load and higher absenteeism.
II. Data
A. Data on Violence
Understanding the consequences of Rio de Janeiro’s armed conflicts requires detailed information on where and when conflicts take place. This is necessary because exposure to violence varies between and within neighborhoods. Official crime data, which is provided by Instituto the Seguran¸ca P´ublica (ISP), does not provide sufficiently fine grained information on differences in violence because it records information gathered by police stations, which are not evenly distributed across space. In addition, ISP does not track information on when and where conflicts happen. Instead, they track only on homicides, which is a noisy outcome of these conflicts. To overcome the lack of finer data available from the police, we build a novel dataset based on anonymous reports to Disque-Den´uncia, a crime hotline open to the public for the reporting of any problems associated with security or public order which require government intervention.
Disque-Den´uncia (DD), an NGO created in 1995, sits inside the Police Authority of the State of Rio de Janeiro. The calls received by the hotline are directly forwarded to Civil and Military police, who decide whether and how to respond to each report. All the reports are anonymous and are neither recorded nor tracked. DD works 24 hours a day, 7 days a week and its phone number is broadly disseminated across the city (e.g. on supermarket bags and bus advertisments).
how the dataset was built.
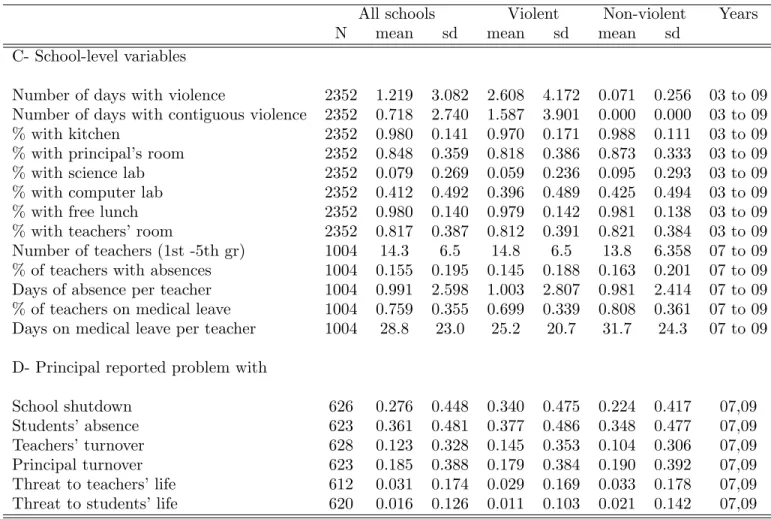
Table 1 provides descriptive statistics for the reports about armed conflicts. There were 4,365 reports registered as ‘gunfights between drug gangs’ from January 1st, 2003 to De-cember 31st, 2009. However, the analysis of the database showed that 523 reports do not describe a gunfight, which led us to exclude them from our analysis.11 In addition, we exclude an additional 315 reports that we were not able to associate with a specific favela, leading to a final sample of 3,527 reports.12
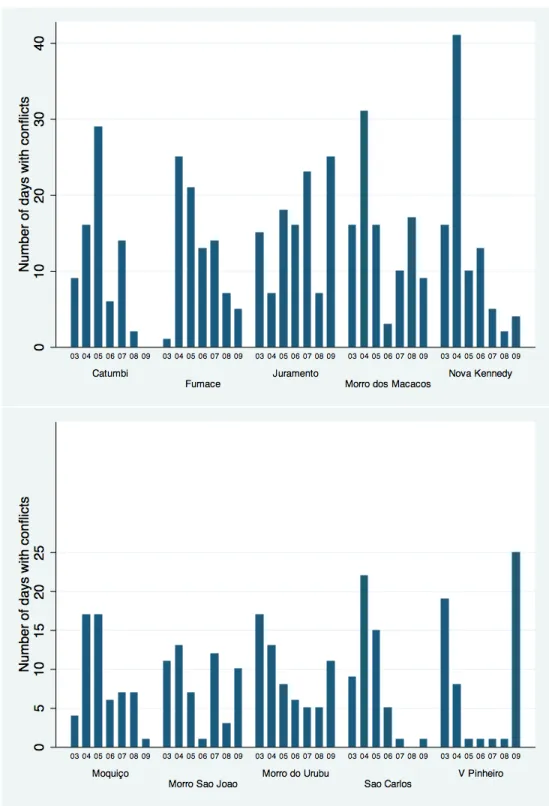
Although 92% of the reports of drug related violence occur in favelas, not all favelas are exposed to conflicts. Table 1 shows that just over one-third of the favelas (338 out of 979) experienced at least one conflict between 2003 and 2009 according to Disque-Den´uncia. We refer to this group as “violent favelas”. We see that the average number of reports in violent favelas is 1.5 per year or a total of 10 reports between 2003 and 2009. In our analysis we use the number of days with conflicts in each favela rather than the total number of reports because one person may call several times in the same day to report the same conflict. The mean value of this variable in violent favelas is 1.2 per year and the standard deviation is 3. The dynamics of these events in the ten most violent favelas are displayed in Figure 2. This figure demonstrates that violence peaks in different years depending on the favela. Figure 3 presents a map with the distribution of the total number of days with reports between 2003 and 2009 across favelas. We observe that conflicts are widespread across the city.
B. Educational Data
In order to determine the impact of drug-related violence on education, we use three educational databases that provide information at the level of the student, the school, and the teacher. Our main outcome variable is student scores on Prova Brasil, a national standardized exam given to all fifth graders in 2005, 2007 and 2009.13 All students from public schools with more than 30 students enrolled in the fifth grade in 2005, or more than 20 in 2007 and 2009, were required to take this exam. The exam has two portions: math and language (Portuguese) skills. In addition, students respond to a survey about their
11
The reports that were excluded mention the threat of conflicts among drug gangs, the location of drug dealers, or else they complement previously reported information. They are excluded because they do not mention that an armed conflict took place on the specific date.
12
We were not able to localize the other 315 reports because they do not provide a specific address, or they mention a street that is not inside a favela or close to a favela border.
13
socioeconomic profile, and teachers and principals provide information on their experience and school conditions. In 2007 and 2009, the principals answered specific questions about school problems, which we use to understand how violence affects school routine. The Prova Brasil micro-data set is provided by Instituto Anisio Teixeira (INEP).
Panel A of Table 2 provides summary statistics for fifth graders who take the Prova Brasil exam. Our benchmark sample is comprised of 76,131 students from 336 elementary schools that participated in at least two Prova Brasil editions between 2005 and 2009, and are located within 250 meters from a favela. We include the full sample of schools, which consists of all the 736 schools of the municipal system that participated in at least two Prova Brasil editions, in the heterogeneity analysis and in robustness checks. 47% of the municipal schools are within 250 meters of at least one favela, while 73% are within 500 meters. Table 2 shows school averages for the whole sample, and separately for schools exposed to and not exposed to violence. We define the schools exposed to violence as those located within 250 meters of favelas that experienced two or more days of conflicts during the academic years (March-November) in any year between 2003 and 2009. This definition of exposure to violence is fully detailed in section III. According to this definition, violence affects 45 percent of the schools in our sample (152 schools). The data indicates that there are marked differences between schools exposed to and schools not exposed to violence. The former has significantly lower Prova Brasil scores. However, it is not clear whether the worse performance is attributable to violence, since students from households of low socioeconomic status (students with illiterate mothers, non-white, and students who have previously repeated a grade or dropped out school) are over-represented in schools exposed to violence.
between academic years, which includes students who change schools and students who drop out. This number, however, is inflated by the fact that only a small share of schools provide the 6th or later grades. Thus, fifth graders usually change schools by the end of the academic year. Student mobility declines to 7 percent within the academic year. The difference between the percentage of students leaving and entering schools suggest that the dropout rate (or attrition, more generally) is around 10 percent between academic years, and 4 percent within years. Schools exposed to violence have higher mobility rates than schools not exposed to violence. Panel B also indicates that each school enrolls an average of 800 students over the year, though enrollment in schools exposed to violence is higher, which may reflect high population density in areas surrounded by favelas. Interestingly, schools exposed to violence also have a higher proportion of students who study near their homes, which indicates that proximity to their households can be an important reason why parents choose to enroll their children in these low-performing schools.
The SME also provides administrative records of teachers’ absenteeism and medical leaves from 2007 though 2009, allowing us to calculate absenteeism rates, both for unexcused absences and for medical leaves. Panel C of Table 2 indicates that 16 percent of the teachers were absent from work at least one day during the academic year. Interestingly, this rate is lower for schools exposed to violence. We use the Educational Census (INEP) to obtain information on school infrastructure from 2003 and 2009. The data indicate that almost all schools provide free lunch, while only 41 percent have a computer lab, and 10 percent have a science lab. We observe that schools exposed to violence are usually those with worse infrastructure. Finally, Panel D of Table 2 reports some stylized facts from a survey answered by the principals in the 2007 and 2009 Prova Brasil editions. This survey investigates several aspects of the school routine, including a long list of problems faced by the administration.
C. Other Data
favela, we use a list with the favelas’ alternative names computed by IPP. The IPP also provides shape files with municipal schools’ locations, and we used GIS tools to calculate the distances from favelas’ borders to schools.
We also collect information on favela and neighborhood socio-geographic characteristics in order to conduct robustness checks and understand the cross-section determinants of conflicts. We show this analysis in Appendix C. We gathered from IPP income per capita, Gini index, and population, calculated at neighborhood level based on the 2000 IBGE Census, as well as shape files with Rio de Janeiro’s main roads and neighborhood limits. We also obtained information on the favela areas for 1999 and 2004. The NASA website provided gridpoint information on Rio de Janeiro’s elevation, which allowed us to calculate favela steepness.
III. Empirical Model
In this paper we analyze highly localized but extremely violent events of armed conflict within the city. Once a conflict is triggered, safety concerns and threats to individuals’ lives dramatically increase in the conflict’s location. In this setting, we expect two main potential connections between violence and our main outcome variable, student test scores. First, violence may impact the school’s human resources, for example, by increasing teacher attrition and absenteeism, by causing interruption of classes and school closing, or by increasing workplace stress and principal turnover. Second, exposure to violence may directly affect student learning through mental health and psychological impacts. We discuss these two channels in section III.A, both to provide the conceptual underpinnings from which we develop our empirical strategy (section III.B) and to help identify the potential caveats (section III.C).
A. Conceptual Discussion
will suffer as classes are taught sporadically or discontinued. We also hypothesize that violence may have disruptive effects on school routine and management. As supported by several reports in the media, extreme events of gang conflicts can affect the school routine by causing temporary school closings and interruption of classes. Additionally, principal turnover may also rise since managing a school in an area with high conflict is likely to be difficult as well as risky.
The consequences of exposure to violence may extend beyond the school supply channel. Research conducted by psychologists and psychiatrists has recognized the potential harmful effects of neighborhood violence on children’s mental health. Fowler et al. (2009)’s meta analysis even suggests that children exposed to community violence are at a greater risk for developing post-traumatic stress disorder (PTSD) symptoms.14 In addition to PTSD, exposure to violence can also be associated with depression and anxiety in young children (Buckner et al. (2004); Fitzpatrick (1993)).15 Research contrasting subtypes of violence
suggests that the effect of exposure to violence on negative outcomes may increase with the children’s physical proximity to the violent events (Nader et al. (1990); Fitzpatrick (1993)). Family support appears to attenuate the consequences of exposure to violence on children.16 Yet, parents who have been traumatized are also more likely to have children who feel unsafe or who develop PTSD symptoms (Linares and Cloitre (2004)). In this case, parents could transmit the consequences of the violent events to their children.
It is important to note that if families make decisions after observed changes to school inputs, parents might increase investments in their children’s human capital in order to compensate for the unexpected cost of violence. First, parents’ investment may moderate mental health consequences. Second, parents may also change their input decision rule in education, for instance, spending more time teaching their children at home, or even transferring them to a more distant public or private school. In this case, student attrition
14
This body of research usually refers to exposure to community violence as parent or child reports of victimization, witnessing, and hearing about violence experienced by youths outside of their homes. As defined in Fowler et al. [2009, p.229], victimization by community violence refers to having been the object of intentional acts initiated by another person to cause harm, which include being chased, threatened, robbed, beaten up, shot, stabbed, or otherwise assaulted; witnessing refers to eye-witnessing an event that involves loss of property, threat of physical injury, actual injury, or death; hearing about community violence is learning of another person’s victimization by neighborhood violence.
15
This is consistent with two different, but not competing, views. First, younger children lack the mature coping skills that could prevent the development of internalizing problems (Farver et al. (2005)). Second, though older chil-dren may develop initial internalizing symptoms in reaction to new or unusual exposure to violence, their symptoms might be expected to abate if they are continuously exposed to community violence over time. In this case they may become desensitized and suppress feelings of sadness or anxiety (Farrell and Bruce (1997); Fitzpatrick (1993)
16
and absenteeism are also potential outcomes of exposure to violence.
Although there are a number of paths connecting local violence and childrens’ learn-ing, there is no causal estimate available in the literature that unequivocally attributes a negative effect on student achievement to violence. The existing results in the research conducted by psychologists and psychiatrists have limitations, as identified by psychiatrist Osofsky (1999) (cited in Aizer (2007)). One important shortcoming relates to the fact that neighborhood violence is generally correlated with other types of socioeconomic disadvan-tage (poverty, parental education, domestic violence), which, in turn, has been shown to have negative impacts on children’s education. Thus, since the literature has not been able to disentangle violence from other detrimental confounding factors, the existing estimates possibly overstate the impact of violence on test scores (Aizer (2007)). Another limitation arises from the difficulty defining or characterizing neighborhood violence, which leads to measurement error. Both of these shortcomings - omitted variables and measurement error - are also concerns in previous studies in economics, as recognized by their authors (see, for instance, Grogger (1997), Severnini and Firpo (2009), and Aizer (2007)).
B. Empirical Strategy
This section describes how we explore our data to avoid identification problems found in previous research and achieve a causal estimate of the effect of exposure to violence on learning. The modeling of the production function for cognitive achievement is often based on the idea that a child development is a cumulative process, dependent on the history of family and school inputs as well as on innate ability (Todd and Wolpin (2003)). In this paper, we do not attempt to estimate a tightly specified education production function given that we do not observe past inputs and test scores. Instead, we propose a reduced-form strategy which rely on the evidence that variation in conflicts within favelas over time is orthogonal to any other past and contemporaneous latent determinants of learning. We estimate the following equation.
Aist=βVst+µs+γt+Z
′
istα+X
′
stψ+εist
(1)
where Aist is the learning outcome of student i, enrolled in the 5th grade at school s, in
Portuguese, available in the 2005, 2007 and 2009 Prova Brasil editions. The variable of interest is Vst, a dummy that indicates whether the school s is exposed to violent events
throughout the academic year in yeart. More precisely, we define this variable as
Vst = 1 if X
j
✶{Dsj < B}ϑjt ≥n, and 0 otherwise
(2)
Whereϑjtis the number of days with a recorded report of gang conflict in favelaj
through-out the academic yeart. In our benchmark specification, this period includes the months between March through November (the month in which the Prova Brasil exam is taken). The term✶{Dsj< B}is a function that indicates whether the linear distanceDsj between
the schoolsand the favelaj’s border is smaller thanB meters. Our benchmark specifica-tion sets the bufferB = 250, at which value the variableVstcaptures only the conflicts that
take place near the school, i.e., in favelas located up to 250 meters from the school. The benchmark specification also setsn= 2. In this case, the variableVst captures whether the
school experienced two or more days of violence withinB= 250 meters of distance during the school period. By defining n = 2, we exclude isolated shootings that may add noise to our analysis. Formula (2) is a straightforward and flexible way of measuring violence. We can easily compute this variable at different values for the parametersB andn, which enables us to better characterize the violence effect (by distanceB and intensityn) and to perform robustness checks.
betweendrug gangs.17 Given that our analysis does not take into account the cross-sectional
variation in violence and the impact of being under the rule of drug dealers for extended periods, one might reasonably interpret our estimates as a lower bound for the impact of drug-related violence on student achievement.
The term Zist includes student socioeconomic characteristics in order to absorb within-school heterogeneity and limit potential selection bias in the pool of students taking the Prova Brasil exam. Here we include students’ gender, race, mother’s education, age fixed effects, and dummy variables for whether the child has ever repeated a grade or dropped out in previous years. The termXst indicates a set of variables that absorb confounding effects
driven by within-school heterogeneity in classroom size and composition (which includes the number of students and the averages for the students’ socioeconomic characteristics mentioned above), as well as by differential school physical infrastructure (we add dummy variables for whether the school has a computer lab, science lab, principal’s office, teachers’ offices, free lunch, and a kitchen).
We focus on young children (5th graders) in order to avoid potential endogeneity driven by reverse causality - lower school quality may lead to children to become involved in drug trafficking and to higher violence. Our benchmark sample includes only the students enrolled in schools located within 250 meters from at least one favela, which retains 336 schools, or 45% of the total number of municipal schools that participated in at least two Prova Brasil editions. This restriction generates more comparable treatment and control groups because it accounts for the fact that schools near favelas are possibly exposed to higher levels of chronic violence, and typically have more students from disadvantaged households. We nevertheless confirm that our results are robust to sample selection.
Identification relies on the assumption that, conditional upon school and time fixed effects, as well as on students, and school observed characteristics, unexpected and severe conflicts between drug gangs within favelas are uncorrelated with any latent determinant of children’s education. If this assumption holds, we are able to identify the causal impact of violence on student achievement given that our variable of interestVstshould be orthogonal
to the error termεistin equation (1). In all specifications at the student level, we use robust
standard errors clustered by school, the level at which we measure violence. The coefficient
17
of interestβcaptures a reduced-form effect, which includes the impacts transmitted through all the main potential channels likely to be at work in our setting (as discussed in section III.A). Though it is not possible to disentangle the relative importance of each potential mechanism, we provide suggestive evidence regarding the importance of the school supply channel. We are also able to identify whether the parents respond to the conflicts in terms of student mobility and absenteeism. In the following section we discuss additional strategies and some stylized facts that help us validate our empirical strategy.
C. Validating the Empirical Strategy
A first potential problem to be considered in our analysis concerns student selection at the Prova Brasil exam. In our setting, students are not constrained to study at schools near their homes. Parents’ choices may therefore lead to students’ attrition. In particular, if high-performing students move from a school exposed to violence towards another located in a non-exposed area, the estimated effect of violence on achievement at the end of the year may capture the worsening of the pool of students, and not the causal impact of violence on learning.
We perform two tests for selection. First, we explore the SME administrative records on student enrollment. Given that we can follow a student’s enrollment over time and across schools, we can fully identify all her movements within the system (transfers between schools) or out of the system (if her enrollment number disappears from the records). We are therefore able to examine whether violence impacts student mobility and dropout. Second, we also test selection at the Prova Brasil exam by examining whether socioeconomic characteristics of the students who take the exam are correlated with the violence during the academic year, after conditioning on school and year fixed effects. We find that the within-school variation in violence is orthogonal to mobility and other determinants of student achievement, which suggests that our estimates are not biased by self-selection of students into or out of a particular school.
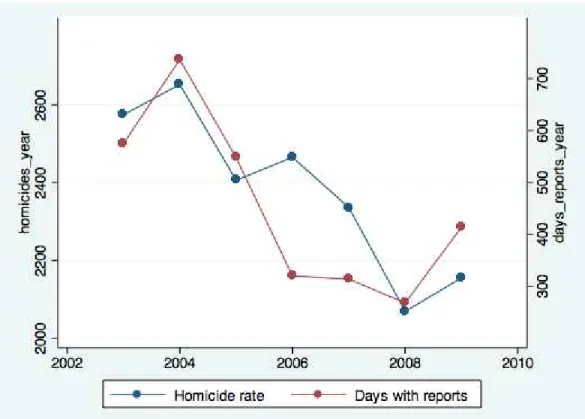
remarkably similar. In addition, we aggregate our reports into 18 major regions of the city for which homicide data is available. We plot the relationship between the homicide rate and the number of days with reports by region, separately for each year, and observe that the regional propensity to over- or under-report is constant over time. These tests are detailed in Appendix C. For the interested reader, we also present in Appendix C a comparison between the frequency of DD reports, by favela and year, with newspapers coverage of the conflicts. We find that the DD reports provide a much more complete picture about the conflicts than the media does.
Finally, Appendix D presents a further characterization of the conflict dynamics based on DD data by examining their socio-demographic determinants and their time-series proper-ties. We first show that the cross-sectional variation in conflicts at the favela level correlates only with specific geographic features, such as the favela’s steepness and size. More impor-tant to our analysis, factors that are usually associated with crime, such as income levels and inequality, do not explain variation in violence. Second, panel data extensions of the Dickey-Fuller unit root tests reject the null that the conflicts are non-stationary at the favela-month level over the period we analyze. Finally, estimates of partial autocorrelation functions provide evidence that the conflicts follow either a very weak AR(1) or a white noise process at the favela-month level. These time-series properties eliminate any concern related to the presence of a spurious correlation driven by non-observable trends or breaks in the data.
IV. Results
A. Impact on Student Achievement
the school experienced two or more days of violence during the school period within a radius of 250 meters of the school.
In Panel A, column 1 shows that there is a significant negative correlation between vi-olence and math achievement, though this result is conditioned only on year fixed effects. When we move from column 1 to column 2, in which specification we include cross-section controls, the point estimate declines only slightly. This result indicates that the hetero-geneity in students, classroom and school characteristics plays a limited role in generating the observed correlation between violence and math achievement. Column 3 reports our within-school estimates. Within-group estimators used to control for fixed effects may iso-late omitted variable bias, but they also typically remove much of the useful information in the variable of interest. In our case, deviations from means eliminate cross sectional varia-tion in violence levels. As we move from column 2 to column 3, the correlavaria-tion indeed drops in magnitude, but nevertheless remains statistically significant at the 5% level. Clustering standard errors one-level-up, allowing for unrestricted residual correlation within neigh-borhoods, provides similar results (standard errors drop marginally from 0.027 to 0.025). As we discuss in Section III, this effect can be regarded as causal since, conditional upon time and school fixed effects, the remaining variation in the variable of interest is plau-sibly idiosyncratic. In the following sections we strengthen the evidence by showing that our results are neither driven by student selection, nor by different ways of restricting the sample or defining the variable of interest.
of violence is equivalent to 1/4 to 1/2 of the drop in test scores associated with a one standard deviation decrease in teacher quality, as documented in the related literature (Rivkin et al. (2005), Rockoff (2004)).
In the following sections we further characterize the violence effect on achievement and present robustness tests. Given the results in Panel B, the remainder of the paper focuses on achievement in math. First, we examine whether the effect of violence varies with the distance between the school and the conflict location. In Section IV.C we test whether the effect of violence is sensitive to the conflict intensity and length. In section IV.D we study the specific timing of the effect of violence. Section IV.E explores heterogeneity in the effect by student characteristics. Finally, section IV.F examines the effect of violence on students’ mobility among schools within the school year, and between years, and tests for the presence of selection bias in student composition at the Prova Brasil exam. Throughout these sections we provide evidence that, irrespective of how we measure violence or restrict the sample, we detect a negative and statistically significant impact of violence on student achievement. We also rule out selection bias in different ways.
B. Distance to Favelas and Sample Selection
In this section we examine how the relationship between violence and student achieve-ment varies with the distance between the school and the conflict location. In the first column of Table 4 we report a regression that includes only schools located in favelas. The variable of interest considers only the conflicts in the favela where the school is located. In this case, the control group includes only the schools located in favelas, but not exposed to gang conflicts. In the following column we expand the sample to include only schools located within a radius of 100 meters from a favela, while the variable of interest considers only the violence in favelas within a radius of 100 meters from the school. We continue expanding this buffer in the following 4 columns, until we reach the violence that occurs in favelas within 450 meters of the school, for those schools situated within 450 meters from a favela. We observe that violence has a very local impact.18 In column 1, which focuses only on schools located in favelas, despite the small sample, we find a higher coefficient (0.130), significant at 5%. The coefficient drops as we move to the second column, but increases again and is robust at 5% level in the 200 and 250 meters specifications.19 We
18
As reference point, the standard city block in Manhattan is about 80 by 270 meters
19
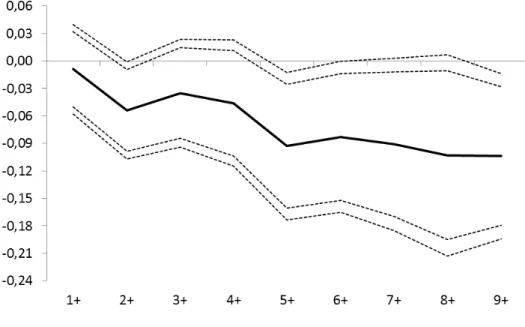
observe in the remainder columns that the point estimate tends to decreases as the buffers continue to increase. Figure 4 complements Table 4 by plotting the coefficients of ten different regressions of student achievement on the violence indicator, each computed for a distinct buffer of distance from the school to the conflict location. Figure 4 confirms that violence mainly affects students from schools located within 250 meters from the violence epicenter.
Finally, the last column of Table 4 presents a different test by including simultaneously three indicators of violence. These variables compute, respectively, (i) the violence that occurred in the favela where the school is located (if the school is located in a favela); (ii) the violence that occurred in favelas within 250 meters or (ii) 500 meters of distance from the school. The sample includes schools within 500 meters from a favela. Since these indicators are not mutually exclusive, they capture the differential effects of violence on learning as we increase the distance of the school to the conflict location. Column 7 indicates that students from schools located within 250 meters from favelas exposed to conflicts have an average score 0.067 standard-deviations lower than students from schools which are between 250 and 500 meters from favelas with conflicts. It also indicates that students from schools inside and in the border of favelas (up to 250m distance) are equally affected by violence, while students from schools located farther than 250 meters are not affected.
C. Intensity
Our benchmark measure of violence is a dummy variable that indicates whether the school experienced two or more days of conflict during a certain span of time (the academic period), and within a certain distance from the school (the buffer of 250 meters is the benchmark). In this section we further characterize the relationship between violence and achievement by varying the number of days with conflict during the academic year, within the benchmark buffer of 250 meters. In other words, we test whether violence impacts vary with conflict intensity by assuming that violence intensity increases with the number of days of conflict.
To accomplish this, we perform two tests. First, we compute a series of violence indicators by varyingnin equation (2), the number of days of conflict during the school period, that occur within a radius of B = 250 meters from the school. The first column of Table 5
presents the effect of violence on math achievement, where the violence indicator is defined for n ≥ 1. The second column presents our benchmark result, where n ≥ 2. Columns 3 and 4 show the results for n ≥ 7 and n ≥ 9, respectively. As shown in these four regressions, the effect of violence on student achievement increases with violence intensity. In column 1 we observe that the effect on achievement of one or more days of conflict is not statistically different from zero. The second column presents our benchmark estimate. Columns 3 and 4 show that the impact doubles when we consider 7 and 9 or more days of conflict, respectively. Figure 5 complements Table 5 by plotting the coefficients of nine different regressions of student achievement on the violence indicator, each computed for a distinctn∈(1,9). We see a clear negative relationship between the effect of violence and violence intensity, captured byn. We also observe that the confidence intervals around the estimated coefficients (at 5% and 10%) tend to increase withn, which is a consequence of the small number of very intense conflicts used to detect the effect of violence for larger values ofn.
We also perform a second test, in which the violence indicator is calculated in two alternative ways. In column 5 of Table 5, the variable of interest indicates whether the school experienced two or more days of conflict within 14 contiguous days during the school period. In column 6, conversely, the variable of interest indicates whether the school was exposed to two or more days of conflict within the school period, but more than 14 days apart. We assume that two or more days of conflict within a lengthy but not large span of time indicates that the conflict has continued over time and, for this reason, can be regarded as a more disruptive event. Though the coefficients are not significantly different, the comparison of the results in columns 5 and 6 is supportive of the view that the effect of long-lasting conflicts is higher than the impact of episodes of violence sporadically distributed over the school period.20
D. Timing
Another important aspect of the effect of violence on student achievement is the specific timing of the impacts. The question of timing has at least two relevant dimensions: (i) the extent to which student achievement by the end of the year varies with the moment of the violence shock during the school year and; (ii) the extent to which violence has either
20
persistent or transitory effects on learning.
In order to explore the timing of the effect of violence, we perform two tests. First, we break the computation of the violence indicator into three different periods of the calendar year: (i) the March through June period, the first school term; (ii) August through November, the second term and the months just before the Prova Brasil exam; and (iii) December through February, the vacation months that follows the exam. This procedure gives us three new indicators of violence, each of them for a specific period of the year.
The first column of Table 6 reports a regression of math achievement on these three indicators of violence. The coefficient for the the vacation period (December through February) provides a natural placebo test in within-group estimation. As expected, it indicates that the violence that occurs after the exam is not significantly associated with performanceat the exam. The other two coefficients in the first column are quantitatively more important, but only the effect associated with the second term, which immediately precedes the exam, is significantly different from zero (only at 10%). Overall, the point estimates suggest that the relevant timing of the events of violence corresponds to the months just before the exam, though the breaking of the violence indicator into three new variables adds noise to the estimation and does not allow us to reject the null hypothesis that they are statistically equal.
In the remaining columns of Table 6, we complement the analysis by exploring the relationship between achievement and our benchmark measure of violence, but computed either for the previous or the following school year. Column 2 reports the regression of achievement on the violence computed in the following year. As expected in this alternative placebo test, we observe no association between violence during the following academic year and performance in the current year.21
In the third column of Table 6 we regress student achievement on the violence that occurred in the previous school year. Since learning is a cumulative process, this regression tests whether violence has any persistent effect on student achievement. As a result, we find no significant association between achievement and past violence. This result is consistent with other studies that also find that treatment effects on test scores fade away rapidly (see Kane and Satiger (2008), Jacob et al. (2010), Rothstein (2010), Banerjee et al. (2007), Andrabi et al. (2011), Herrmann and Rockoff (2010)). The interpretation that the
21
effect of violence is only transitory, however, should be taken with caution. First, test score impacts of educational interventions often fade out over time even when its effects on knowledge does not (Cascio and Staiger (2012)). Second, even if test scores effects fade, it is possible that there are lasting effects on personality skills such as through the deterioration of externalizing behaviors and future academic motivation (see Heckman et al. (Forthcoming)).
E. Heterogeneity
Table 7 examines heterogeneity in the effect of violence by students’ socioeconomic char-acteristics. We split the data by student gender, race and age, by level of mother’s educa-tion, and by the indicators of whether the student has ever repeated a grade or dropped out. The first two columns of Table 7 show that the coefficient for girls’ achievement is more negative than that for boys. In columns 3 and 4 we find a larger coefficient in abso-lute value for white students, roughly twofold that estimated for non-whites. Columns 5 and 6 show that the coefficient is larger for students with highly educated mothers. The coefficients by age are similar in columns 7 and 8, though slightly larger for younger stu-dents (aged 11 or less, i.e., at correct age for 5th grade). Columns 9 and 10 show that the coefficient for students who have never repeated a grade is larger. In columns 11 and 12 we find a larger coefficient for those students who have dropped out before.
F. Student Mobility and Selection
In this setting, students are not constrained to study at schools near their homes. A major concern regarding our empirical strategy, therefore, is student selection. The observed correlation between violence and student achievement may be spurious if violence is also associated with student mobility. In particular, if high-performing students move from a school exposed to violence towards another located in a less violent area, the estimated effect of violence on achievement at the end of the year may be capturing the worsening of the pool of students, rather than a causal impact of violence on achievement.
In order to examine whether violence impacts student mobility across schools, we explore the SME administrative records on students enrollment. Given that we can follow the student enrollment number over time and across schools, we are able to fully identify all her movements within the system (transfers between schools) or out of the system (if the student enrollment number disappears from the records).
Table 8 presents regressions at the student-year level that explore the relationship be-tween violence and student mobility. All columns follow a within-school specification which controls for students characteristics, grade, year and school fixed effects. To make these regressions comparable to our previous results, we restrict the sample to schools located within 250 meters of at least one favela, while the variable of interest considers only the episodes of violence that occur in favelas within a radius of 250 meters of the school. Panel A considers all students enrolled in the 1st through 5th grades, and Panel B includes only the 5th graders. The sample covers the 2003 through 2009 period.
consistent with the evidence provided in section IV.D, which suggests that the effect of temporary episodes of violence on learning is not persistent.
We complement this analysis by testing for student selection at the Prova Brasil exam. We regress the socioeconomic characteristics of the students who take the exam on the violence during the school year. The first column of Table 9 follows our benchmark spec-ification, in which we regress on violence a dummy variable indicating gender equal to male. We see that the violence during the school year is not significantly associated with a higher probability of observing a male in the pool of students taking the exam by the end of the year. In the following columns, we repeat the same specification, but for other binary dependent variables - race (non white), age (12 or more), mother’s education (low), ever repeated, and ever dropped out in previous years. In any of these regressions we find systematic association between violence and student selection.22
V. The Impact on School Supply
Throughout the previous sections we followed a reduced-form strategy in order to identify and characterize an average effect of violence on test scores. This effect can be driven by a variety of channels likely to be at work in our setting. Since we are able to observe teacher and principal behavior, the final section of this paper focuses on the identification of specific mechanisms linking violence and school supply.23
A. Teacher Absenteeism
There are many mechanisms through which teacher absenteeism and attrition may re-duce student achievement (see Miller et al. (2007)). It may rere-duce instructional intensity, create discontinuities of instruction and disruption of regular routines and procedures of the classroom. It may also undermine common planning time, which can inhibit attempts by school faculties to implement practices across classrooms and grades. Consistent with this view, many studies have found a negative relationship between teacher absenteeism, turnover, and student achievement (Miller et al. (2007), Clotfelter et al. (2007), Ronfeldt et al. (2013)).
22
The number of observations varies across the columns because of missing values in the Prova Brasil survey. In order to test whether this problem affects our results, we regressed, for each student characteristic, a dummy indicating missing value on the violence indicator. We find no association between missing observations and violence.
23
Table 10 examines teachers’ behavior in terms of absenteeism and medical leaves. We use three years of data (2007-2009) to evaluate violence effects on both the extensive (percentage of teachers) and the intensive margins (average number of days of absence). Column 1 indicates that in years with episodes of violence, teacher absences increase by 5.8 percentage points (38% of the sample mean). Panel B indicates that the effect is qualitatively similar for both contiguous and non-contiguous violence indicators, though only in the former is the coefficient statistically different from zero. Column 2 indicates that the contiguous violence is associated with an increase in absenteeism on the intensive margin. There is no evidence that violence affects medical leaves.
The results of Table 10 are qualitatively relevant since they link violence with a larger number of days without instructors in the classrooms. This result can be regarded as either a lower bound of the violence effect on absenteeism and/or teacher turnover. Unexcused absences are reported by the school’s principal and are subject to endogeneity since the principal may under-report absenteeism in response to violence and safety threats. In fact, long-lasting absences, which are generally followed by employment resignation, are likely to be better reported.24 Thus, the effect of violence on unexcused absences is a
combination of the impact on both short and lengthy absenteeism, where the latter is possibly a combination of absenteeism and of turnover.
Overall, these findings are consistent with the evidence that non-pecuniary factors and work environment characteristics are significant determinants of teacher transfers and re-tention (Hanushek et al. (2004), Boyd et al. (2005), Jackson (2009)). Table 10 provides new causal evidence in support of this link, and contributes to the literature by documenting the detrimental role played by neighborhood violence in local labor markets dynamics.
B. Impact on School Routine
In Table 11 we examine whether violence affects school routine. In this analysis, we rely on a survey answered by principals in the 2007 and 2009 Prova Brasil editions. This survey investigates multiple aspects of the school’s routine, including an extensive list of problems faced by the administration. We regress an indicator variable for whether the principal mentioned a given problem on the indicator for violence. The regressions include the full set of student and school controls, as well as school and year fixed effects.
Panel A of Table 11 indicates that, in schools exposed to violence, principals were 7.7
24
percentage points more likely to report that there was a threat to teachers’ lives, an effect equivalent to 40% of the sample mean. There is also evidence that violence impacts teacher turnover, which increases by 5 percentage points (13% of the average) in violent years according to principals’ reports, though this result is only marginally significant (p-value 0.14). Panel B examines differential impacts depending on whether violence is experienced in contiguous or non-contiguous days. Column 1 shows that principals are 24 percentage points more likely to report an interruption of classes (temporary school closing) in years with contiguous days of violence. This implies that schools are twice as likely to close temporarily in years with conflicts of long duration. This finding is consistent with several articles in Rio de Janeiro’s main newspapers which mention that schools temporarily shut down during the conflicts in order to avoid teachers and students being caught in the crossfire.
Also of interest, column 5 indicates that the administrative staff are more likely to turnover in years with contiguous violence. The schools that are exposed to this type of event are 12 percentage points more likely to have a principal that is less than two years on the job (a 31% increase in the sample mean). This finding is straightforward given the tremendous stress that principals face in managing schools during a conflict period.
Finally, we find no significant association between violence and student absenteeism, as also reported by the principals. It is possible that principals may not carefully track absenteeism in periods marked by interruption of classes or unusual stress. However, the result nevertheless suggests that student absenteeism does not increase in a noticeable way in years when conflicts take place.25
VI. Final Comments
This study provides evidence that drug-related conflicts have negative spillovers on the population living and working in conflict areas by demonstrating that violence affects both student achievement and education supply. Such episodes of violence have become a perva-sive problem in many parts of the World. However, there is only limited understanding on the causal effects of violence due to identification challenges. As acknowledged in previous research, violence typically correlates with poverty and other local economic conditions. Simple cross-section analysis is therefore subject to measurement error and omitted variable
25
bias. We circumvent this endogeneity by exploring variation over time in armed conflicts between drug gangs that are plausibly exogenous to local socioeconomic conditions.
We show that students from schools located close to conflict areas score 0.054 standard deviations less in violent years relative to their peers in the same schools in peaceful years. We also find that the violence effect increases with conflict intensity and duration, and when the conflict occurs in the months just before the exam. The effect rapidly decreases with the distance between the school and the conflict location. Thus, though substantially disruptive, the negative spillovers of episodes of violence on education seem geographically localized.
We are able to provide evidence for one mechanism through which violence affects student achievement; violence decreases instructional time and affects school human resources by increasing temporary school closing, principal turnover and teacher absenteeism. Interest-ingly, we find that students do not respond to these conflicts by leaving schools exposed to violence. Difficulty in predicting violence and evaluating alternatives may possibly explain this finding.
It is worth emphasizing that our analysis estimates the effect of exposure to extreme but temporary episodes of violence, and does not take into account the cross-sectional variation in violence and the impact of being under the rule of drug dealers for extended periods. Consequently, one might reasonably interpret our estimates as a lower bound for the impact of drug-related violence on student achievement. The fact that the magnitude of this lower bound is quantitatively important supports the view that the costs of drug-related violence may go far beyond the casualties of those directly involved in the criminal activity and its victims. In this case, violence spillovers should be regarded as a relevant policy concern in conflict areas.
References
A. Aizer. Neighborhood Violence and Urban Youth. In The Problems of Disadvantaged Youth: An Economic Perspective, pages 275–307. University of Chicago Press, Chicago, April 2007. URL http://www.nber.org/chapters/c0598.
Accounting for Learning Dynamics. American Economic Journal: Applied Economics, 3(3):29–54, July 2011.
Abhijit V. Banerjee, Shawn Cole, Esther Duflo, and Leigh Linden. Remedying Educa-tion: Evidence from Two Randomized Experiments in India. The Quarterly Journal of Economics, 122(3):1235–1264, 2007.
M. Baptista, M.C.S. Minayo, M.T.C. Aquino, E.R. Souza, and S.G. Assis. Estudo Global sobre o Mercado Ilegal de Drogas no Rio de Janeiro. Relat´orio de Pesquisa. NEPAD/Claves, Rio de Janeiro, 2000.
T. Besley and H. Mueller. Estimating the Peace Dividend: The Impact of Violence on House Prices in Northern Ireland. American Economic Review, 102(2), 2012.
Donald Boyd, Hamilton Lankford, Susanna Loeb, and James Wyckoff. The Draw of Home: How Teachers’ Preferences for Proximity Disadvantage Urban Schools. Journal of Policy Analysis and Management, 24(1):113–132, 2005.
J.C. Buckner, W.R. Beardslee, and E.L. Bassuk. Exposure to Violence and Low-Income Children’s Mental Health: Direct, Moderated, and Mediated Relations. American Jour-nal of Orthopsychiatry, 74(4):413–423, 2004.
I. Cano and C. Ioot. Seis por Meia D´uzia? Um estudo explorat´orio do fenˆomeno das chamadas ‘mil´ıcias’ no Rio de Janeiro. In Seguran¸ca, Tr´afico e Mil´ıcias no Rio de Janeiro, pages 48–103. Funda¸c˜ao Heinrich B¨oll, Rio de Janeiro, 2008.
Elizabeth U Cascio and Douglas O Staiger. Knowledge, Tests, and Fadeout in Educational Interventions. NBER, 18038, 2012.
R. Chamarbagwala and H.E. Morn. The Human Capital Consequences of Civil War: Evidence from Guatemala. Journal of Development Economics, 94(1):41 – 61, 2011. Charles T Clotfelter, Helen F Ladd, and Jacob L Vigdor. Are Teacher Absences worth
Worrying about in the US? NBER Working Paper, 13648, 2007.
M. Costa, M. Koslinski, L.C.Q. Ribeiro, and F. Alves. Quase-mercado Escolar em Contexto de Proximidade Espacial e Distˆancia Social: O Caso do Rio de Janeiro. 2010.