Connectivity and Dispersal Patterns of
Protected Biogenic Reefs: Implications for the
Conservation of
Modiolus modiolus
(L.) in the
Irish Sea
Kate Gormley1, Clara Mackenzie1, Peter Robins5, Ilaria Coscia2, Andrew Cassidy3, Jenny James1, Angela Hull4, Stuart Piertney6, William Sanderson1, Joanne Porter1*
1School of Life Sciences, Heriot-Watt University, Riccarton, Edinburgh, EH14 4AS,2Laboratory of Biodiversity and Evolutionary Genomics, University of Leuven, Ch. Deberiotstraat, 32, 3000 Leuven, Belgium,3Medical Research Institute, University of Dundee, Human Genetics Unit, Ninewells Hospital and Medical School, Dundee, DD1 9SY,4School of the Built Environment, Heriot-Watt University, Riccarton, Edinburgh, EH14 4AS,5School of Ocean Sciences, Bangor University, Menai Bridge, LL59 5AB,6The Institute of Biological and Environmental Sciences, Zoology Building, Tillydrone Avenue, Aberdeen, AB24 2TZ
*J.S.Porter@hw.ac.uk
Abstract
Biogenic reefs created byModiolus modiolus(Linnaeus, 1758) (horse mussel reefs) are
marine habitats which support high levels of species biodiversity and provide valuable eco-system services. Currently,M.modiolusreefs are listed as a threatened and/or declining
species and habitat in all OSPAR regions and thus are highlighted as a conservation priority under the EU Marine Strategy Framework Directive (MSFD). Determining patterns of larval dispersal and genetic connectivity of remaining horse mussel populations can inform man-agement efforts and is a critical component of effective marine spatial planning (MSP). Lar-val dispersal patterns and genetic structure were determined for severalM.modiolusbed
populations in the Irish Sea including those in Wales (North Pen Llŷn), Isle of Man (Point of Ayre) and Northern Ireland (Ards Peninsula and Strangford Lough). Simulations of larval dispersal suggested extant connectivity between populations within the Irish Sea. Results from the genetic analysis carried out using newly developed microsatellite DNA markers were consistent with those of the biophysical model. Results indicated moderately signifi-cant differentiation between the Northern Ireland populations and those in the Isle of Man and Wales. Simulations of larval dispersal over a 30 day pelagic larval duration (PLD) sug-gest that connectivity over a spatial scale of 150km is possible between some source and sink populations. However, it appears unlikely that larvae from Northern Ireland will connect directly with sites on the Llŷn or Isle of Man. It also appears unlikely that larvae from the Llŷn connect directly to any of the other sites. Taken together the data establishes a baseline for underpinning management and conservation of these important and threatened marine habitats in the southern part of the known range.
OPEN ACCESS
Citation:Gormley K, Mackenzie C, Robins P, Coscia I, Cassidy A, James J, et al. (2015) Connectivity and Dispersal Patterns of Protected Biogenic Reefs: Implications for the Conservation ofModiolus modiolus(L.) in the Irish Sea. PLoS ONE 10(12):
e0143337. doi:10.1371/journal.pone.0143337
Editor:Tzen-Yuh Chiang, National Cheng-Kung University, TAIWAN
Received:September 1, 2015
Accepted:November 3, 2015
Published:December 1, 2015
Copyright:© 2015 Gormley et al. This is an open access article distributed under the terms of the
Creative Commons Attribution License, which permits unrestricted use, distribution, and reproduction in any medium, provided the original author and source are credited.
Data Availability Statement:All relevant data are within the paper.
Introduction
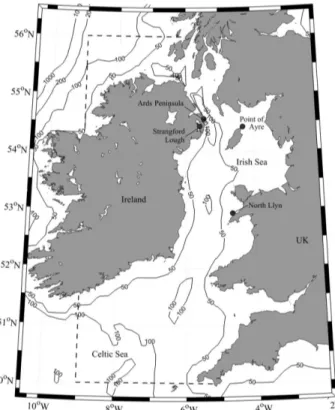
The marine bivalveModiolus modiolus(Linnaeus, 1758) (horse mussel) is an Arctic-Boreal species with a distribution that extends from the seas around Scandinavia and Iceland south-ward to the Bay of Biscay [1].M.modiolusreefs are considered a type of Annex I biogenic reef under the Habitats Directive (Council Directive 92/43/EEC on the conservation of natural hab-itats and of wild fauna and flora) [2]. These reefs are scarce and limited in their distribution in contrast to records of individuals and comprise dense continuous beds, or scattered aggrega-tions of this large mussel [2]. Existing data places the southern limit of these reefs in the Irish Sea [1] where well-documented locations include the Ards Peninsula and Strangford Lough (Northern Ireland), the Point of Ayre (Isle of Man), and the North Llŷn (Wales) [3] (Fig 1). Horse mussel reefs can build up as a result of accretion of shell and faecal deposits [4,5] and are typically characterized by high species diversity [6–8].
Decline in the spatial extent ofM.modiolusreefs has been reported across the European dis-tribution of the species [3]. In the Irish Sea, historical fishing activity such as scallop trawling and dredging has caused widespread, long-term damage to reefs including those situated around the Isle of Man and Northern Ireland [3]. Consequently,M.modiolusreefs are listed as a threatened and/or declining habitat in all OSPAR (Oslo-Paris Convention: The Convention for the Protection of the Marine Environment of the North-East Atlantic 1992) regions [9] and thus are a conservation priority under the EU Marine Strategy Framework Directive (MSFD) [10] since the connection has been made between“special habitats”(including OSPAR Priority Marine Habitats, PMHs; determined as“threatened and/or declining”under the OSPAR Con-vention 1992) and the achievement of Good Environmental Status (GES) [11]. It is therefore to be expected that more than half the horse mussel reefs in the Irish Sea are found in Marine Pro-tected Areas (Strangford Lough, Point of Ayre and North Llŷn).
Fig 1. A bathymetric map of the Irish Sea, showing the four sample sites (black circles) within the model domain (indicated by the dashed line).
doi:10.1371/journal.pone.0143337.g001 Competing Interests:The authors have declared
Conservation of species or biogenic habitats requires detailed knowledge about their demo-graphic structure and status; with genetic data contributing to this definition. This information may be of use in informing the successful maintenance of these populations through breeding programmes [12], restoration of habitats [13] and/or design and implementation of Marine Protected Areas (MPAs) or Regional Management Units [14]. In addition, a thorough under-standing of population connectivity has become a key requirement for determining and defin-ing threats to marine biodiversity and is crucial to the marine conservation and management process [15,16].
In the marine environment, population connectivity is principally driven by pelagic larval stages and is therefore directly influenced by oceanographic processes such as tidal currents, residual currents, and wind-driven currents [17]. However, patterns of dispersal of pelagic larvae remain poorly understood due to the difficulty of obtaining direct measurements of movement and behaviour of these propagules. This is especially problematic in the marine environment where sessile or sedentary species (such asM.modiolus) have a bipartite life cycle, periodically producing planktonic propagules that are virtually impossible to track over large distances [18] using currently available technologies [16]. Although in relatively constrained regions such as lagoons or coral reefs, intensive larval sampling can offer some model validation e.g. [19]. In light of these challenges, biophysical modelling (coupling hydrodynamic and particle tracking models) has emerged as a useful tool for simulating larval dispersal across time and space [20].
Marine Spatial Planning for Connectivity and Conservation
Currently, there is a requirement to establish an ecologically coherent network of protected areas (MPAs, Marine Conservation Zones, MCZs and Natura 2000 sites) under the UK Marine and Coastal Access Act 2009, the OSPAR Convention and the EU MSFD; and develop Ecosys-tem Based Management (EBM) tools [21]. One way in which population genetics complement ecological approaches to conservation is through the use of molecular techniques to supple-ment demographic and population studies [17]. For example, use of both genetic techniques and larval dispersal modelling in tandem is required to provide sufficient information regard-ing the connectivity status of a habitat. Weersregard-ing and Toonen [16] showed that average pelagic larval duration is poorly correlated with genetic structure and an effective strategy for the con-servation of a particular species should, in part, be determined by information gathered on its genetic structure, especially the spatial distribution of genetic variability [17].
Connectivity between populations contributes to increased resilience of a species under changing environmental conditions (e.g. climate change) where more robust source popula-tions may provide larvae to other depleted populapopula-tions [22]. In this way, sink populapopula-tions can enhance population persistence across a network of connected populations [22]. McLeodet al. [23] suggested that biological patterns of connectivity should be taken into account when designing MPA networks and facilitate mutual replenishment and recovery from disturbance, particularly under the context of climate change. In addition, they recommended that future connectivity patterns be modelled so that measures can be taken to protect areas and facilitate expansion and migration [23], also discussed by Gormleyet al. [24].
In this study, microsatellite markers were developed and used to elucidate genetic diversity and genetic structure within and among fourM.modiolusreefs from Northern Ireland, Isle of Man and Wales. The major objectives were: a) to predict dispersal of larval propagules in the Irish Sea forM.modiolusreefs through the use of biophysical modelling coupled with a larval dispersal model; b) to estimate the level of genetic variation inM.modiolusand assess the effi-ciency of microsatellite markers for studying this species; c) to detect whether genetic differen-tiation has occurred among populations and identify factors that influence population genetic structure in this species; and d) to discuss factors contributing to the maintenance of connectiv-ity of the populations and provide information that may be useful for developing future conser-vation management for this PMH.
Methods
Larval Dispersal Modelling
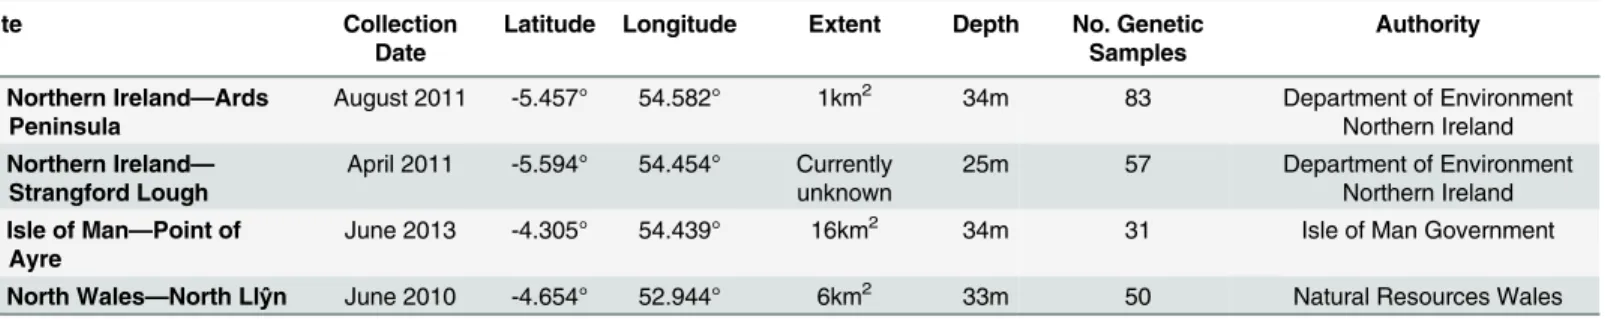
Simulated Lagrangian dispersal of virtual particles, representingM.modioluslarvae from the Irish Sea populations (Ards Peninsula, Strangford Lough, Point of Ayre, North Llŷn;Table 1), was carried out using the methodology described in Cosciaet al. [20]. The biophysical model-ling involved the development and validation of a three-dimensional (3D) hydrodynamic model (sbPOM) [26] of the Irish Sea [27], in order to simulate realistic tidal and residual cur-rents throughout the Irish Sea. The model cell size was 1/30° (longitude) by 1/60° (latitude), giving a resolution of approximately 1.85 km, and the model had 20 vertical terrain-following layers. The standard prognostic variables (e.g., velocity, temperature, salinity, and turbulence) are solved using finite-difference discretization on a staggered, orthogonal grid. Detailed infor-mation of the development and validation of the model has been reported by Robinset al. [27]. A typical year (1990) in terms of both wind-induced bed shear stress and sea surface heating was simulated for this study. The simulation was forced with six primary tidal constituents including the semidiurnal M2(lunar) and S2(solar) constituents, derived from an outer-nested
model [28]. The source of synoptic meteorological fields was the European Centre for Medium-Range Weather Forecasts-Interim reanalysis [29], available every 3 h at a (global) grid resolution of 1.5°.
A Lagrangian particle tracking model (PTM) was developed for this study to predict the likely larval dispersal ofM.modiolus. Output from the hydrodynamic simulation (3D velocities and horizontal diffusion), temporally and spatially interpolated to the individual position of each particle, each time step, was used to drive the PTM, so that particles were iteratively persed due to the simulated three-dimensional advection and horizontal diffusion. As the dis-persal ofM.modioluslarvae is poorly understood, the pelagic larval duration (PLD) is not well defined. Schweinitz and Lutz [30] suggested that larvae remained in the water column for 30 days, therefore 30 days was chosen as the PLD within the PTM. The model simulated passive
Table 1. Modiolus modiolusreefs populations sampled.
Site Collection
Date
Latitude Longitude Extent Depth No. Genetic Samples
Authority
1: Northern Ireland—Ards
Peninsula
August 2011 -5.457° 54.582° 1km2 34m 83 Department of Environment
Northern Ireland
2: Northern Ireland—
Strangford Lough
April 2011 -5.594° 54.454° Currently
unknown 25m 57 Department of EnvironmentNorthern Ireland
3: Isle of Man—Point of
Ayre
June 2013 -4.305° 54.439° 16km2 34m 31 Isle of Man Government
4: North Wales—North Llŷn June 2010 -4.654° 52.944° 6km2 33m 50 Natural Resources Wales
larval transport; that is, no vertical migration due to larval swimming. Again, this method was employed since the dispersal ofM.modioluslarvae is poorly understood, and acts as a baseline study for dispersal—sensitivity to generalised swimming behaviours has been studied in the region e.g.[27,31]. Cohorts of 10,000 larvae were released from the seabed at the four sample locations (representing a single point within the reef and corresponding to collection sites for genetic material), and at six times throughout the season, with start dates chosen on the 1st of each month (April to September). Each particle was then—tracked for the 30 day PLD. There-fore, a total of 240,000 individual larval trajectories were simulated. Larvae that encountered land, or the sea surface or the bed, were reflected back to their position in the previous PTM time step.
Development of polymorphic microsatellite markers
Permission for the collection ofModiolus modiolussamples for this study was granted by the following agencies: Loch Creran and Scapa Flow, Scotland, Scottish Natural Heritage; Ards Penninsula and Strangford Lough, Northern Ireland, Department of Department of Environ-ment Northern Ireland; Point of Ayre, Isle of Man, Isle of Man GovernEnviron-ment; and North Llŷn, Wales, Natural Resources Wales.
M.modiolus(n = 10) were collected by SCUBA divers from Loch Creran (West Scotland)
and from Scapa Flow (Orkney). Adductor muscle tissue was dissected from selected individuals and stored at 4°C in 96–100% ethanol. Genomic DNA extraction (from approximately 25mg of tissue) was carried out using the QIAGEN DNeasy Blood and Tissue kit protocol [32]. Microsatellite isolation was carried out according to Zaneet al. [33]. Following the identifica-tion of 196 positive clones, each was amplified by Polmerase Chain Reacidentifica-tion (PCR) using SP6 and T7 vector primers. The PCR reactions were prepared using Illustra PureTaq Ready-To-Go PCR beads in a final reaction volume of 25μl (50ng of starting genomic DNA) and run on a G-Storm (KAPA BIOSYSTEMS) thermocycler at 94°C for 5 mins followed by 30 cycles of denaturation at 94°C for 30 s; annealing at 55°C for 30 s; elongation at 72°C for 30 s; and end-ing with a send-ingle step at 72°C for 5 mins. PCR reactions were run on a 1% agarose gel to check for a product, cleaned using an Invitrogen PureLink Quick PCR Purification kit and sent to the Genepool, Edinburgh for sequencing. The resulting data were analysed in Sequencher v 4.10.1 (GeneCodes Ltd) for the presence of microsatellite repeats. Primers were designed using the Websat portal [34]; minimum Tm57–68°C; primer size 18-27bp; Primer GC 40–80%;
maxi-mum 3’stability = 250 and maximum 3’self-complementary = 2. Primer pairs that resulted in the amplification of a DNA fragment of the expected length, were taken forward for further testing under the following conditions after optimisation: DNA concentration of 20ng/ul at 94°C for 5 mins followed by 30 cycles of denaturation at 94°C for 30 s; annealing at a gradient temperature from 53°C to 58.1°C for 30 s; elongation at 72°C for 30 s; and ending with a single step at 72°C for 5 mins. Of the 34 loci initially identified, only 14 were considered to be suitable for further development. The forward primers for these loci were fluorescently labelled (Euro-fins: FAM and HEX; and Applied Biosystems: NED). The optimal annealing temperature was 57°C for all loci, with DNA concentration 10- 20ng/ul. PCR fragments were run alongside a ROX500 size standard in an ABI 3130 Genetic Analyser and alleles were scored for peak height (base pairs, bp) using Genemapper version 3.5.
Field Collection and screening of individuals from
Modiolus modiolus
reefs
DNA was extracted from all individuals as described previously and DNA quality was assessed via gel electrophoresis (1% agarose), samples showing poor quality were discarded. All individuals from the selected populations were genotyped using the 5 developed species-spe-cific markers. PCR reactions were run as previously described with the optimised conditions. Frequencies of null alleles were estimated using FreeNA [35]. Deviations of genotype fre-quencies from Hardy-Weinberg equilibrium (HWE) and linkage disequilibrium were tested in GENEPOP 4.0 [36]. Genetic variation was assessed through estimation of allelic frequencies, observed (Ho) and expected heterozygosities (He), Fisand Fst[θestimator [37]] values. Allelic
richness and number of private alleles were calculated using Fstat 2.9.3 [38] along with Fst
pair-wise test for differentiation (120 permutations).
Finally, population structure was analysed using two statistical approaches. Firstly, the Bayesian clustering techniques implemented in the software STRUCTURE 2.3.1 [39,40]. STRUCTURE was run allowing for admixture and correlated allele frequencies using 500,000 iterations following a 100,000 burn-in period to ensure chain convergence using a LOCPRIOR model. STRUCTURE uses individual multilocus genotype data to cluster individuals into groups (k) while minimising Hardy-Weinberg disequilibrium.Δk is a good predictor for the real number of clusters in the data [40,41]. The value of k was calculated from analysis of results in STRUCTURE Harvester [42] by averaging the mean posterior probability of the data L(k) over 5 independent runs. Post-processing of results was completed using CLUMPAK [43]. Secondly, the discriminant analysis of principal components (DAPC) was implemented in ADEGENET [44,45] for R. This method maximises genetic separation among groups, whilst minimising variation within groups.
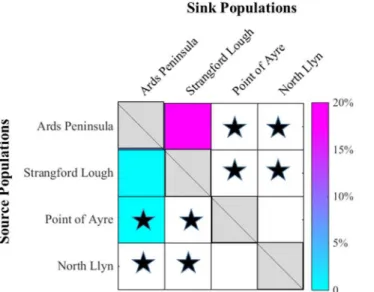
Finally, a connectivity matrix was constructed to show linkages between genetic spatial structure and biophysical model outputs. Seasonally-averaged and cohort-averaged connectivi-ties between populations (percentages of the total 6 x 10,000 larvae) were overlaid with signifi-cant genetic differentiated populations. Criteria for settlement (connectivity/retention) were for larvae to be located within 10 km of the settlement site after 30 days simulation. Modelled larval release (source) sites are labelled on the y-axis, and settlement (sink) sites are located on the x-axis; genetic values do not identify source/sink sites.
Results
Larval Dispersal Modelling
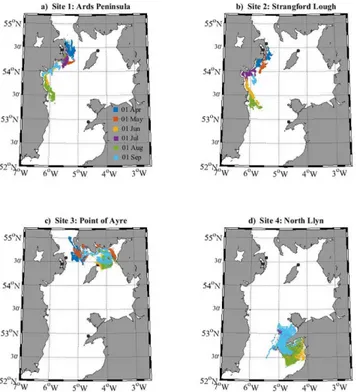
Although no connectivity was simulated between each release site, several simulations sug-gested that there could be some one-way connectivity. For example, particles released from the Point of Ayre (Isle of Man) during April were located within 15 km of Ards Peninsula after the 30-day PLD (Fig 3c). However, it appears unlikely that larvae from Northern Ireland will
Fig 2. Larval dispersal maps for each simulated cohort of 10,000 larvae within the northern Irish Sea (seeFig 1).Each panel (a-d) displays PTM output, after a 30-day PLD, from six release dates (01 April—01 September), released from the distinct source locations (black circles).
doi:10.1371/journal.pone.0143337.g002
Fig 3. Histograms of radial dispersal distances for each simulated cohort of 10,000 larvae.Each Fig
(a-d) displays histograms from six release dates (01 April—01 September), released from the distinct source locations (Sites 1–4). Each bar in each histogram represents 400 particles (i.e., each histogram is split into 25 bars). The average radial dispersal for each cohort is shown with grey diamonds and horizontal grey error bars signify one standard deviation. Radial dispersal distance is defined as the 30-day source-to-sink shortest distance.
connect directly (i.e., during a 30-day PLD) with sites on the Llŷn, or the Isle of Man, under similar conditions to the simulated PTM. It also appears unlikely that larvae from the Llŷn will connect directly with sites in Northern Ireland, or the Isle of Man, over the 30-day PLD. Never-theless, 30-day radial dispersal distances (i.e., direct source-to-sink dispersal distances) reached 150 km (From Ards north;Fig 3a), which is approximately the radial distance from Northern Ireland/Isle of Man sites to the Llŷn sites. Further, maximum radial dispersal distances were regularly greater than 60 km, which is approximately the radial distance from Northern Ireland sites to the Isle of Man site (Fig 3).
When looking at cohort-averaged radial dispersal distances (Fig 3), summer releases (partic-ularly June and August) appear to be most‘energetic’, and spring releases (April and May) least energetic. However, there is a high degree of variability, and the Point of Ayre site displays a different pattern of seasonal variability (Fig 3). This could be attributed to the (southwards and eastwards) residual currents opposing the (northwards and westwards) tidal residuals in that region [27].
Development of polymorphic microsatellite markers
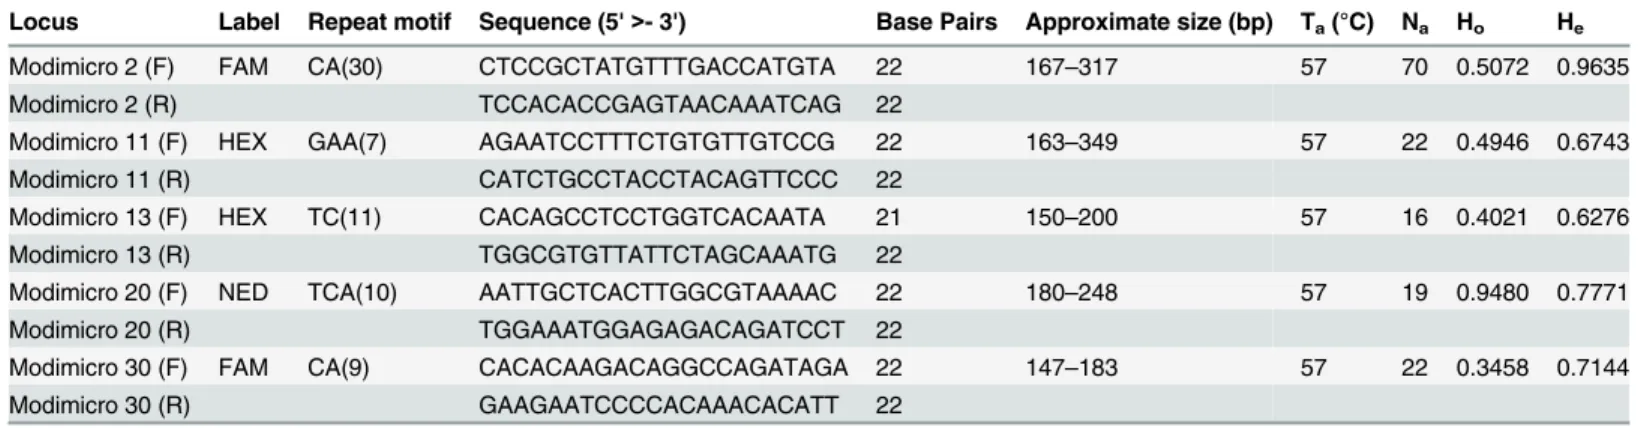
Table 2shows the results of the 5 microsatellite loci characterised. The number of alleles ranged from 16 for Modimicro 13 to 70 for Modimicro 2. Observed heterozygosity and expected het-erozygosity varied between 0.3458 for Modimicro 30 to 0.9480 for Modimicro 20; and 0.6276 (Modimicro 13) to 0.9635 (Modimicro 2), respectively.
Population Screening for Genetic Connectivity
The average number of alleles (including all markers) per population ranged from 9.4 at Point of Ayre to 20.8 at Strangford Lough; and the number of private alleles was greatest at Strang-ford Lough (51) and least at Point of Ayre (31). The observed heterozygosity (Ho) was lowest
(0.4373) in the North Llŷn population and highest (0.5958) at Strangford Lough. Overall, the expected heterozygosity (He) was higher than the observed heterozygosity indicating a possible
heterozygote deficiency (Table 3).
The presence of null alleles was detected for 4 of the 5 markers for the majority of the popu-lations tested (r>0.05). Modimicro 20 locus showed no null alleles across all 4 populations and the Point of Ayre population reported very low (0.0001) null allele frequencies for loci Modimicro 11 and 30. Significant positive Fisvalues for all populations indicate a deficiency of
heterozygotes compared to that expected under the Hardy-Weinberg Equilibrium (HWE). Therefore it was concluded that all populations were not in Hardy-Weinberg Equilibrium.
Table 2. Characterisation of microsatellite loci inModiolus modiolus.
Locus Label Repeat motif Sequence (5'>- 3') Base Pairs Approximate size (bp) Ta(°C) Na Ho He
Modimicro 2 (F) FAM CA(30) CTCCGCTATGTTTGACCATGTA 22 167–317 57 70 0.5072 0.9635
Modimicro 2 (R) TCCACACCGAGTAACAAATCAG 22
Modimicro 11 (F) HEX GAA(7) AGAATCCTTTCTGTGTTGTCCG 22 163–349 57 22 0.4946 0.6743
Modimicro 11 (R) CATCTGCCTACCTACAGTTCCC 22
Modimicro 13 (F) HEX TC(11) CACAGCCTCCTGGTCACAATA 21 150–200 57 16 0.4021 0.6276
Modimicro 13 (R) TGGCGTGTTATTCTAGCAAATG 22
Modimicro 20 (F) NED TCA(10) AATTGCTCACTTGGCGTAAAAC 22 180–248 57 19 0.9480 0.7771
Modimicro 20 (R) TGGAAATGGAGAGACAGATCCT 22
Modimicro 30 (F) FAM CA(9) CACACAAGACAGGCCAGATAGA 22 147–183 57 22 0.3458 0.7144
Modimicro 30 (R) GAAGAATCCCCACAAACACATT 22
It has been demonstrated that the inclusion of markers with null alleles can lead to an over-estimation of the genetic differentiation (Fst). Given that all but one of the markers and
popula-tions contained null alleles, it was therefore not possible to exclude the null allele markers from the calculations. To allow for this, Estimation of Null Allele (ENA) correction was performed using FreeNA software and pairwise Fstwas calculated before and after the correction
proce-dure was applied [35]. Pairwise Fstvalues before ENA correction ranged from 0.0023
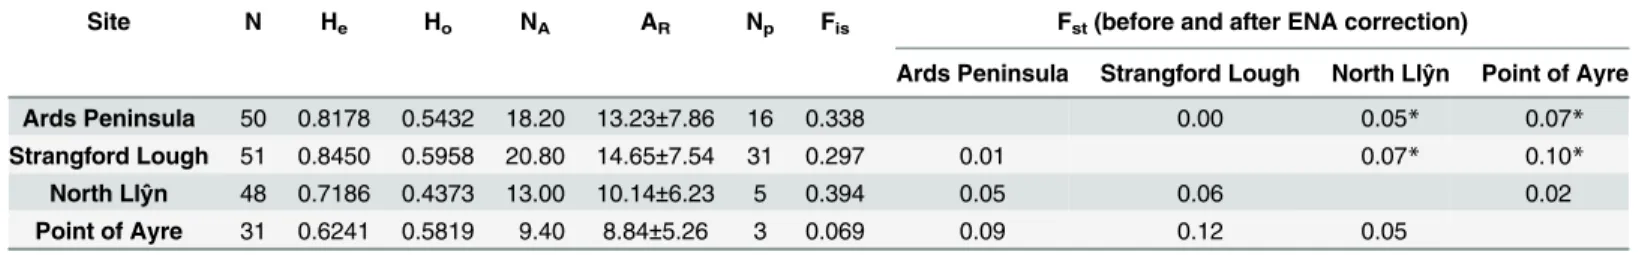
(Strang-ford Lough/Ards Peninsula) to 0.10 (Strang(Strang-ford Lough/Point of Ayre); and after correction ranged from 0.01 (Strangford Lough/Ards Peninsula) to 0.12 (Strangford Lough/Point of Ayre) (Table 3). Following correction, values remained in the same order of magnitude, indicating that the presence of null alleles was not overly influencing Fstestimates.
The Fstat pairwise test for differentiation showed low but significant (p<0.05) differentia-tion of Northern IrelandM.modioluspopulations from Irish Sea counterparts (Ards Penin-sula-Point of Ayre = 0.07; Ards Peninsula-North Llŷn = 0.05; Strangford Lough-Point of Ayre = 0.10; Strangford Lough-North Llŷn = 0.07). The Strangford Lough/Ards Peninsula and North Llŷn/Point of Ayre populations were not significantly differentiated.
Results from data analysis in the software STRUCTURE and STRUCTURE Harvester indi-cated a mean Log Likelihood of K = 2 and the‘Evanno method’(the second order rate of change in the likelihood, DeltaK) K = 2 (Fig 4). The global Fst value (using ENA) was 0.06
Table 3. Genetic Diversity Parameters inferred from microsatellites.
Site N He Ho NA AR Np Fis Fst(before and after ENA correction)
Ards Peninsula Strangford Lough North Llŷn Point of Ayre
Ards Peninsula 50 0.8178 0.5432 18.20 13.23±7.86 16 0.338 0.00 0.05* 0.07*
Strangford Lough 51 0.8450 0.5958 20.80 14.65±7.54 31 0.297 0.01 0.07* 0.10*
North Llŷn 48 0.7186 0.4373 13.00 10.14±6.23 5 0.394 0.05 0.06 0.02
Point of Ayre 31 0.6241 0.5819 9.40 8.84±5.26 3 0.069 0.09 0.12 0.05
N = number of samples; He= expected heterozygosity; Ho= observed heterozygosity; NA= number of alleles; AR= allelic richness; Np= number of
private alleles; Fis =inbreeding coefficient; Fstbefore (upper diagonal) and after (lower diagonal) ENA correction.
*Significant;
Indicative adjusted nominal level (5%) for multiple comparisons is: 0.0083 following Bonferroni correction, FStat
doi:10.1371/journal.pone.0143337.t003
Fig 4. Structure plots for K = 2, K = 3 and K = 4.
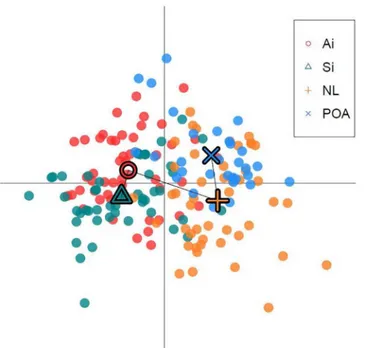
(p<0.001), therefore indicating moderate genetic differentiation between populations as defined by Wright [47] and Balloux and Lugon-Moulin [48]. It was concluded that the Bayes-ian STRUCTURE clustering approach using multilocus microsatellite genotypes detected pop-ulation structure; and the symmetric proportion of individuals assigned to putative clusters indicated genetic structure. The presence of population structure was confirmed by comparable results obtained within the DAPC analysis, with strong evidence for the presence of two genetic clusters (Fig 5).
The connectivity matrix (Fig 6) from modelled results indicates that Strangford Lough is a sink site for larvae dispersed from the Ards Peninsula (20%), whereas, there is weaker flow of larvae in the opposite direction (<5%). The results also indicate that Point of Ayre is a potential source site for Ards (<5%), however there is no connectivity in the opposite direction. The modelled larval dispersal shows that there is no connectivity between the Ards/Strangford and the North Llŷn/Point of Ayre populations which is also indicated by the genetic differentiation results and the two population clusters shown by the STRUCTURE analysis. While, the mod-elled data showed no connectivity between Point of Ayre and North Llŷn populations, there was no genetic differentiation between these sites.
Discussion
The combined approach of using genetic diversity markers with population dispersal model-ling have, in the past, not been fully incorporated into the design and placement of Marine Pro-tected Areas (MPAs) [18]. In this study, a biophysical model was used to predict dispersal of larval propagules in the Irish Sea forM.modiolusreefs, followed by the use of microsatellite markers to directly test connectivity and validate the model to understand whether the genetic data had congruence with the modelling data. This study shows the applicability of using such
Fig 5. Plot of the DAPC analysis for groups defined by sampling location. Dots represent individuals and the centre of the population indicated by a corresponding shape, connected by a minimum
spanning tree.
genetic analysis in the context of protected habitats and is the first study to develop microsatel-lite markers ofM.modiolus.
Genetic Diversity and Particle Dispersal
The expected heterozygosity (He) was highest within the Strangford Lough population and
lowest in the Point of Ayre population suggesting greater gene diversity within the Strangford Lough population. The inbreeding co-efficient Fiswas positive and significant for all
popula-tions and FreeNA analysis, reported null alleles for all loci at all populapopula-tions (and zero for Mod-imicro 20). Overall, low genetic differentiation (and therefore more gene flow [18]) was recorded between the Ards Peninsula/Strangford Lough and North Llŷn/Point of Ayre populations.
Heterozygosity is an important measurement for population diversity [49]. A significant heterozygote deficiency has previously been observed in a number of marine bivalve species [50]. High mutation rate [51],the Walhund effect, inbreeding, non-panmixia or genotyping errors (null alleles; although not evident for all loci and populations herein and other scoring errors) [52] and selection may contribute to this phenomenon. Microsatellites in molluscs are known to be particularly susceptible to heterozygote deficiency due to technical artefacts, e.g. amplification failure during PCR (incomplete DNA purification or null alleles), incorrect geno-typing or sampling drift due to small sample sizes [50]. Within this study, the highest number of alleles was reported within the Strangford Lough population, suggesting the richest genetic diversity of the 4 populations. However, a high degree of deviation for the HWE within this population, as well as the other 3 was noted, confirming heterozygote deficiency. High Fis
val-ues may indicate high levels of inbreeding, however, this is considered unlikely in bivalves with large populations and pelagic larvae [53]. It is likely that the high Fisvalues reported are due to
the observed heterozygote deficiency and potentially to the quality of the sample DNA (DNA extraction for 3 of the 4 samples was undertaken at least 20 months after tissue storage in etha-nol), however DNA quality was assessed prior to screening, with no apparent degradation of samples.
Fig 6. Connectivity matrix aligning larval dispersal and genetic differentiation.Blacks stars represent
significant differentiation. Diagonal cells signify retention at the release sites, and coloured cells elsewhere signify directional connectivity. White cells signify no connectivity.
The results show that there is limited structure within the populations screened and that there is an overall weak differentiation of the Ards Peninsula/Strangford Lough and North Llŷn/Point of Ayre reefs. This would suggest that there is little restriction in gene flow between these two groups of populations.
Further development is required regarding the type of connectivity screening undertaken on priority marine organisms (in relation to informing policy and marine spatial planning). For example, it would be beneficial to screen potentially isolated populations or geographically distinct populations (e.g. east Scotland, Norway and Pacific e.g. [54]) to confirm applicability for microsatellite use within these populations. Within this study, microsatellites were identi-fied as the genetic tool of choice based on the available resources at the time of study. Interpre-tation of the results of this study is limited by the low numbers of markers employed and the presence of null alleles; and further development of markers will be required to determine the full extent of the genetic connectivity ofM.modiolusin the Irish Sea.
Results from the particle dispersal model show that larval settlement location is driven by oceanographic-atmospheric processes and larval duration. Simulations for passive larvae sug-gest that larval dispersal has the potential for dispersal to be wide reaching. This result corrobo-rates the genetic analysis showing an inter-connected Irish Sea metapopulation. However, simulated populations on the east and west of the Irish Sea seem to be separate from one another, for several releases over a typical year due to variations in wind speeds and thermal heating [27]. The simulated large variability in dispersal (from one release date to another) allows us to speculate that, under different atmospheric conditions, such as greater thermal heating (resulting in strengthening of the residual frontal circulations), or persistent across-sea winds e.g. [55], it is possible that the Irish Sea populations may be more inter-connected How-ever, all but the Strangford Lough population have been discovered in the last 20 years and the Ards population in the last 5 years, so, it is highly likely that other stepping-stone populations exist between those in the present study, increasing the likelihood of a connected network.
Combining the larval dispersal model and the genetic analysis results allows for the valida-tion of the two methods and provides a more accurate depicvalida-tion of the relavalida-tionships between the populations. Discrepancies noted between the two methods in this study showed that, from a modelled perspective, the North Llŷn and Point of Ayre populations were not connected, whereas the genetic analysis showed no significant differentiation. Given the existence of aM.
modiolusreef off the south of the Isle of Man (Little Ness) between Point of Ayre and North
Llŷn, this site may contribute to the connectivity of these two populations if included in the lar-val dispersal model and could represent a stepping stone population.
particular influence will be periods with extreme events such as storms (producing both large waves and strong winds), which may increase dispersal in the upper water column, but may also break down residual pathways. Conversely,‘heat waves’/droughts may strengthen residual pathways. Additionally, the influence of atypical conditions such as prolonged easterly winds should be quantified with regard to dispersal. Such information is crucial for improved model simulations of larval dispersal and connectivity.
Management Implications
Due to the connectivity of theM.modiolusreefs implicated in this study and their decline and scarcity in the Irish Sea, it seems likely that they exist as a network of“stepping stone”habitats, each with an important role in gene flow. It was not possible to analyse Isolation by Distance of the populations in this study due to the limited number of markers developed but it would be useful to do so in the future, to understand in more detail the specific connections between each reef and identify direction of genetic flow (source/sink) to complement modelling out-puts. Other known reefs are also scattered more widely along the west of the UK, perhaps indi-cating similar "stepping stones" for genetic exchange over the wider sea area.
Habitat connectivity (including genetics) of marine organisms has been cited as a major concern to the maintenance of marine biodiversity but despite the large number of published articles that assert the importance of using genetic data for management and conservation, very few use data applicable to real-life situations [58] as demonstrated in this study. An impli-cation that arises from the notion of connected networks of protected habitats and species is the potential for the development of barriers to gene flow and the potential for genetic shift. Alteration of local hydrodynamics could result in disruption to the dispersal of larvae (and therefore genetic material). Careful management consideration is therefore required to ensure that connectivity between sites is maintained: in the design and selection of MPAs; in the place-ment of offshore developplace-ments (such as wind farms and tidal/wave devices); in conservation/ biodiversity restoration programmes; and in the selection of appropriate management options in protected and wider sea areas (including fisheries management, invasive monitoring, and maintaining connectivity corridors).
The global literature on the connectivity of MPAs tends to be directed towards their benefits for commercial fish and the role of no-take reserves in increasing stocks in neighbouring areas and maintaining gene flow within populations [59–61]. However, little thought has been given to the connectivity of habitats, especially those that these fish inhabit in MPAs. Certain benthic habitats can be important to commercially valuable fish species [62,63] and in some cases it is reported that juvenile fish have a greater chance of survival in structurally complex habitats [64]. This is relevant in the present study, because there is emerging evidence that structurally complex PMHs, including horse mussel reefs, are commercially important Essential Fish Habi-tat [65,66].
The connectivity of PMHs may be of importance to commercial fisheries as well as to the biodiversity of an MPA network. Loss or damage to one of the stepping-stone habitats could have a knock-on effect to other areas of the marine ecosystem as a whole, resulting in conse-quences for biodiversity conservation and livelihoods, but also, in the achievement of objectives under MSFD, as the policy link has been made between the maintenance of PMHs and the achievement of GES [11].
It is well understood thatM.modiolusreefs (and other benthic habitats) are particularly sus-ceptible to damage from certain types of fishing gear [1,3,6,67,68]. In Strangford Lough
>10km2ofM.modiolusreefs have been lost since the mid-1970s [13,69] and were associated
Strangford LoughM.modiolusreefs with recent considerations including the transfer of adult mussels to areas characterized as having high potential for successful translocation (i.e. accord-ing to habitat suitability, larval dispersal modellaccord-ing and historical distribution of the species) and falling within a proposed non-disturbance zone [13,70]. However, given that translocation requires acquiring sufficient number ofM.modiolusfrom outside the area, the issue of intro-ducing genetically non-compatible animals has been raised [13]. Genetic similarity shown in this study supports the proposal that the Ards PeninsulaM.modioluspopulation may be a pro-spective source ofM.modiolusfor translocation to Strangford Lough [13,70,71]. On the other hand, the present study also indicates that, should appropriate ground be available in Strang-ford Lough, larvae from the Ards Peninsula are also capable of reaching it and, given the right conditions, to colonise it.
Overall, in the Irish Sea, the general decline in horse mussel beds, and the apparent connec-tivity of the remaining beds (as seen from larval dispersal and genetic similarity in this study), implies that it would be wise to manage them as inter-dependent stepping-stones, especially on either side of the Irish Sea. Creating a coherent network of MPAs and the achievement of GES the MSFD by 2020, requires information on the connectivity of populations; research on which is currently lacking across Europe. Greater study resolution and research over a larger spatial area will improve the ability to design MPA networks and could further inform future manage-ment; therefore achieving long term protection of Europe’s marine environment.
Acknowledgments
The authors would like to thank members of Heriot-Watt Scientific Dive Team and the NRW Marine Monitoring Team as well as Rohan Holt, Jose Fariñas Franco and Gwen Edwards for the collection of sublittoralM.modiolussamples and processing of tissue samples whilst in the field. Salma Shalla and Terry Holt kindly made their laboratory available to us in the Isle of Man to process samples and Catherine Duigan facilitated collaboration in Wales. We also thank Dr. Colin Moore (Serpula), Bob Anderson, (MV Halton), Paul Turkentine (Pedryn) Michelle Hayward (MV Endeavour), Joe Breen (MV Modiolus) for their assistance in the field. Northern Ireland Environmental Agency, Natural Resources Wales and Isle of Man Govern-ment (Fiona Gell) provided funding, in-kind and logistical support.
Author Contributions
Conceived and designed the experiments: KG CM JP PR IC. Performed the experiments: KG CM JP AC PR JJ. Analyzed the data: KG CM JP PR JJ SP AC. Contributed reagents/materials/ analysis tools: AC. Wrote the paper: KG CM JP WS AH SP IC PR.
References
1. OSPAR Commission. Background Document for Modiolus modiolus beds. OSPAR Biodiversity Series. Prepared on behalf of the Joint Nature Conservation Committee by Rees, E., 2009.
2. Morris E. Defining Annex I biogenic Modiolus modiolus reef under the Habitats Directive: Report of an
inter-agency workshop March 4th & 5th, 2014. JNCC DRAFT Report No. 531 2014.
3. OSPAR Commission. Assessment of Modiolus modiolus beds in the OSPAR area. OSPAR Biodiver-sity Series. Prepared on behalf of the Joint Nature Conservation Committee by Rees, E., 2009 Septem-ber 2008 (revised January 2009). Report No.
4. Wildish DJ, Fader GBJ. Pelagic–benthic coupling in the Bay of Fundy. Hydrobiologia. 1998; 375-376 (0):369–80. doi:10.1023/A:1017080116103
6. Rees EIS, Sanderson WG, Mackie ASY, Holt RHF. Small-scale variation within a Modiolus modiolus (Mollusca: Bivalvia) reef in the Irish Sea. III. Crevice, sediment infauna and epifauna from targeted cores.. Journal of the Marine Biological Association of the United Kingdom. 2008; 88(1):151–6.
7. Ragnarsson SA, Burgos JM. Separating the effects of a habitat modifier, Modiolus modiolusand sub-strate properties on the associated megafauna. Journal of Sea Research. 2012; 72(0):55–63. doi:10. 1016/j.seares.2012.05.011
8. Sanderson WG, Holt RHF, Ramsay K, Perrins J, McMath AJ, Rees EIS. Small-scale variation within a Modiolus modiolus (Bivalvia) reef in the Irish Sea. Ii. Epifauna recorded by divers and cameras. Journal of the Marine Biological Association UK 88. 2008. p. 143–9.
9. OSPAR Commission. Descriptions of habitats on the OSPAR list of threatened and/or declining spe-cies and habitats, Reference Number: 2008–07 2004 [cited 2013 August]. Available from:http://www. ospar.org/content/content.asp?menu=00730302240132_000000_000000.
10. DEFRA. Marine Strategy Framework Directive: Department of Environment Food and Rural Affairs http://www.defra.gov.uk/environment/marine/msfd/[Accessed: August 2014]; 2011 [cited 2011 Febru-ary]. Available from:http://www.defra.gov.uk/environment/marine/msfd/.
11. Cochrane SKJ, Connor DW, Nilsson P, Mitchell I, Reker J, Franco J, et al. Marine Strategy Framework Directive. Guidance on the interpretation and application of Descriptor 1: Biological diversity. Report by Task Group 1 on Biological diversity for the European Commission’s Joint Research Centre. Ispra, Italy. 2010.
12. Jiale L, Wang G, Bai Z. Genetic variability in four wild and two farmed stocks of the Chinese freshwater peral mussel (Hyriopsis cumingii) estimated by microsatellite DNA markers. Aquaculture. 2009; 287:286–91.
13. Roberts D, Allcock L, Farinas Franco JM, Gorman E, Maggs CA, Mahon AM, et al. Modiolus Restora-tion Research Project: Final Report and RecommendaRestora-tions. Queen's University Belfast, 2011 20th May 2011. Report No.
14. Wallace BP, DiMatteo AD, Hurley BJ, Finkbeiner EM, Bolten AB, Chaloupka MY, et al. Regional Man-agement Units for Marine Turtles: A Novel Framework for Prioritizing Conservation and Research across Multiple Scales. Plos One. 2010; 5(12):e15465. doi:10.1371/journal.pone.0015465PMID:21253007
15. Schunter C, Carreras-Carbonell J, Planes S, Sala E, Ballesteros E, Zabala M, et al. Genetic connectiv-ity patterns in an endangered species: The dusky grouper (Epinephelus marginatus). Journal of Experi-mental Marine Biology and Ecology. 2011; 401(1–2):126–33.
16. Weersing K, Toonen RJ. Population genetics, larval dispersal, and connectivity in marine systems. Marine Ecology Progress Series. 2009; 393:1–12.
17. Palumbi SR. Population genetics, demographic connectivity, and the design of marine reserves. Eco-logical Applications. 2003; 13(1):S146–S58.
18. Bell JJ. Connectivity between island Marine Protected Areas and the mainland. Biol Conserv. 2008; 141:2807–20.
19. Thomas Y, Le Gendre R, Garen P, Dumas F, Andréfouët S. Bivalve larvae transport and connectivity
within the Ahe atoll lagoon (Tuamotu Archipelago), with application to pearl oyster aquaculture man-agement Mar Pollut Bull. 2012; 35(10):441–52.
20. Coscia I, Robins P, Porter J, Malham S, Ironside J. Modelled larval dispersal and measured gene flow:
seascape genetics of the common cockleCerastoderma edulein the southern Irish Sea. Conservation Genetics. 2013; 14(2):451–66. doi:10.1007/s10592-012-0404-4
21. Harrald M, Davies I. The Saltire Prize Programme: Further Scottish Leasing Round (Saltire Prize
proj-ects) Scoping Study. Marine Scotland, 2010 March 2010. Report No.
22. Almany GR, Connolly SR, Heath DD, Hogan JD, Jones GP, McCook LJ, et al. Connectivity, biodiversity conservation and the design of marine reserve networks for coral reefs. Coral Reefs. 2009; 28(2):339– 51. doi:10.1007/s00338-009-0484-x
23. MacLeod E, Salm R, Green A, Almany J. Designing marine protected area networks to address the impacts of climate change. Frontiers in Ecology and the Environment. 2009; 7.
24. Gormley KSG, Porter JS, Bell MC, Hull AD, Sanderson WG. Predictive Habitat Modelling as a Tool to Assess the Change in Distribution and Extent of an OSPAR Priority Habitat under an Increased Ocean Temperature Scenario: Consequences for Marine Protected Area Networks and Management. Plos One. 2013; 8(7): e68263. doi:10.1371/journal.pone.0068263PMID:23894298
25. Ljungberg P, Hasper T, Nilsson PA, Persson A. Effects of small-scale habitat fragmentation on preda-tor–prey interactions in a temperate sea grass system. Marine Biology. 2013; 160(3):667–75. doi:10. 1007/s00227-012-2122-3
27. Robins PE, Neill SP, Giménez L, Jenkins SR, Malham SK. Physical and biological controls on larval dispersal and connectivity in a highly energetic shelf sea. Limnology and Oceanography. 2013; 58:505–24.
28. Neill SP, Scourse JD, Uehara K. Evolution of bed shear stress distribution over the northwest European shelf seas during the last 12,000 years. Ocean Dynamics. 2010; 60:1139–56.
29. Simmons A, Uppala S, Dee D, Kobayashi S. ERA Interim: New ECNWF re-analysis products from
1989 onwards. ECMWF Newsl. 2006; 110:25–35.
30. Schweinitz EH, Lutz RA. Larval development of the northern horse mussel Modiolus modiolus (L.),
including a comparison with the larvae ofMytilus edulisL. as an aid in planktonic identification. Biologi-cal Bulletin. 1976; 150:348–60. PMID:953069
31. Phelps JJC, Polton JA, Souza AJ, Robinson LA. The influence of behaviour on larval dispersal in shelf
sea gyres:Nephrops norvegicusin the Irish Sea. Marine Ecology Progress Series. 2015; 518:177–91.
32. QIAGEN. DNeasy Blood and Tissue Handbook.www.QIAGEN.comJuly 2006. 2006.
33. Zane I, Bargelloni L, Patarnello T. Strategies for microsatellite isolation: a review. Molecular Ecology. 2002; 11:1–16. PMID:11903900
34. Martins WS, Lucus DCS, Neves KFS, Bertioli DJ. A Web Software for Microsatellite Marker
Develop-ment. Bioinformation. 2009; 3(6):282–3. PMID:19255650
35. Chapuis M-P, Estoup A. Microsatellite Null Alleles and Estimation of Population Differentiation. Molecu-lar Biology and Evolution. 2007; 24(3):621–31. doi:10.1093/molbev/msl191PMID:17150975
36. Raymond M, Rousset F. GENEPOP (Version 1.2): Population Genetics Software for Exact Tests and Ecumenicism. Journal of Heredity. 1995; 86(3):248–9.
37. Weir BS, Cockerham CC. Estimating F-Statistics for the Analysis of Population Structure. Evolution.
1984; 38(6):1358–70.
38. Goudet J. FSTAT (Version 1.2): A Computer Program to Calculate F-Statistics. Journal of Heredity.
1995; 86(6):485–6.
39. Pritchard JK, Stephens M, Donnelly P. Inference of Population Structure Using Multilocus Genotype Data. Genetics. 2000; 155(2):945–59. PMID:10835412
40. Chust G, Albaina A, Aranburu A, Borja Á, Diekmann OE, Estonba A, et al. Connectivity, neutral theories and the assessment of species vulnerability to global change in temperate estuaries. Estuarine, Coastal and Shelf Science. 2013; 131(0):52–63. doi:10.1016/j.ecss.2013.08.005
41. Evanno G, Regnaut S, Goudet J. Detecting the number of clusters of individuals using the software STRUCTURE: a simulation study. Molecular Ecology. 2005; 14(8):2611–20. PMID:15969739
42. Earl DA, von Holdt BM. STRUCTURE HARVESTER: a website and program for visualizing
STRUC-TURE output and implementing the Evanno method.. Conservation Genetics Resources. 2012; 4 (2):359–61
43. Kopelman NM, Mayzel J, Jakibsson M, Rosenberg NA, Mayrose I. Clumpak: a program for identifying clustering modes and packaging population structure inferences across K. Molecular Ecology Resources. 2015.
44. Jombart T. adegenet: a R package for the multivariate analysis of genetic markers. Bioinformatics. 2008; 24:1403–5. doi:10.1093/bioinformatics/btn129PMID:18397895
45. Jombart T, Devillard S, Balloux F. Discriminant analysis of principal components: a new method for the
analysis of genetically structured populations. BMC Genetics. 2010; 11(1):94. doi: 10.1186/1471-2156-11-94
46. Horsburgh KJ, Hill AE. A three-dimensional model of density-driven circulation in the Irish Sea.. J Phys
Oceanogr 2003; 33:343–65.
47. Wright S. Evolution and the Genetics of Populations, vol. 4, Variability Within and Among Natural Pop-ulations.: University of Chicago Press, Chicago, IL; 1978.
48. Balloux F, Lugon-Moulin N. The estimation of population differentiation with microsatellite markers. Molecular Ecology. 2002; 11(2):155–65. doi:10.1046/j.0962-1083.2001.01436.xPMID:11856418
49. Wang Y, Fu D, Xia J. The genetic diversity of the noble scallop (Chlamys nobilis, Reeve 1852) in China assessed using five microsatellite markers. Marine Genomics. 2013; 9(0):63–7. doi:10.1016/j.margen. 2012.06.003
50. Diz AA, Presa P. The genetic diversity pattern of Mytilus galloprovincialis in Galician Rias (NW Iberian estuaries). Aquaculture. 2009; 287:278–85.
51. Miller AD, Versace VL, Matthews TG, Montgomery S, Bowie KC. Ocean currents influence the genetic
52. Gonzalez-Wanguemert M, Vergara-Chen C. Environmental variables, habitat discontinuity and life his-tory shaping the genetic structure ofPomatoschistus marmoratus. Helgoland Marine Research. 2014; 68:357–71.
53. Gonzalez-Wanguemert M, Costa J, Basso L, Duarte C, Serrao E, Hendricks I. Highly polymorphic microsatellite markers for the Mediterranean endemic fan musselPinna nobilis. Mediterranean Marine Science. 2015; 16(1):31–5.
54. Halanych KM, Vodoti ET, Sundberg P, Dahlgren TG. Phylogeography of the horse musselModiolus modiolus. Journal of the Marine Biological Association of the United Kingdom. 2013;FirstView:1–13. doi:10.1017/S0025315413000404
55. Hartnett M, Berry A, Tully O, Dabrowski T. Investigations into the transport and pathways for scallop lar-vae—the use of numerical models for managing fish stocks.. J Environ Monit 2007; 9(403–410). PMID: 17492084
56. Sundelöf A, Jonsson PR. Larval dispersal and vertical migration behaviour–a simulation study for short dispersal times. Marine Ecology. 2012; 33(2):183–93.
57. Emsley SM, Trarling GA, Burrows MT. The effect of vertical migration strategy on retention and disper-sion in the Irish Sea during spring–summer. Fisheries Oceanography. 2005; 14(3):161–74.
58. von der Heyden S, Beger M, Toonen RJ, van Herwerden L, Juinio-Meñez MA, Ravago-Gotanco R, et al. The application of genetics to marine management and conservation: examples from the Indo-Pacific. Bulletin of Marine Science. 2014; 90(1):123–58.
59. Botsford L, Brumbaugh D, Grimes C, Kellner J, Largier J, O’Farrell M, et al. Connectivity, sustainability, and yield: bridging the gap between conventional fisheries management and marine protected areas. Rev Fish Biol Fisheries. 2009; 19(1):69–95. doi:10.1007/s11160-008-9092-z
60. Hedgecock D, Barber PH, Edmands S. Genetic approaches to measuring connectivity. Oceanography.
2007; 20(3):70–9.
61. Gillanders B, Able KW, Brown JA, Eggleston DB, Sheridan PF. Evidence of connectivity between juve-nile and adult habitats for mobile marine fauna: an important component of nurseries. Marine Ecology Progress Series. 2003; 247:281–95.
62. Thrush SF, Hewitt JE, Cummings VJ, Dayton PK, Cryer M, Turner SJ, et al. Disturbance of the marine benthic habitat by commercial fishing: Impacts at the scale of the fishery. Ecological Applications. 1998; 8(3):866–79. doi:10.1890/1051-0761(1998)008[0866:DOTMBH]2.0.CO;2
63. Kaiser MJ, Spence FE, Hart PJB. Fishing-Gear Restrictions and Conservation of Benthic Habitat Com-plexity. Conservation Biology. 2000; 14(5):1512–25. doi:10.1046/j.1523-1739.2000.99264.x
64. Bradshaw C, Collins P, Brand AR. To what extent does upright sessile epifauna affect benthic biodiver-sity and community composition? Marine Biology. 2003; 143:783–91.
65. Kamenos NA, Moore PG, Hall-Spencer JM. Maerl grounds provide both refuge and high growth poten-tial for juvenile queen scallops (Aequipecten opercularis L.). Journal of Experimental Marine Biology and Ecology. 2004; 313(2):241–54. doi:10.1016/j.jembe.2004.08.007
66. Henry L-A, Navas JM, Hennige SJ, Wicks LC, Vad J, Murray Roberts J. Cold-water coral reef habitats
benefit recreationally valuable sharks. Biol Conserv. 2013; 161(0):67–70. doi:10.1016/j.biocon.2013. 03.002
67. Roberts D. Investigations into a M. modiolus (L.) (Mollusca: Bivalvia) community in Strangford Lough, Northern Ireland. Underwater Association. 1975; 1:27–49.
68. Cook R, Fariñas-Franco JM, Gell FR, Holt RHF, Holt T, Lindenbaum C, et al. The Substantial First Impact of Bottom Fishing on Rare Biodiversity Hotspots: A Dilemma for Evidence-Based Conservation. Plos One. 2013; 8(8):e69904. doi:10.1371/journal.pone.0069904PMID:23967063
69. Roberts D, Davies C, Mitchell A, Moore H, Picton B, Portig A, et al. Strangford Lough Ecological
Change Investigation (SLECI). Belfast: Oueens University, 2004.
70. Elsäßer B, Fariñas-Franco JM, Wilson CD, Kregting L, Roberts D. Identifying optimal sites for natural recovery and restoration of impacted biogenic habitats in a special area of conservation using hydrody-namic and habitat suitability modelling. Journal of Sea Research. 2013; 77(0):11–21. doi:10.1016/j. seares.2012.12.006