Studying Dynamic Features in Myocardial
Infarction Progression by Integrating
miRNA-Transcription Factor Co-Regulatory Networks
and Time-Series RNA Expression Data from
Peripheral Blood Mononuclear Cells
Hongbo Shi1☯, Guangde Zhang2☯, Jing Wang1, Zhenzhen Wang1, Xiaoxia Liu2, Liang Cheng1, Weimin Li3*
1College of Bioinformatics Science and Technology, Harbin Medical University, Harbin, Heilongjiang, 150081, PR China,2Department of Cardiology, The Fourth Affiliated Hospital of Harbin Medical University, Harbin, Heilongjiang, 150001, PR China,3Department of Cardiology, The First Affiliated Hospital of Harbin Medical University, Harbin, Heilongjiang, 150001, PR China
☯These authors contributed equally to this work. *liweimin_2009@163.com
Abstract
Myocardial infarction (MI) is a serious heart disease and a leading cause of mortality and morbidity worldwide. Although some molecules (genes, miRNAs and transcription factors (TFs)) associated with MI have been studied in a specific pathological context, their dynamic characteristics in gene expressions, biological functions and regulatory interactions in MI pro-gression have not been fully elucidated to date. In the current study, we analyzed time-series RNA expression data from peripheral blood mononuclear cells. We observed that significantly differentially expressed genes were sharply up- or down-regulated in the acute phase of MI, and then changed slowly until the chronic phase. Biological functions involved at each stage of MI were identified. Additionally, dynamic miRNA–TF co-regulatory networks were con-structed based on the significantly differentially expressed genes and miRNA–TF co-regula-tory motifs, and the dynamic interplay of miRNAs, TFs and target genes were investigated. Finally, a new panel of candidate diagnostic biomarkers (STAT3 and ICAM1) was identified to have discriminatory capability for patients with or without MI, especially the patients with or without recurrent events. The results of the present study not only shed new light on the understanding underlying regulatory mechanisms involved in MI progression, but also con-tribute to the discovery of true diagnostic biomarkers for MI.
Introduction
Myocardial infarction (MI) is defined pathologically as myocardial cell death caused by pro-longed ischemia, and is a leading cause of morbidity, mortality and cost to society [1]. The recurrence of MI greatly increases the risk of death. Clinically, different methods are used for diagnosis, including electrocardiography, blood tests, and coronary angiography.
a11111
OPEN ACCESS
Citation:Shi H, Zhang G, Wang J, Wang Z, Liu X, Cheng L, et al. (2016) Studying Dynamic Features in Myocardial Infarction Progression by Integrating miRNA-Transcription Factor Co-Regulatory Networks and Time-Series RNA Expression Data from Peripheral Blood Mononuclear Cells. PLoS ONE 11 (7): e0158638. doi:10.1371/journal.pone.0158638
Editor:Shengtao Zhou, West China Second Hospital, Sichuan University, CHINA
Received:March 5, 2016
Accepted:June 20, 2016
Published:July 1, 2016
Copyright:© 2016 Shi et al. This is an open access article distributed under the terms of theCreative Commons Attribution License, which permits unrestricted use, distribution, and reproduction in any medium, provided the original author and source are credited.
Data Availability Statement:All relevant data are within the paper and its Supporting Information files.
Funding:This work was supported in part by the National Natural Science Foundation of China (Grant Nos. 31500675,81270252), the Natural Science Foundation of Heilongjiang Province, China (Grant No. QC2013C019) and the Postdoctoral Foundation of Heilongjiang Province (Grant No. LBH–Z15162).
In the past decades, the molecular mechanisms underlying MI have been widely investi-gated. Most of these studies focused on several genes on specific conditions. For example, glu-taredoxin regulates apoptosis in cardiomyocytes via NFκB targeting Bcl-2 and Bcl-xL [2]. In murine cardiac fibroblasts, miRNA (miR)-21 modulates matrix metalloproteinase-2 expression at the infarct zone via a phosphatase and tensin homologue pathway [3]. However, the
dynamic features in gene expressions, biological functions and regulatory interactions in MI progression have not been fully studied at a system level.
Dynamic data could provide more valuable information for understanding biological pro-cesses than data focused on single time points [4–6]. Nowadays, different genomics data can be measured over time, of which time-series gene expression data are one of the most abundant and available data [4]. Recently, some studies have applied time-series gene expression data to uncover complex regulatory mechanisms underlying biological process and disease status [6– 11]. For example, Nazarovet al. [7,8] systematically investigated dynamic regulation of mRNA and miRNA expression following stimulation of melanoma cells with interferon-γ, and revealed dynamic interplay of miRNA and upstream regulators with biological functions in human. Liet al. [10] identified dynamic network biomarkers and analyzed the underlying mechanisms of complex diseases by constructing dynamic human protein–protein interaction networks. For MI, Portet al. [6] analysed changes in expression of mRNAs and miRNAs in mouse using expression profiles of three time points post-MI. Zhanget al. [11] identified sev-eral key genes and their possible functions in acute MI by the analysis of six time points gene expression data in mouse. However, the dynamic characteristics of biological function and reg-ulatory interactions in MI progression in the above two studies have not been investigated, and whether the results in mouse are applicable to humans remains unknown.
Network-based systems biology approaches have emerged as powerful tools for deciphering the complex regulatory interactions underlying diseases [12,13]. Gene regulatory networks control gene expression and protein formation, and therefore influence the cell fate. miRNAs and transcription factors (TFs) are two major regulators in gene regulatory networks and are involved in many important biological events, such as cell proliferation, differentiation and apoptosis. Therefore, abnormal expression of miRNAs and TFs will trigger a series of diseases. MiRNAs are small non-coding RNAs (~22nt) capable of inhibiting expression of target mRNAs by binding to their 3' untranslated regions (UTRs) [14]. MiRNAs regulate expression of genes at the post-transcriptional level, while TFs modulate gene expression at the transcrip-tional level. Additranscrip-tionally, miRNAs and TFs can regulate the same target genes, and they may mutually regulate each other; hence forming feed-forward loops (FFLs), which have been dem-onstrated to comprise recurrent network motifs and play important roles in mammalian genomes [15,16]. Recently, Zhanget al. [17] and Aroraet al. [18] have reviewed miRNA–TF co-regulatory loops in biological processes and diseases. The miRNA and TF interactions focused on FFLs in cancer have been studied [19–23]. For example, significant miRNA–TF FFLs associated with cancer have been identified using mRNA and miRNA expression profiles [21]. The gene regulatory networks involved in miRNA–TF FFLs have been examined for breast cancer subtypes to study their distinct and common features [22]. Simultaneously, MI-related miRNA–TF co-regulatory network based on FFLs has also been investigated [24,25], from which certain important regulators and regulatory modules were identified. However, these studies were focused on static networks, but the regulatory interactions within the net-works vary with different disease states. Thus, dynamic miRNA–TF co-regulatory networks involved in FFLs are essential to capture the changing information during disease progression.
expression, biological function and the regulatory interactions among miRNAs, TFs and target genes. Additionally, a new panel of diagnostic biomarkers defined by STAT3 and ICAM1 was identified.
Materials and Methods
Gene Expression Profiles
The MI related gene expression profile data were downloaded from the Gene Expression Omnibus (GEO) database under accession number of GSE62646 (www.ncbi.nlm.nih.gov/geo/ query/acc.cgi?acc=GSE62646) [26], including a case group of 28 patients with ST-segment ele-vation MI and a control group of 14 patients with stable coronary artery disease, without a his-tory of MI. The gene expression profiles were measured in peripheral blood mononuclear cells drawn from all samples, and the blood was collected on day 1 of MI (acute phase), after 4–6 days (subacute phase), and after 6 months (chronic phase). More detailed information on sam-ples collection and diagnosis criteria can be obtained from reference [26].
Fig 1. The schematic representation of the computational analysis pipeline.
Expression Profile Pre-Processing and Screening of Differentially
Expressed Genes
To reduce unreliable information, primary data of microarray expression profiles were pre-processed according to previous studies [7,8]. Probes were removed for which the maximum expression over all arrays did not reach a signal intensity of 7 on a log2scale. The probes were
removed when one probe corresponded to multiple genes. Expression values were averaged when multiple probes corresponded to one gene [27–29]. We then retained protein-coding genes. To identify significantly differentially expressed (SDE) genes comparing expression data in case samples with controls, differential analysis was performed using the R‘limma’package. To control the false discovery rates, the Benjamini–Hochberg multiple testing correction was conducted. The genes with adjustedp<0.001 and>1.2-fold change were selected as SDE genes.
Enrichment Analysis
Enrichment analysis of SDE genes (case samples versus controls) at each time point was imple-mented in the following two steps: (1) KEGG pathway enrichment analysis for SDE genes was performed using DAVID; and (2) KEGG subpathway (local area of the entire biological path-way) enrichment analysis for SDE genes was implemented using the R‘SubpathwayMiner’
package [30]. Significantly enriched pathways and subpathways were identified with a Benja-mini–Hochberg adjustedp<0.05 (S1 FigandS1 File). In order to show the results more clearly, if multiple significantly enriched subpathways corresponded to an entire pathway, the subpath-way with the minimum adjustedpvalue was retained.
Identification of miRNA
–
TF Co-Regulatory Motifs
MiRNA–TF co-regulatory motifs are known to play important roles in gene regulation [15,
16]. A miRNA–TF co-regulatory motif is one in which a TF and a miRNA regulate each other and they both regulate a common target gene (S2 Fig). Starting from SDE genes (case samples versus controls), experimentally verified regulatory relationships among miRNAs, TFs and tar-get genes were identified as follows. First, miRNA-gene regulatory relationships supported by strong experimental evidence (e.g. western blotting, reporter assay and qRT-PCR) were extracted from TarBase (version 6.0) [31], miRTarBase (version 4.5) [32] and miRecords (ver-sion 4) [33] databases. MiRNAs were mapped to mature miRNAs based on miRBase (release 21) [34]. Second, to obtain regulatory relationships of miRNA–TF, a list of 1698 unique human TFs was retrieved from a previous study [25] and the above procedure was imple-mented, thus the relationships between miRNAs and TFs were determined. Third, experimen-tally confirmed TF-gene regulatory relationships were collected from TRED [35] and Transfac (April 2012) [36] databases, and experimentally confirmed TF-miRNA regulatory relations were retrieved from TransmiR (version 1.2) [37].
miRNA
–
TF Co-Regulatory Networks Construction and Analysis
MiRNA-TF co-regulatory networks were constructed by combining identified miRNA–TF co-regulatory motifs. For each time point of MI, the miRNA-TF co-co-regulatory networks were then obtained. To evaluate the importance of a node in the co-regulatory network, degree and betweenness centrality were used as measurements. Degree of a node was the number of edges connected to it. A node was defined as a hub using the method proposed by Yu et al [38]. For a
nodeiin the network, the betweenness centrality (BC) was defined asBCi ¼X
s6¼i6¼t
s
iðs;tÞ
σ(s,t) was the total number of shortest paths from nodesto nodet, andσi(s,t) was the number
of those paths that pass through nodei. The R VennDiagram package was used to plot the Venn diagrams for comparing miRNA–TF co-regulatory networks, and the common and spe-cific nodes and edges in the co-regulatory networks were then analyzed.
Classification of Diagnostic Biomarkers
To examine the classification efficiency of the biomarkers in distinguishing controls from patients, and patients with recurrent events from those without recurrent events, a classifica-tion model based on Naive Bayes was implemented using the Weka system. Naive Bayes classi-fier [39] is one of the most commonly used classifier which is a probabilistic statistical classifier based on Bayes' theorem, and it has been successfully used for clustering and classification in biomedical research [40,41]. The area under the receiving operating curve (AUC) was used to evaluate performance according to previous studies [41,42]. An AUC value ranges from 0 to 1, with 0.5 indicating random performance and 1.0 implying perfect predictive performance. The gene expression profile data of GSE62646 mentioned above were used as training set. The gene expression profile data of GSE48060 from the GEO database were used as an independent test set, which included 21 normal cardiac function controls and 31 acute MI patients. Among the 31 patients, 27 had follow-up data, including five with recurrent events and 22 without any recurrent events over 18-months follow-up. Blood samples from the 21 controls and 31 patients within 48-h post-MI were used for producing gene expression profiles.
Results
Differentially Expressed Genes
After pre-processing of the expression profiles, 8741 protein-coding genes remained for further analysis. We then identified SDE genes (case samples of three time points versus controls) using the R‘limma’package, resulting in 1970 SDE genes over all time points. A total of 1611, 1098 and 939 SDE genes for acute phase, subacute phase and chronic phase of MI were obtained separately (S2 File), and 618 SDE genes were shared by them.
Dynamic Expression Patterns of SDE Genes
We investigated the dynamic changes in expression of the SDE genes at three time points. First, the overall expression changes of these SDE genes were investigated. To demonstrate the results more clearly, we only show the top 100 SDE genes. Further studies were implemented using all SDE genes. Hierarchical clustering on standardized expression values using Cluster3.0 software [43,44] by the city-block distance and complete linkage method was performed. As shown inFig 2(shown by JavaTreeView), two main clusters were identified. Cluster A dis-played rapid down-regulation reaching its lowest point on day 1 after MI, and then slightly increased until 6 months. In contrast, cluster B demonstrated marked up-regulation reaching a plateau on day 1 after MI, and then decreased slowly until 6 months.
Dynamically Functional Analysis of SDE Genes
To investigate dynamic functional changes affected by SDE genes over time, significantly enriched KEGG biological pathways were identified using DAVID [45] based on SDE genes
Fig 2. Hierarchical clustering on standardized expression values of the top 100 SDE genes.Two main clusters were identified, and each cluster included its corresponding gene profiles (grey lines) and mean expression values (dark dots).
(case samples of three time points compared with controls) (S3 Fig). To compare the functional changes at different times, colouring was implemented according to adjustedpvalues. For each pathway, the smallest adjustedpvalue was coloured black, and white denoted that the adjusted
pvalue was not significant or the SDE genes were not enriched in this pathway. Although some well-known and important pathways in MI were identified, including the TGF-βsignalling pathway and apoptosis, the significantly enriched biological pathways were few.
Previous studies have demonstrated that some type-specific functions tend to be distributed in local areas of the pathway (subpathway) instead of the entire pathway, and thus subpathway may provide more detailed explanations for pathogenesis [30,46]. We therefore used Sub-pathwayMiner [30] to identify significantly enriched KEGG subpathways, and 69 significant subpathways were reported (S4 Fig). To illustrate the results more clearly, cancer pathways were removed. As shown inFig 3, the functional pathways were classified into three main cate-gories. Each category had pathways in common with the others, and each category had its own specific pathway. The first and the largest group contained early cellular reactions at the onset of MI, including leukocyte transendothelial migration, the Toll-like receptor signaling pathway, the NFκB signaling pathway, the chemokine signaling pathway and apoptosis, suggesting inflammation, immune response and cell apoptosis. The second group displayed cellular responses in the subacute phase, including the TGF-βsignalling pathway, which are known to play crucial roles in cardiac repair and remodeling [47,48]. Finally, several pathways such as alcoholism, glycosaminoglycan degradation, legionellosis, amyotrophic lateral sclerosis and the Notch signaling pathway were enriched in the chronic phase of MI. Additionally, we noted that certain pathways were shared by these three groups, such as the chemokine signaling path-way and the VEGF signaling pathpath-way.
Dynamic Features of Regulatory Interactions among miRNAs, TFs and
Target Genes in MI Progression
To study the dynamic features of regulatory interactions among miRNAs, TFs and target genes, dynamic miRNA–TF co-regulatory networks for MI were constructed. For each time point of MI, miRNA–TF co-regulatory motifs were identified (Table 1) and then they were merged to construct the miRNA–TF co-regulatory networks (seeMaterials and methods). As demonstrated inFig 4, the network of the acute phase was the largest, and it contained 42 nodes (17 miRNAs, 11 TFs and 17 genes) and 90 edges. Among 11 TF and 17 genes, three com-mon nodes (MYC, TP53 and SPI1) were observed. The network of the subacute phase con-tained 37 nodes (19 miRNAs, 10 TFs and 12 genes) and 85 edges. Among 37 nodes, four nodes (MYC, TP53, SPI1 and E2F1) were common to TFs and genes. The network of the chronic phase only contained 27 nodes (14 miRNAs, eight TFs and eight genes) and 56 edges. Among 27 nodes, three nodes (MYC, TP53 and SPI1) were shared by TFs and genes.
MYB was absent in the chronic phase. These results indicated that, although the different stages after MI shared common hub miRNAs and hub TFs in their miRNA–TF co-regulatory networks, they possessed different regulatory relationships via connection with different genes, which might lead to the different biological processes and phenotypic characteristics.
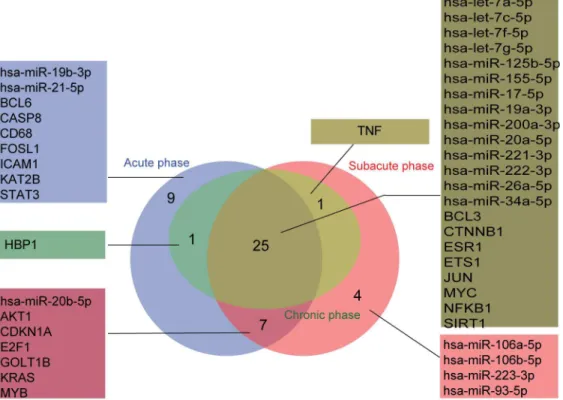
The nodes and the edges in each miRNA–TF co-regulatory network were compared, and common and unique nodes and edges were identified using the R VennDiagram package. As shown in Figs5and6, the network of the chronic phase was contained in the network of the acute and subacute phases. For nodes, the three stages together enjoyed 25 nodes including hsa-miR-155-5p, MYC and NFκB1. Nine nodes were found only in the acute phase, and four nodes were found only in the subacute phase. For edges, 48 common edges were found in the three stages. 24 edges were specific for the acute phase and 15 for the subacute phase.
Furthermore, we examined the stage-specific genetic factors implicated with the develop-ment of MI in more detail. Regulatory interactions among miRNAs, TFs and target genes in three phases of MI were then extracted based on the specific nodes and edges (Fig 7), and regu-latory interactions among miRNAs, TFs and target genes were analyzed. In the acute phase, ICAM1 which was a specific gene, was specifically controlled by multiple miRNAs (miR-21-5p, miR-17-5p and miR-155-5p) and TFs (STAT3, NFκB1, JUN, SPI1 and MYC). Meanwhile, miR-21-5p, STAT3 and ICAM1 formed a network motif in which the nodes and the edges were all specific. In addition, the unique node KAT2B was specifically regulated by miR-19a-3p and miR-19b-miR-19a-3p. At transition stage from acute to subacute phase, three motifs (miR-155-5p, MYB, GOLT1B; let-7a-(miR-155-5p, E2F1, KRAS and miR-20b-(miR-155-5p, ESR1, CDKN1A) were found, in which all the edges and at least two nodes were specific. In the subacute phase, E2F1 not only specifically regulated itself, but also modulated four specific miRNAs (106a-5p, miR-106b-5p, miR-223-3p and miR-93-5p) each other. At the transition from the subacute to chronic phase, TNF was the only unique gene that was specifically regulated by two miRNAs (miR-155-5p and miR-19a-3p) and four TFs (NFκB1, JUN, SPI1 and ESR1). This suggested that certain regulators controlled the expression of certain genes during different stages of MI progression, and this triggered the different pathological mechanisms and clinical features.
Identification of Candidate Diagnostic Biomarkers in MI
Based on the above findings, we found that the motif composed of miR-21-5p, STAT3 and ICAM1 was both specific for nodes and edges, which might play important roles in MI diagno-sis. Thus, the classification model was implemented (seeMaterials and methods). Since the matched miRNA expression profiles were not available, we used the signature defined by STAT3 and ICAM1 as inputs to the Naive Bayes model, and an AUC value of 0.880 was
Fig 3. Dynamic changes of subpathways based on SDE genes.Significantly enriched subpathways (cancer subpathways removed) were obtained using SubpathwayMiner. Colouring was performed based on adjustedp values: black–the smallest adjustedpvalue; white–non-significant (ns,>0.05) or SDE genes were not enriched in this pathway (NA).
doi:10.1371/journal.pone.0158638.g003
Table 1. Summary of miRNA–TF co-regulatory motifs at three time points of MI.
Number of nodes Number of links
Time point Number of motifs miRNAs TFs Genes Total miRNA-gene miRNA-TF TF-gene TF-miRNA Total
1 day 36 17 11 17 42 30 22 26 22 90
4–6 days 38 19 10 12 37 30 26 20 26 85
6 months 22 14 8 8 27 18 17 14 17 56
obtained in the training set by applying leave-one-out cross validation analysis. The signature was also tested in an independent test set (GSE48060), and the classification performance was satisfactory (AUC = 0.713). In addition, we investigated the potential ability of STAT3 and ICAM1 in predicting recurrence of MI by applying expression profiles of GSE48060. As a result, an AUC value of 0.795 was obtained (Table 2).
Discussion
Dynamic data of a biological system could provide more valuable information in elucidating complex gene regulation mechanisms underlying biological processes than data of single con-ditions. In this study, we systematically investigated the dynamic features in MI progression by integrating miRNA–TF co-regulatory networks and time-series gene expression data. Dynamic expression patterns were analyzed and biological functions associated with each MI stage were identified. Additionally, dynamic interplay of miRNAs, TFs and target genes were analyzed, and a new candidate diagnostic signature defined by STAT3 and ICAM1 was identified.
We identified different biological pathways at different MI stage. For chronic phase of MI, several pathways such as alcoholism, glycosaminoglycan degradation, legionellosis, amyotro-phic lateral sclerosis and the Notch signaling pathway were enriched. Among these pathways,
Fig 4. MiRNA–TF co-regulatory networks in MI progression.(A). Acute phase. This network consisted of 42 nodes and 90 links. (B). Subacure phase. This network consisted of 37 nodes and 85 links. (C). Chronic phase. This network consisted of 27 nodes and 56 links. Round rectangles denote miRNAs, circles denote genes, and triangles denote TFs. The nodes with yellow border indicate both genes and TFs.
the alcoholism pathway was significantly enriched, and acute MI triggered by alcohol con-sumption has been reported [49]. So it is possible that alcoholism is related with heart disease, and heart disease patients may be more inclined to make dietary changes to prevent occurrence
Fig 5. Comparison of nodes in miRNA–TF co-regulatory networks in MI progression (acute, subacute and chronic phases).
doi:10.1371/journal.pone.0158638.g005
Fig 6. Comparison of edges in miRNA–TF co-regulatory networks in MI progression (acute, subacute and chronic phases).‘inh’
of future infarcts. The adjustedpvalues of the other four pathways (glycosaminoglycan degra-dation, legionellosis, amyotrophic lateral sclerosis and Notch signaling pathway) were margin-ally significant. However, previous studies have shown that glycosaminoglycans are key molecules in atherosclerosis [50] and Notch signalling is an important mediator of cardiac repair and regeneration after MI [51]. Legionellosis and amyotrophic lateral sclerosis have complex relationships with MI [52,53].
Fig 7. Graphical representation of dynamic regulatory interactions among miRNAs, TFs and target genes in MI progression based on stage-specific nodes and edges.The nodes with red symbols represented the stage-specific nodes. For example, KAT2B was the unique gene in the acute phase, and MYB was the specific gene in the acute and subacute phases. The edges represented by solid lines were stage-specific, while the edges represented by dotted lines were not found in corresponding stages. For example, E2F1 regulation miR-106b-5p was specific in the subacute phase, and TNF was inhibited by miR-155-5p only in the subacute and chronic phases.
The dynamic miRNA–TF co-regulatory networks were constructed based on experimen-tally verified regulatory relationships among miRNAs, TFs and target genes. Here, we focused on the accuracy but not the coverage, and thus the predicted data were not used. However, the experimentally confirmed regulatory relationships were neither complete nor unbiased, and these data did not include time point information that might affect the accuracy of the net-works. With an improvement of the quantity and quality of these data and the availability of matched mRNA, miRNA and long non-coding RNA expression profiles measured at multiple time points, the dynamic features in MI progression will be comprehensively and accurately researched at a system level.
The classification performances of single STAT3 or ICAM1 were also tested. For distin-guishing patients with or without MI, both single STAT3 and ICAM1 obtained lower AUC val-ues in the training set (0.821 for STAT3 and 0.842 for ICAM1) and a bit higher AUC valval-ues in the testing set (0.718 for STAT3 and 0.741 for ICAM1) than their combinations (Table 2). For distinguishing MI patients with or without recurrent events, both single STAT3 and ICAM1 obtained lower AUC values (0.765 for STAT3 and 0.678 for ICAM1) than their combinations (Table 2). Simultaneously, we noted that the dataset available for performance evaluation was limited, and confirmation in a large independent cohort and experimental verification are war-ranted. Additionally, gene expression profile data we used was measured from peripheral blood mononuclear cells but not from myocardial tissues. This means that the dynamic fea-tures we obtained may be indirectly caused by MI.
Our research revealed the dynamic architecture and features in MI progression at several levels, including expression, biological function, and regulatory interactions at the transcrip-tional and post-transcriptranscrip-tional levels. Especially, a new panel of candidate diagnostic biomark-ers defined by STAT3 and ICAM1 was identified to have discriminatory capability for patients with or without MI, especially the patients with or without recurrent events. All these results provide important clues for greater understanding of the dynamic regulatory mechanisms in MI progression, and could provide new diagnostic biomarkers for MI.
Supporting Information
S1 Fig. Dynamic changes of pathways based on SDE genes.Significantly enriched pathways were obtained using DAVID. Colouring was performed based on adjusted p values: black–the smallest adjustedpvalue; white–non-significant (ns,>= 0.05) or SDE genes were not enriched in this pathway (NA).
(TIF)
S2 Fig. A miRNA–TF co-regulatory motif.A TF and a miRNA regulate each other and they both regulate a common target gene.
(TIF)
Table 2. Classification performance of the combination of STAT3, ICAM1 and single STAT3 or ICAM1 based on leave-one-out cross validation analysis.
Inputs STAT3, ICAM1 STAT3 ICAM1
*Training set (AUC) 0.880 0.821 0.842
*Independent test set (AUC) 0.713 0.718 0.741
4Independent test set (AUC) 0.795 0.765 0.678
Note:‘*’denotes the data set for distinguishing patients with or without MI.‘4’indicates the data set for distinguishing MI patients with or without recurrent events.
S3 Fig. Expression changes of top 1% SDE genes (six genes).The y-axis represented stan-dardized expression values, while the x-axis represented time points.
(TIF)
S4 Fig. Dynamic changes of subpathway based on SDE genes.Significantly enriched sub-pathways were obtained using SubpathwayMiner. Colouring was as described above. (EPS)
S1 File. Significantly enriched subpathways.
(XLS)
S2 File. Differentially expressed genes.
(XLSX)
S3 File. Degree and betweenness centrality of each node in the miRNA–TF co-regulatory
networks.
(XLSX)
Author Contributions
Conceived and designed the experiments: WML HBS GDZ. Performed the experiments: HBS GDZ JW ZZW. Analyzed the data: JW XXL LC. Wrote the paper: HBS GDZ WML.
References
1. Mozaffarian D, Benjamin EJ, Go AS, Arnett DK, Blaha MJ, Cushman M, et al. Heart Disease and Stroke Statistics-2015 Update: A Report From the American Heart Association. Circulation. 2014. PMID:
25520374.
2. Gallogly MM, Shelton MD, Qanungo S, Pai HV, Starke DW, Hoppel CL, et al. Glutaredoxin regulates apoptosis in cardiomyocytes via NFkappaB targets Bcl-2 and Bcl-xL: implications for cardiac aging. Antioxid Redox Signal. 2010; 12(12):1339–53. PMID:19938943. doi:10.1089/ars.2009.2791
3. Roy S, Khanna S, Hussain SR, Biswas S, Azad A, Rink C, et al. MicroRNA expression in response to murine myocardial infarction: miR-21 regulates fibroblast metalloprotease-2 via phosphatase and ten-sin homologue. Cardiovasc Res. 2009; 82(1):21–9. PMID:19147652. doi:10.1093/cvr/cvp015
4. Bar-Joseph Z, Gitter A, Simon I. Studying and modelling dynamic biological processes using time-series gene expression data. Nat Rev Genet. 2012; 13(8):552–64. PMID:22805708. doi:10.1038/ nrg3244
5. Turner M. Is transcription the dominant force during dynamic changes in gene expression? Adv Exp Med Biol. 2011; 780:1–13. PMID:21842360.
6. Port JD, Walker LA, Polk J, Nunley K, Buttrick PM, Sucharov CC. Temporal expression of miRNAs and mRNAs in a mouse model of myocardial infarction. Physiol Genomics. 2011; 43(19):1087–95. PMID:
21771878. doi:10.1152/physiolgenomics.00074.2011
7. Reinsbach S, Nazarov PV, Philippidou D, Schmitt M, Wienecke-Baldacchino A, Muller A, et al. Dynamic regulation of microRNA expression following interferon-gamma-induced gene transcription. RNA Biol. 2012; 9(7):978–89. PMID:22767256. doi:10.4161/rna.20494
8. Nazarov PV, Reinsbach SE, Muller A, Nicot N, Philippidou D, Vallar L, et al. Interplay of microRNAs, transcription factors and target genes: linking dynamic expression changes to function. Nucleic Acids Res. 2013; 41(5):2817–31. PMID:23335783. doi:10.1093/nar/gks1471
9. Dymacek J, Snyder-Talkington BN, Porter DW, Mercer RR, Wolfarth MG, Castranova V, et al. mRNA and miRNA regulatory networks reflective of multi-walled carbon nanotube-induced lung inflammatory and fibrotic pathologies in mice. Toxicol Sci. 2015; 144(1):51–64. PMID:25527334. doi:10.1093/ toxsci/kfu262
10. Li Y, Jin S, Lei L, Pan Z, Zou X. Deciphering deterioration mechanisms of complex diseases based on the construction of dynamic networks and systems analysis. Sci Rep. 2015; 5:9283. PMID:25788156. doi:10.1038/srep09283
12. Vidal M, Cusick ME, Barabasi AL. Interactome networks and human disease. Cell. 2011; 144(6):986– 98. PMID:21414488. doi:10.1016/j.cell.2011.02.016
13. Barabasi AL, Gulbahce N, Loscalzo J. Network medicine: a network-based approach to human dis-ease. Nat Rev Genet. 2011; 12(1):56–68. PMID:21164525. doi:10.1038/nrg2918
14. Bartel DP. MicroRNAs: target recognition and regulatory functions. Cell. 2009; 136(2):215–33. PMID:
19167326. doi:10.1016/j.cell.2009.01.002
15. Tsang J, Zhu J, van Oudenaarden A. MicroRNA-mediated feedback and feedforward loops are recur-rent network motifs in mammals. Mol Cell. 2007; 26(5):753–67. PMID:17560377.
16. Shalgi R, Lieber D, Oren M, Pilpel Y. Global and local architecture of the mammalian microRNA-tran-scription factor regulatory network. PLoS Comput Biol. 2007; 3(7):e131. PMID:17630826.
17. Zhang HM, Kuang S, Xiong X, Gao T, Liu C, Guo AY. Transcription factor and microRNA co-regulatory loops: important regulatory motifs in biological processes and diseases. Brief Bioinform. 2015; 16 (1):45–58. PMID:24307685. doi:10.1093/bib/bbt085
18. Arora S, Rana R, Chhabra A, Jaiswal A, Rani V. miRNA-transcription factor interactions: a combinato-rial regulation of gene expression. Mol Genet Genomics. 2013; 288(3–4):77–87. PMID:23334784. doi:
10.1007/s00438-013-0734-z
19. Sun J, Gong X, Purow B, Zhao Z. Uncovering MicroRNA and Transcription Factor Mediated Regulatory Networks in Glioblastoma. PLoS Comput Biol. 2012; 8(7):e1002488. PMID:22829753. doi:10.1371/ journal.pcbi.1002488
20. Ye H, Liu X, Lv M, Wu Y, Kuang S, Gong J, et al. MicroRNA and transcription factor co-regulatory net-work analysis reveals miR-19 inhibits CYLD in T-cell acute lymphoblastic leukemia. Nucleic Acids Res. 2012; 40(12):5201–14. PMID:22362744. doi:10.1093/nar/gks175
21. Yan Z, Shah PK, Amin SB, Samur MK, Huang N, Wang X, et al. Integrative analysis of gene and miRNA expression profiles with transcription factor-miRNA feed-forward loops identifies regulators in human cancers. Nucleic Acids Res. 2012; 40(17):e135. PMID:22645320.
22. Qin S, Ma F, Chen L. Gene regulatory networks by transcription factors and microRNAs in breast can-cer. Bioinformatics. 2015; 31(1):76–83. PMID:25189779. doi:10.1093/bioinformatics/btu597
23. Peng C, Wang M, Shen Y, Feng H, Li A. Reconstruction and analysis of transcription factor-miRNA co-regulatory feed-forward loops in human cancers using filter-wrapper feature selection. PLoS One. 2013; 8(10):e78197. PMID:24205155. doi:10.1371/journal.pone.0078197
24. Lin Y, Sibanda VL, Zhang HM, Hu H, Liu H, Guo AY. MiRNA and TF co-regulatory network analysis for the pathology and recurrence of myocardial infarction. Sci Rep. 2015; 5:9653. PMID:25867756. doi:
10.1038/srep09653
25. Zhang G, Shi H, Wang L, Zhou M, Wang Z, Liu X, et al. MicroRNA and Transcription Factor Mediated Regulatory Network Analysis Reveals Critical Regulators and Regulatory Modules in Myocardial Infarc-tion. PLoS One. 2015; 10(8):e0135339. PMID:26258537. doi:10.1371/journal.pone.0135339
26. Kiliszek M, Burzynska B, Michalak M, Gora M, Winkler A, Maciejak A, et al. Altered gene expression pattern in peripheral blood mononuclear cells in patients with acute myocardial infarction. PLoS One. 2012; 7(11):e50054. PMID:23185530. doi:10.1371/journal.pone.0050054
27. Soong TT, Wrzeszczynski KO, Rost B. Physical protein-protein interactions predicted from microar-rays. Bioinformatics. 2008; 24(22):2608–14. PMID:18829707. doi:10.1093/bioinformatics/btn498
28. Hu J, Wan J, Hackler L Jr., Zack DJ, Qian J. Computational analysis of tissue-specific gene networks: application to murine retinal functional studies. Bioinformatics. 2010; 26(18):2289–97. PMID:
20616386. doi:10.1093/bioinformatics/btq408
29. Tian W, Liu J, Pei B, Wang X, Guo Y, Yuan L. Identification of miRNAs and differentially expressed genes in early phase non-small cell lung cancer. Oncol Rep. 2016; 35(4):2171–6. PMID:26781349. doi:10.3892/or.2016.4561
30. Li C, Li X, Miao Y, Wang Q, Jiang W, Xu C, et al. SubpathwayMiner: a software package for flexible identification of pathways. Nucleic Acids Res. 2009; 37(19):e131. PMID:19706733. doi:10.1093/nar/ gkp667
31. Vergoulis T, Vlachos IS, Alexiou P, Georgakilas G, Maragkakis M, Reczko M, et al. TarBase 6.0: cap-turing the exponential growth of miRNA targets with experimental support. Nucleic Acids Res. 2011; 40 (Database issue):D222–9. PMID:22135297. doi:10.1093/nar/gkr1161
32. Hsu SD, Tseng YT, Shrestha S, Lin YL, Khaleel A, Chou CH, et al. miRTarBase update 2014: an infor-mation resource for experimentally validated miRNA-target interactions. Nucleic Acids Res. 2014; 42 (Database issue):D78–85. PMID:24304892. doi:10.1093/nar/gkt1266
34. Kozomara A, Griffiths-Jones S. miRBase: integrating microRNA annotation and deep-sequencing data. Nucleic Acids Res. 2011; 39(Database issue):D152–7. PMID:21037258. doi:10.1093/nar/gkq1027
35. Jiang C, Xuan Z, Zhao F, Zhang MQ. TRED: a transcriptional regulatory element database, new entries and other development. Nucleic Acids Res. 2007; 35(Database issue):D137–40. PMID:17202159. 36. Matys V, Fricke E, Geffers R, Gossling E, Haubrock M, Hehl R, et al. TRANSFAC: transcriptional
regu-lation, from patterns to profiles. Nucleic Acids Res. 2003; 31(1):374–8. PMID:12520026.
37. Wang J, Lu M, Qiu C, Cui Q. TransmiR: a transcription factor-microRNA regulation database. Nucleic Acids Res. 2010; 38(Database issue):D119–22. PMID:19786497. doi:10.1093/nar/gkp803
38. Yu H, Greenbaum D, Xin Lu H, Zhu X, Gerstein M. Genomic analysis of essentiality within protein net-works. Trends Genet. 2004; 20(6):227–31. PMID:15145574.
39. Jansen R, Yu H, Greenbaum D, Kluger Y, Krogan NJ, Chung S, et al. A Bayesian networks approach for predicting protein-protein interactions from genomic data. Science. 2003; 302(5644):449–53. PMID:
14564010.
40. Rhodes DR, Tomlins SA, Varambally S, Mahavisno V, Barrette T, Kalyana-Sundaram S, et al. Probabi-listic model of the human protein-protein interaction network. Nat Biotechnol. 2005; 23(8):951–9. PMID:
16082366.
41. Linghu B, Snitkin ES, Hu Z, Xia Y, Delisi C. Genome-wide prioritization of disease genes and identifica-tion of disease-disease associaidentifica-tions from an integrated human funcidentifica-tional linkage network. Genome Biol. 2009; 10(9):R91. PMID:19728866. doi:10.1186/gb-2009-10-9-r91
42. Azuaje FJ, Rodius S, Zhang L, Devaux Y, Wagner DR. Information encoded in a network of inflamma-tion proteins predicts clinical outcome after myocardial infarcinflamma-tion. BMC Med Genomics. 2011; 4:59. PMID:21756327. doi:10.1186/1755-8794-4-59
43. de Hoon MJ, Imoto S, Nolan J, Miyano S. Open source clustering software. Bioinformatics. 2004; 20 (9):1453–4. PMID:14871861.
44. Eisen MB, Spellman PT, Brown PO, Botstein D. Cluster analysis and display of genome-wide expres-sion patterns. Proc Natl Acad Sci U S A. 1998; 95(25):14863–8. PMID:9843981.
45. Huang da W, Sherman BT, Lempicki RA. Systematic and integrative analysis of large gene lists using DAVID bioinformatics resources. Nat Protoc. 2009; 4(1):44–57. PMID:19131956. doi:10.1038/nprot. 2008.211
46. Li X, Jiang W, Li W, Lian B, Wang S, Liao M, et al. Dissection of human MiRNA regulatory influence to subpathway. Brief Bioinform. 2012; 13(2):175–86. PMID:21908864. doi:10.1093/bib/bbr043
47. Lu Y, Liu JJ, Bi XY, Yu XJ, Kong SS, Qin FF, et al. Pyridostigmine ameliorates cardiac remodeling induced by myocardial infarction via inhibition of the transforming growth factor-beta1/TGF-beta1-acti-vated kinase pathway. J Cardiovasc Pharmacol. 2014; 63(5):412–20. PMID:24805145. doi:10.1097/ FJC.0000000000000062
48. Wang ZF, Wang NP, Harmouche S, Philip T, Pang XF, Bai F, et al. Postconditioning promotes the car-diac repair through balancing collagen degradation and synthesis after myocardial infarction in rats. Basic Res Cardiol. 2013; 108(1):318. PMID:23203208. doi:10.1007/s00395-012-0318-9
49. Hsu PC, Chu CS, Lin TH, Su HM, Yen HW, Lai WT, et al. Alcohol drinking triggers acute myocardial infarction in a case of hypertrophic obstructive cardiomyopathy. Kaohsiung J Med Sci. 2011; 27 (5):195–8. PMID:21527187. doi:10.1016/j.kjms.2010.08.003
50. Karangelis DE, Kanakis I, Asimakopoulou AP, Karousou E, Passi A, Theocharis AD, et al. Glycosami-noglycans as key molecules in atherosclerosis: the role of versican and hyaluronan. Curr Med Chem. 2010; 17(33):4018–26. PMID:20939824.
51. Li Y, Hiroi Y, Liao JK. Notch signaling as an important mediator of cardiac repair and regeneration after myocardial infarction. Trends Cardiovasc Med. 2010; 20(7):228–31. PMID:22293023. doi:10.1016/j. tcm.2011.11.006
52. Yamauchi T, Yamamoto S, Fukumoto M, Oyama N, Nakano A, Nakayama T, et al. [Early manifestation of septic shock and disseminated intravascular coagulation complicated by acute myocardial infarction in a patient suspected of having Legionnaires' disease]. Kansenshogaku Zasshi. 1998; 72(3):286–92. PMID:9585703.