Bromodomain Proteins Contribute to
Maintenance of Bloodstream Form Stage
Identity in the African Trypanosome
Danae Schulz1, Monica R. Mugnier1, Eda-Margaret Paulsen2, Hee-Sook Kim1, Chun-wa W. Chung3, David F. Tough4, Inmaculada Rioja4, Rab K. Prinjha4, F. Nina Papavasiliou1*, Erik W. Debler2
1Laboratory of Lymphocyte Biology, The Rockefeller University, New York, New York, United States of America,2Laboratory of Cell Biology, The Rockefeller University, New York, New York, United States of America,3Computational and Structural Chemistry, GlaxoSmithKline R&D, Medicines Research Centre, Stevenage, United Kingdom,4Epinova DPU, Immuno-Inflammation Therapy Area, GlaxoSmithKline, Medicines Research Centre, Stevenage, United Kingdom
Abstract
Trypanosoma brucei, the causative agent of African sleeping sickness, is transmitted to its mammalian host by the tsetse. In the fly, the parasite’s surface is covered with invariant pro-cyclin, while in the mammal it resides extracellularly in its bloodstream form (BF) and is densely covered with highly immunogenic Variant Surface Glycoprotein (VSG). In the BF, the parasite varies this highly immunogenic surface VSG using a repertoire of ~2500 distinct
VSGgenes. Recent reports in mammalian systems point to a role for histone acetyl-lysine recognizing bromodomain proteins in the maintenance of stem cell fate, leading us to hypothesize that bromodomain proteins may maintain the BF cell fate in trypanosomes. Using small-molecule inhibitors and genetic mutants for individual bromodomain proteins, we performed RNA-seq experiments that revealed changes in the transcriptome similar to those seen in cells differentiating from the BF to the insect stage. This was recapitulated at the protein level by the appearance of insect-stage proteins on the cell surface. Further-more, bromodomain inhibition disrupts two major BF-specific immune evasion mechanisms that trypanosomes harness to evade mammalian host antibody responses. First, monoalle-lic expression of the antigenically varied VSG is disrupted. Second, rapid internalization of antibodies bound to VSG on the surface of the trypanosome is blocked. Thus, our studies reveal a role for trypanosome bromodomain proteins in maintaining bloodstream stage identity and immune evasion. Importantly, bromodomain inhibition leads to a decrease in virulence in a mouse model of infection, establishing these proteins as potential therapeutic drug targets for trypanosomiasis. Our 1.25Åresolution crystal structure of a trypanosome bromodomain in complex with I-BET151 reveals a novel binding mode of the inhibitor, which serves as a promising starting point for rational drug design.
OPEN ACCESS
Citation:Schulz D, Mugnier MR, Paulsen E-M, Kim H-S, Chung C-wW, Tough DF, et al. (2015) Bromodomain Proteins Contribute to Maintenance of Bloodstream Form Stage Identity in the African Trypanosome. PLoS Biol 13(12): e1002316. doi:10.1371/journal.pbio.1002316
Academic Editor:Vern B. Carruthers, University of Michigan, UNITED STATES
Received:May 11, 2015
Accepted:October 30, 2015
Published:December 8, 2015
Copyright:© 2015 Schulz et al. This is an open access article distributed under the terms of the
Creative Commons Attribution License, which permits unrestricted use, distribution, and reproduction in any medium, provided the original author and source are credited.
Author Summary
Many parasites undergo major changes in lifestyle as they cycle between their vectors and their hosts. We useTrypanosoma brucei, the causative agent of human and animal African Trypanosomiasis, as a model to study how these changes are regulated and maintained at the level of gene expression.T.bruceilives in the bloodstream of the mammalian host before migrating to the insect through the bite of its insect vector, the tsetse fly. It escapes immune detection by varying the proteins on its surface and by rapidly internalizing host antibodies. We report here that a class of proteins, called bromodomain proteins, help maintain the identity of the parasite in its bloodstream form. When these proteins are inhibited, the parasites express an unvarying epitope that is usually expressed only at the insect stage and are compromised in their ability to internalize host antibodies. Bromodo-main proteins bind to DNA that is wrapped around histone proteins, acting as mediators that interact with the transcription machinery to determine which genes are turned on and which are kept repressed. Our crystal structure of a bromodomain inhibitor in com-plex with a trypanosome bromodomain reveals a novel binding mode and demonstrates how these small molecule inhibitors could be optimized for therapeutic use in a parasite-specific manner.
Introduction
Trypanosoma bruceiis a unicellular, protozoan parasite and the causative agent of Human
African Trypanosomiasis (sleeping sickness). It also causes n'agana in cattle, a disease that imposes a severe economic burden in affected areas. The life cycle ofTrypanosoma brucei
requires adaptation to two distinct habitats: the fly (tsetse) and the bloodstream of its mamma-lian hosts. Within these habitats, the parasite assumes a succession of proliferative and quies-cent developmental forms, which vary widely in metabolism, motility, and composition of the surface coat that covers the plasma membrane. In the fly, the trypanosome first resides in the midgut in its procyclic form (PF), where its surface is coated with a group of proteins collec-tively termed procyclins, and then in the salivary glands in its metacyclic form, where surface procyclin is replaced with a dense coat of Variant Surface Glycoprotein (VSG). The bite of the tsetse transmits the parasite to the mammalian host, where it resides extracellularly in its bloodstream form (BF) and continues to express VSG. The parasite relies on two strategies to evade the mammalian host antibody response. First, it varies (“switches”) its highly immuno-genic surface antigen, using a repertoire of ~2,500 distinctVSGgenes [1]. Only oneVSGis expressed at a time (monoallelic expression), and host antibodies mounted against the initially expressed VSG must be continually replaced by antibodies against antigenically distinct VSGs, resulting in waves of parasitemia in the infected host [2,3]. Second, antibodies bound to surface VSG are rapidly internalized by the parasite [4], giving host effector cells less time to recognize and eliminate it. When trypanosomes enter the midgut of the tsetse following a bloodmeal, a temperature drop and an increase in acidity function cooperatively to induce differentiation from the BF to the PF. Together with remodeling of the parasite surface to replace VSG with procyclin, there are a number of cytoskeletal changes that occur, and the kinetoplast is reposi-tioned. There is also a drastic change in metabolism as the trypanosomes leave the glucose-rich environment of the blood and transition to the fly midgut, where they are more reliant on mitochondrion Krebs cycle enzymes and respiratory chain and oxidative phosphorylation enzymes (reviewed in [5]).
SAMN03976315, SAMN03976316, SAMN03976317, SAMN03976318, SAMN03976319.
Funding:DS is supported by an NIH postdoctoral fellowship (NIH/GM103214) and EWD was a Frey Fellow of the Damon Runyon Cancer Research Foundation. This work was funded by a Bill and Melinda Gates Foundation GCE grant to DS and EWD (CEN5401889), and NIH/NIAID grant AI085973 to FNP. Data were measured at beamline X29 at NSLS, supported by NIH grants P41GM103473 and P30-EB-00998. IR, DFT, RKP and CWC are employees of GlaxoSmithKline. The funders had no role in study design, data collection and analysis, decision to publish, or preparation of the manuscript.
Competing Interests:I have read the journal's policy and the authors of this manuscript have the following competing interests. IR, DT, RP, and CC are employees of GlaxoSmithKline, but should have no competing interests in the context of the work presented here.
Trypanosomes are unusual in that they are eukaryotes that transcribe their genome from polycistronic transcription units (PTUs) that often contain functionally unrelated genes. Thus, much regulation of gene expression occurs at the post-transcriptional level. With respect to differentiation, it is clear that the 3’UTRs of procyclin andVSGgenes contribute to their devel-opmental regulation [6–8], and that RNA binding zinc-finger proteins also play a role in specifying a differentiation program [9]. Many recent studies have shown that there are large changes in gene expression at the mRNA level during differentiation [10–12]. While develop-mental changes in gene expression have been examined at the level of mRNA stability and association with the translation machinery, the mechanisms by which these changes are medi-ated at the DNA level are not well understood. The fact that trypanosomes have recognizable histones, histone modifications, and orthologues of many of the chromatin-interacting pro-teins found in other, more familiar model systems made us wonder whether differentiation from the BF to the PF may be epigenetically regulated. As epigenetic modifications are revers-ible, this would confer the plasticity necessary to maximize fitness according to environmental input [13], allowing cells to be poised to move forward in development, but not until the receipt of the appropriate environmental signals. In mammals, bromodomain and extraterminal domain (BET) family members that recognize histone lysine acetylation through their bromo-domains are necessary to maintain murine embryonic stem cell pluripotency [14,15], and differentiation can be rapidly induced by subjecting cells to treatment with highly selective bromodomain inhibitors [16]. Chromatin-interacting proteins inT.bruceihave thus far been studied primarily in the context of monoallelicVSGexpression and switching [17–20], but less is known about their potential role in lifecycle differentiation.
Here, we report that acetyl-lysine (AcK) recognizing bromodomain proteins maintain the BF cell fate in trypanosomes. Using both small molecule inhibitors and genetic mutants of indi-vidual bromodomain proteins, we demonstrate that bromodomain inhibition results in gene expression changes that mimic those seen naturally in cells differentiating from the BF to the insect stage following a bloodmeal and transition to the fly midgut. Transcriptional changes are recapitulated at the protein level by the appearance of insect-stage procyclin on the cell sur-face. BF-specific processes, including monoallelic expression ofVSGgenes and rapid surface-bound antibody internalization are also compromised, establishingT.bruceibromodomain proteins as attractive therapeutic targets for trypanosomiasis. Indeed, bromodomain inhibition decreases virulence in an in vivo mouse model. Our crystal structure of a trypanosome bromo-domain in complex with an inhibitor revealed marked differences in the AcK recognition site to its human counterparts, consistent with a novel binding mode of the inhibitor, which can now be exploited to develop trypanosome-specific, high-affinity drugs against
trypanosomiasis.
Results
Bromodomain Inhibition Increases Insect Stage-Specific Transcripts and
Decreases Bloodstream-Specific Transcripts
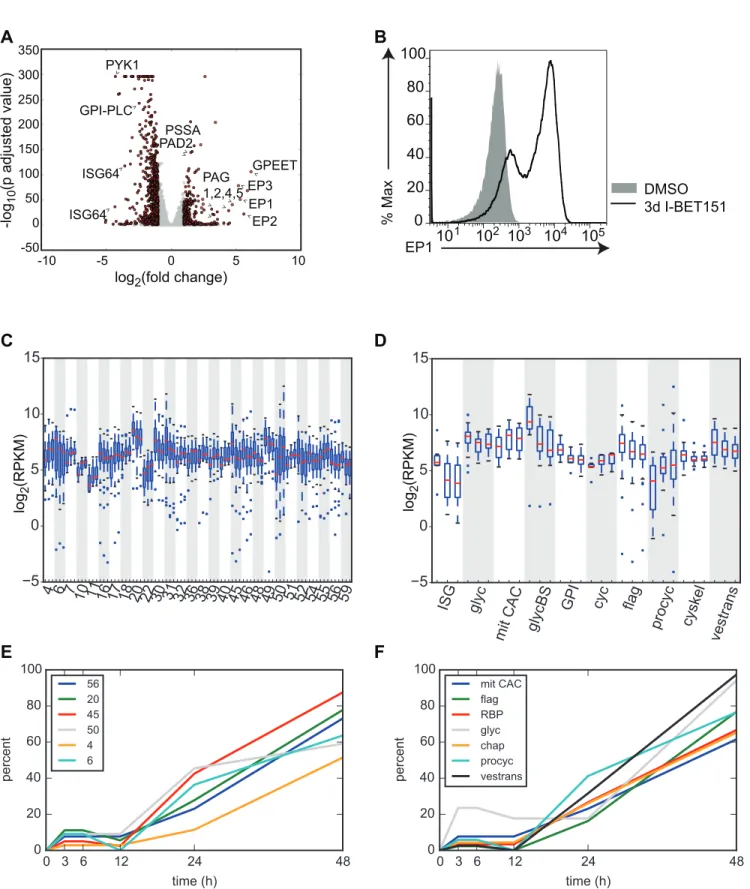
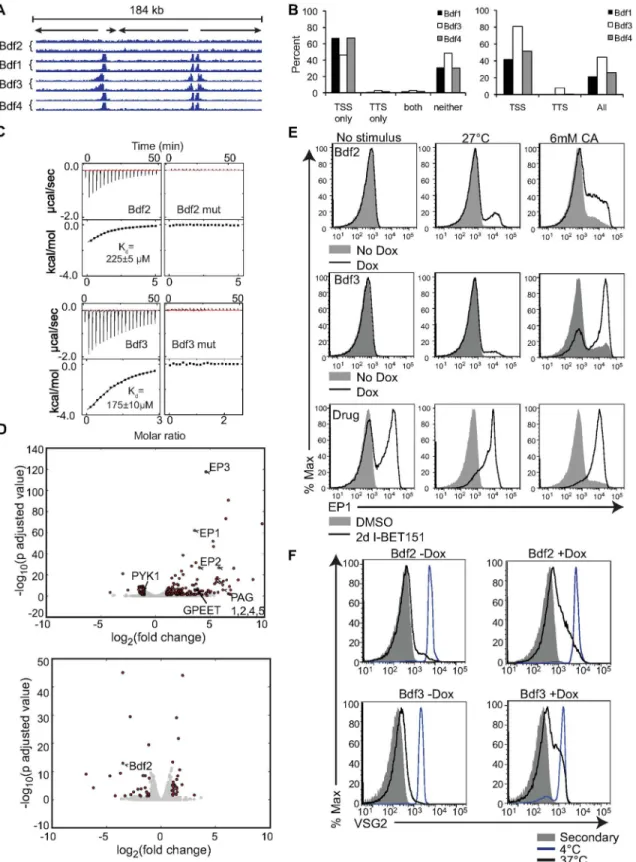
were subjected to either two days or three days of treatment with I-BET151 and compared to DMSO-treated cells. The RNA-seq libraries were prepared in triplicate from three independent cultures for each treatment using polyA+ selection. We used DESeq analysis [24] to identify the top up-regulated and down-regulated genes following I-BET151 treatment. A list of these genes along with their associated multiple testing correctedp-adjusted values are listed in Additional_File_1 and Additional_File_2 inS1 Data. We used the log-fold changes andp -adjusted values from the DESeq analysis on I-BET151 cells treated for 3 d to generate the vol-cano plot shown inFig 1A. Strikingly, I-BET151 treatment resulted in a strong up-regulation of a number of genes expressed only in the insect-residing PF form, including procyclins (
EP1-3andGPEET), procyclin-associated genes (PAG1,2,4,5), procyclin stage surface antigen
(PSSA), and protein associated with differentiation 2 (PAD2). We also observed a marked down-regulation of genes whose expression is normally higher in the mammalian BF, such as
ISG64,PYK1, andGPI-PLC(Fig 1A). To confirm whether the up-regulation in transcription of
EP1was reflected at the protein level, we performed flow cytometry experiments to ask whether EP1 was expressed on the surface of the cells. Indeed, a large proportion of I-BET151-treated trypanosomes expressed EP1 after 3 d of treatment, while this was not the case for vehicle-treated controls (Fig 1B). We conclude that bromodomain proteins are important for main-taining a BF-specific cell surface landscape.
Previous studies identified genome-wide changes in gene expression during differentiation from the BF to the PF and organized them both by hierarchical clustering of genes that varied with similar kinetics (clusters) and by functional group [12]. Each cluster contains a group of genes of both known and unknown function that were shown to change by roughly the same magnitude and with the same timing throughout differentiation. These genes are sometimes but not always functionally related. For example, about half the genes in cluster 30 are flagellar genes, but the remainder fall into different functional groups or have unknown function. Con-versely, several flagellar genes are found in other clusters based on their pattern of expression. To analyze these same clusters of genes, we used a Gene Set Enrichment Analysis (GSEA) algo-rithm generated by the Broad Insitute at MIT [25] (http://www.broad.mit.edu/gsea). This algo-rithm generates an Enrichment Score that estimates the degree to which a given set of genes is over-represented within the total set of the most highly up-regulated or down-regulated genes. It also provides an Estimation of Significance level and corrects for multiple hypothesis testing to generate a false discovery rate (FDR). A list of the genes contained within each cluster is listed in Additional_File_3 inS1 DataandS12 Table. We analyzed our RNA-seq datasets com-paring 2-d I-BET151-treated cells to control cells using GSEA enrichment with the clusters generated in [12].S1 Tableshows each cluster and its associated enrichment score and FDR for the 2-d I-BET151-treated dataset. To get a sense of how many of the genes within each cluster were moving coordinately in the same direction (up or down with respect to untreated cells), we conducted an additional analysis that determined the percent of genes up-regulated or down-regulated by 1.1-fold within each cluster in I-BET151-treated cells.S1 Tableincludes these percentages. We generated a list of clusters that had a GSEA generated FDR of<0.1 and
for which>70% of the genes were up-regulated or down-regulated following treatment with
Fig 1. Trypanosome bromodomain proteins maintain a BF-specific transcriptome.(A) Volcano plot showing the most significant up- and down-regulated genes in the trypanosome genome from an RNA-seq experiment comparing cells treated for 3 d with I-BET151 to control DMSO-treated cells. DESeq was used to normalize counts, compute log2(fold change) of treated cells over untreated cells, and calculatep-adjusted values. Dots in red indicate
3-d-treated cells (e.g., 11, 46, 56). We conclude that gene expression changes that take place during differentiation for roughly half (31) of the clusters in the previous study were mirrored in I-BET151-treated cells.
Queiroz et al. also organized groups of genes that change throughout differentiation by their annotated function. These groups and their abbreviations are listed in Additional_File_4 inS1 DataandS12 Table. We performed the same analysis described above on these groups of genes and each functional group’s GSEA scores are listed inS2 Table. We generated boxplots for the ten functional groups that met our criteria for differential expression following treatment with I-BET151 (<0.1 GSEA FDR and>70% of genes up- or down-regulated)(Fig 1D,S2 Table). For
example, during the transition from the BF to the PF, trypanosomes down-regulate genes required for high rates of glucose and glycerol metabolism (denoted as glycBS inFig 1D) as they leave the glucose-rich environment of the blood and transition to the midgut of the fly. Other genes in the glycosomal pathway that are not involved in the pentose phosphate pathway are also down-regulated (denoted as glyc inFig 1D). Cells undergoing differentiation also up-regulate many of the genes involved in the citric acid cycle (denoted as mit CAC inFig 1D). We find these changes reflected in I-BET151-treated cells (Fig 1D,S2 Table). Notably, genes found in the procyclin-specific transcription unit (denoted as procyc inFig 1D) were also up-regulated upon treatment with I-BET151 (Fig 1D,S2 Table). Other previously identified func-tional groups that met our criteria for differential expression in I-BET151-treated cells include the invariant surface glycoproteins (ISGs), genes involved in cell cycle (cyc), genes associated with glycosyl phosphatidylinositol metabolism (GPI), cytoskeletal genes (cyskel), flagellar genes, and genes associated with intracellular protein and vesicular transport pathways (ves-trans) (Fig 1D). We conclude that with respect to transcription, bromodomain inhibited cells share some similarities to differentiating cells.
A Temporal Analysis of I-BET151-Treated Cells
In order to compare the changes in gene expression that take place in I-BET151-treated cells with those that take place during differentiation, we performed a more extensive RNA-seq time course of I-BET151 treatment that included earlier time points than had been analyzed previ-ously, at 3, 6, 12, and 24 h. As above, RNA-seq libraries were generated in triplicate using poly-A+ selection. First, we performed GSEA analysis using the Pearson metric for ranking genes in a time series (http://www.broadinstitute.org/gsea/doc/GSEAUserGuideFrame.html?_Metrics_ for_Ranking). We thus obtained a list of 17 functional groups and 35 clusters that were over-represented in the set of genes that are differentially expressed through the time course using a GSEA FDR cutoff of<0.1 (S3andS4Tables).
We used DESeq’s negative binomial test to generate a list of differentially expressed genes at every time point using a multiple testing correctedp-adjusted cutoff of<0.1. Differentially
the transition from BF to PF [12]. Each cluster is demarcated by alternating white and gray shading and contains 3 boxplots representing DMSO-treated, 2d I-BET151-treated, and 3d I-BET151-treated cells. All clusters with a Gene Set Enrichment Analysis (GSEA) false discovery rate (FDR)<0.1 and>70% of genes up- or down-regulated within each cluster at 48 h postinduction are shown. The median for each set of genes is shown as a red line. Whiskers demarcate the inner quartile range. Outliers are shown as blue dots. (D) Boxplots as in C except that the genes previously shown to be differentially expressed upon differentiation from the BF to the PF are now grouped in the indicated pathways. ISG, invariant surface glycoproteins, Glyc, glycosomal enzymes, mit CAC, mitochondrial citric acid cycle, glycBS, proteins required for high rate of glucose and glycerol metabolism in BFs, GPI, Glycosyl phosphatidylinosotol metabolism, cyc, cell cycle, flag, flagellar genes, procyc, procyclic surface antigens, cyskel, cytoskeletal genes, vestrans, proteins required for intracellular protein and vesicular transport. (E and F) DESeq was used to call genes with significantly altered transcription between I-BET151 treated cells and DMSO-treated control cells for every time point using ap-adjusted cutoff of<0.1. For each functional group, the percentage of genes within that group that were significantly altered was calculated for each time point and plotted. Only groups with a GSEA FDR of<0.1 are shown. (E) Early-induced hierarchically clustered gene sets. (F) Early-induced functional groups. chap, chaperone, RBP, RNA binding proteins. Numerical data for Fig 1 is found inS1 Data.
expressed genes and their associated expression andp-values for each time point are listed in Additional Files 5–9 inS1 Data. For those genes previously found to have altered gene expres-sion during differentiation [12], we binned each DESeq generated differentially expressed gene into its associated cluster or functional group. We then plotted the percentage of genes within each cluster or group that were differentially expressed over the time course (Fig 1E and 1F,S1 andS2Figs,S5andS6Tables, Additional Files 5–9 inS1 Data). Note that only the 17 func-tional groups and 35 clusters with a GSEA generated FDR of<0.1 (S3andS4Tables) are
plot-ted inFig 1E and 1F,S1andS2Figs. Note also that the percentages of differentially expressed genes used in the plots are inS5andS6Tables. For example, at 3 h after the initiation of I-BET151 treatment, 23% of genes in the glycosomal pathway (glyc, GSEA FDR = .018) are called by DESeq as being differentially expressed with ap-adjusted value of<0.1, whereas at 48
h, 94% of the genes in this group are differentially expressed in our dataset (gray line inFig 1F, see alsoS5 Table). Other functional groups that showed early differential expression of their gene members include mitochondrial citric acid cycle enzyme genes (mit CAC), flagellar genes (flag), RNA binding protein genes (RBP), chaperone or protein-folding-related genes (chap), procyclic transcription unit genes (procyc) and genes associated with intracellular and vesicu-lar transport pathways (vestrans) (Fig 1F).
The percentage of differentially expressed genes for each functional group rises sharply between 12 and 24 h for 15 of the groups analyzed (e.g., ISG and GPI,S1A Fig) (Fig 1Fand S1A–S1C Fig) and generally continues to rise between 24 and 48 h (Fig 1F,S1B and S1C Fig). In addition to the ISG and GPI groups, genes involved in RNA degradation (RNAdeg), glucose and glycerol metabolism (glycBS), cytoskeleton(cyskel), ubiquitination (ubiq), DNA binding, replication, and nucleases (DNA) and protein kinase or kinase binding activity (signal K) were differentially expressed starting at 12 h after initiation of I-BET151 treatment (S1B and S1C Fig). Finally, two groups of genes were differentially expressed late in the time course, between 24 and 48 h. These included ribosomal proteins (ribprot) and genes associated with the nucleo-lus (nucleol) (S1D Fig).
We performed the same analysis described above on the 35 clusters with GSEA FDRs of
<0.1. We found that six clusters had differentially expressed genes early in the time course (Fig
1E). 27 clusters contained genes that began to be differentially expressed at 12 h postinduction, and the percentage of differentially expressed genes within the majority of clusters continued to rise until 48 h (S2A–S2D Fig). Genes within Clusters 57 and 22 were not differentially expressed until 24 h postinduction (S2E Fig). Overall, this analysis indicates that a small subset of genes (between 21 and 29) are differentially expressed in the first 12 h of I-BET151 treat-ment, with a much larger number of genes (~700) showing differential expression between 12 and 24 h (see Additional Files 5–9 inS1 Data).
We wanted to compare the timing for gene expression changes that took place during our I-BET151 RNA-seq time course with those that took place in the Queiroz study. We compared only those clusters and functional groups with a GSEA FDR of<0.1 and>70% of genes up- or
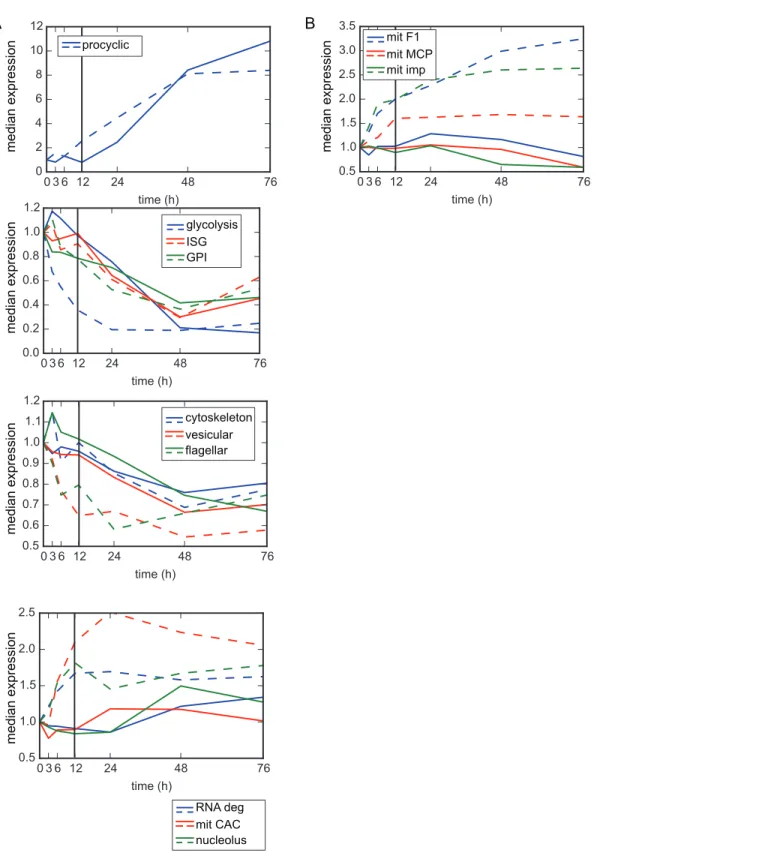
Fig 2. Transcriptional changes induced by I-BET151-treated cells mimic those induced by differentiating cells.(A) Plot showing median RPKM for all genes within the indicated functional groups at each time point after induction with I-BET151 (solid lines). For comparison, median expression values for all genes within the indicated functional groups were derived from data generated in [12] and plotted as dashed lines. Colors between solid and dashed lines are matched for each functional group. All functional groups with a GSEA FDR of<0.1 and where>70% of genes were up-regulated or down-regulated at 48 h of I-BET151 treatment are plotted. (B) Examples of 3 functional groups that do not match our criteria of a GSEA FDR of<0.1 and where>70% of genes were up-regulated or down-regulated at 48 h. mit F1, F1 ATPase, mit MCP, mitochondrial carrier proteins, mit imp, import of mitochondrial proteins. Numerical data for Fig 2 is inS2 Data.
induction techniques, but also the previous study used microarray technology rather than sequencing technology. Thus the level of expression is only grossly comparable between the two datasets. Nevertheless, we did observe that in general, for the 10 functional groups that met our criteria (GSEA FDR of<0.1 and>70% of genes up- or down-regulated at the 48 h time
point), the median gene expression between 12 and 76 h for each of the groups (to the right of the black line on each plot) roughly correlated with the previous study (Fig 2andS3 Fig). While the median gene expression at 48 and 76 h was quite similar for some functional groups (e.g., procyclic, glycolysis, GPI, ISG), other functional groups in our dataset changed to a lesser extent than those in the previous study (e.g., mit CAC and RNA degradation) (Fig 2A). Also of note is that the expression changes were more poorly correlated between 3 and 12 h (to the left of the black reference line inFig 2). For contrast, three functional groups that did not meet our criteria for similarity to the previous study (either>0.1 GSEA FDR or<70% of group up- or
down-regulated) are plotted inFig 2B.
31 clusters matched our criteria for having a GSEA FDR of<0.1 and greater than 70% of
genes up- or down-regulated (S3 Fig). In some cases, the median level of gene expression at 48 and 76 h matched quite well between the datasets (e.g., clusters 40, 6, 29, 54, 52, 51,10, 16, 39, and 31), while in other cases the changes in our dataset were more muted (e.g., clusters 32, 59, 17, 18). As with the functional groups, changes in gene expression between 3 and 12 h were more poorly correlated between datasets. Examples of clusters that did not pass our criteria for similarity to the previous study (either>0.1 GSEA FDR or<70% of group up- or
down-regu-lated) are plotted inS3B Fig.
For some clusters and functional groups analyzed (e.g., RNA deg, mit CAC, nucleolus, clus-ter 4,6,7), changes in gene expression as a result of I-BET151 treatment were delayed when compared to the gene expression changes that take place upon initiation of differentiation (Fig 2andS3 Fig). We conclude that while I-BET151-treated cells show gross similarities to differ-entiating cells with respect to changes in the transcriptome, these changes are not identical for every group of genes, the changes are sometimes delayed, and in some cases the response is more muted.
Inhibition of Bromodomain Proteins Disrupts BF-Specific Antibody
Internalization
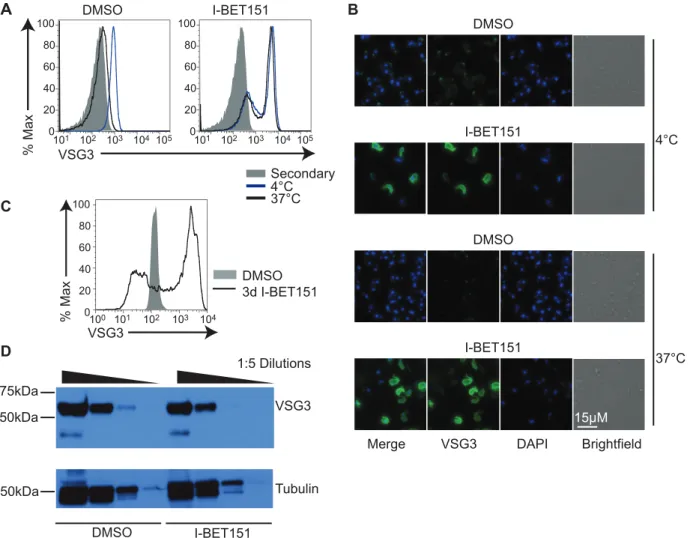
bound to the surface in I-BET151-treated cells (Fig 3C) without a concomitant increase in total VSG protein (Fig 3D). We attribute this accumulation in surface-bound antibody to the block in antibody internalization and possible defects in VSG recycling associated with down-regula-tion of many of the genes necessary for these processes (Figs1Dand2A). These data strongly suggest that bromodomain proteins are necessary for maintaining the BF cell fate, and that their inhibition has functional consequences on BF-specific immune evasion processes, such as rapid internalization of surface-bound antibodies.
Bromodomain Proteins Are Necessary for Monoallelic Expression of
VSG
Genes
Recent work has demonstrated a mechanistic link betweenVSGexpression and differentiation from BF to PF cells [27].VSGs are located in metacyclic-specific expression sites (metacyclic Fig 3. Bromodomain proteins are necessary for BF-specific antibody internalization.(A) Flow cytometry measuring the amount of primary anti-VSG antibody remaining on the surface following a 5-min incubation at the indicated temperatures, washout, fixation, and incubation with secondary antibody in I-BET151-treated (right) versus control cells (left). "Secondary" (gray trace) denotes control cells stained with secondary antibody only. (B)
Immunofluorescence showing the amount of primary anti-VSG antibody remaining on the surface following a 5-min incubation at the indicated temperatures, washout, fixation, and incubation with secondary antibody in I-BET151-treated versus control cells. A bright spot is detected at the flagellar pocket in control cells incubated at 4°C, whereas I-BET151-treated cells have antibody distributed over the entire surface. At 37°C, control cells have internalized almost all the primary antibody. (C) Flow cytometry showing the amount of anti-VSG3 antibody bound to the surface in cells treated with I-BET151 for 3 d, compared to control cells. (D) Anti-VSG Western blot showing that protein levels ofVSGat the active expression site (ES) are unaltered in I-BET151-treated cells. Tubulin is used as a loading control. Numerical data for Fig 3 is inS3 Data.
expression sites [ESs]), minichromosomes, and elsewhere in the megabase chromosomes (S4A Fig). In the BF, they are transcribed from one of ~15 telomeric ESs, but only one ES is tran-scriptionally active at any one time. Each ES contains a promoter and a number ofExpression
Site Associated Genes(ESAGs) upstream of theVSG. Batram et al. discovered that ectopic
expression of aVSGgene causes silencing to spread from the active ES telomere upstream toward the promoter, and that this silencing“primes”cells to transition from the BF to the PF. We used RNA-seq to ask whether a similar phenomenon occurs in I-BET151-treated cells by mapping reads that did not align to the megabase chromosomes to ESESAGs and toVSGs [28]. We observed an increase in transcription of silentVSGs genome-wide (S4B Fig, Addi-tional File 10 inS10 Data). Q values for the VSGs were calculated by subjectingp-values gener-ated from the replicate sets to Benjamimi and Hochberg correction using SeqMonk software from Babraham Bioinformatics (seeMaterials and Methods) and VSGs with a Q value of
<0.1 are shown in red inS4B Fig. Examples of cells expressing more than one VSG could be
observed by staining I-BET151-treated cells with multiple VSG antibodies and using an Image-stream flow cytometer to visualize double-expressing cells (S4C Fig, top). However, it should be noted that the proportion of cells with two different VSGs on the surface is<1% of the total
population (S4C Fig, bottom), and thus the loss of monoallelic expression appears to take place mainly at the transcriptional level.
We hypothesized that the increase in VSG mRNA could result in active ES attenuation, as was observed by Batram et al. A decreasing transcription gradient at the active ES has also been demonstrated at the beginning of differentiation from the BF to the PF [29]. To unambiguously map theESAGreads to each ES, we aligned the reads uniquely allowing for 0 mismatches. This analysis revealed an increase in transcription ofESAGs near the active ES promoter, while those near the active ES telomere were silenced, with silencing spreading upstream toward the promoter between 2 and 3 d of treatment (S4D Fig, Additional File 11 inS10 Data). These results support the notion that I-BET151-treated cells are primed for differentiation. Another link between ES expression and differentiation was observed by Amiguet-Vercher et al., who found an increase in transcription in regions near the ES promoter in silent ESs during the early stages of differentiation [29]. We also observed an increase in transcription ofESAGs at silent ESs upon treatment with I-BET151 (S4E Fig). We plotted the median log2(RPKM) for all ESAGs in silent ESs during the I-BET151 time course and found an initial increase in expres-sion of theseESAGs at 3 h postinduction, with a much more dramatic increase in expression occurring between 24 and 48 h (S5 Fig). To ascertain the timing for increased expression of silent VSGs, we plotted the median log2(RPKM) for all inactive VSGs during our time course
and observed that VSG expression rises later in the time course, primarily between 24 and 48 h (S5 Fig). We conclude that bromodomain proteins are necessary for maintaining monoallelic expression of VSG genes, and confirm that transcription ofESAGs andVSGs appears inti-mately linked to differentiation processes.
Bromodomain Proteins Mediate "Memory" of the Active ES
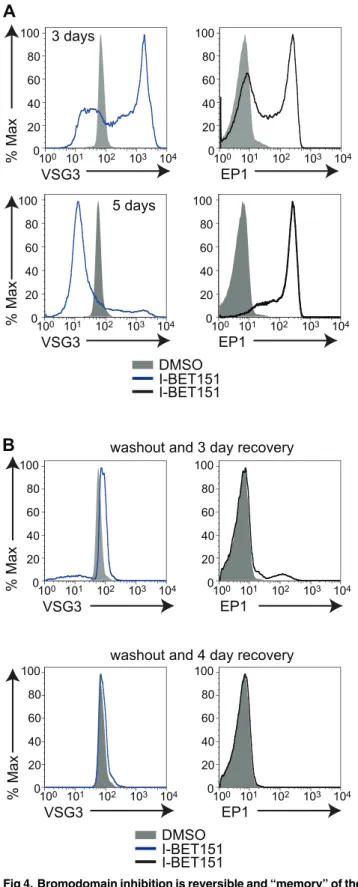
treatment are reversible. Longer treatments (5 d) with I-BET151 lead to very low levels of anti-VSG antibody bound to the cell surface (Fig 4A), but memory of the active ES appears to be retained, as the VSG associated with this same ES is expressed on the surface after 3 d of washing out the drug (Fig 4B). Similarly, levels of surface EP1 are high after 5 d of I-BET151 treatment, but expression is lost upon washout of the drug. These results imply that the tran-scription changes associated with differentiation are reversible, and supports the intriguing possibility that these changes may be epigenetically mediated, though this remains to be con-clusively proven.
Genetic Ablation of Bromodomain Proteins Phenocopies Treatment with
I-BET151
We then set out to confirm that the observations associated with I-BET151-treated cells are mediated by the inhibition of trypanosome bromodomain proteins. First, we endogenously tagged Bdf1-4 with C-terminal HA (Bdf5 function has already been studied [32,33]). We per-formed chromatin immunoprecipitation-sequencing (ChIP-seq) experiments and used the Model-based Analysis for ChIP-Seq (MACS) algorithm to determine peaks of localization for each tagged Bdf [34]. Each experiment was performed in duplicate, and only those peaks that were called by the MACS algorithm in both replicates were analyzed. Each peak was required to have a MACS algorithm-based FDR of<0.1 in at least one replicate to be included in the
analysis presented inFig 5B. Additionally, we called peaks in control samples that were sub-jected to anti-HA pull downs but that did not contain tagged proteins. Any peak that was called by MACS in these control lines was removed from the set of called peaks in each of the tagged lines. Genomic location, FDR values, and fold enrichment for each called peak are in Addi-tional Files 12–14 inS5 Data. We confirmed binding of Bdf3 to sites of transcription initiation [35] and found that Bdf1 and 4 also localized to these sites, while Bdf2 did not (Fig 5A). Specifi-cally, 67%, 46% and 67% of Bdf1, 3, and 4 peaks, respectively, are within 100 bp of a divergent strand switch region (with two PTUs going in opposite directions, presumed to be transcrip-tion start sites) (Fig 5B, left). 52%, 85% and 70% of all divergent strand switch regions (Tran-scription Start Sites, TSSs) are within 100 bp of a Bdf1, 3, or 4 peak, respectively (Fig 5B, right). In contrast, although the MACS algorithm did call 71 Bdf2 peaks in the genome, none of them met the<0.1 FDR cutoff, and were thus not included in this analysis. Based on genomic
locali-zation, we divided bromodomain proteins into two classes: those that bind to transcription start sites (Bdf1, 3, 4) and those that do not (Bdf2). We decided to further study Bdf3 and Bdf2 as representatives of each class.
Using the recombinantly expressed and purified bromodomains fromT.bruceiBdf2 and Bdf3 (Tb927.10.7420, Tb927.11.10070, respectively), we performed isothermal titration calo-rimetry experiments and confirmed direct and specific binding of I-BET151 to their AcK rec-ognition sites, as mutation of two conserved residues in the AcK sites abolished interaction with the inhibitor (Fig 5C). By contrast, we could not detect binding of another well character-ized bromodomain inhibitor, JQ1 [36], to recombinant Bdf2 and Bdf3 bromodomains (S6 Fig), which is consistent with the fact that JQ1 had no biological effects on trypanosomes in our hands (S12 Data). Having confirmed Bdf2 and Bdf3 as I-BET151 targets, we next asked whether genetic ablation of these proteins would phenocopy the effects of treating trypano-somes with I-BET151.
Fig 4. Bromodomain inhibition is reversible and“memory”of the active ES is retained.(A) Flow cytometry measuring the amount of anti-VSG antibody bound to the cell surface as well as surface levels of EP1 following treatment with I-BET151 for the indicated number of days. (B) Flow cytometry measuring surface levels of VSG and EP1 following a 5-d treatment with I-BET151, washout, and recovery for 3 d (top two panels) or 4 d (bottom two panels). Numerical data for Fig 4 is inS4 Data.
we created a separate, inducible RNAi strain harboring an endogenously HA-taggedBdf3
(Bdf3kdcells). Here, Dox treatment induces expression of double-stranded RNA
complemen-tary toBdf3(S7A Fig). Dox treatment of Bdf2KOand Bdf3kdcells resulted in efficient protein
knockdown of Bdf2 and Bdf3, respectively (S7B and S7C Fig). We observed normal growth in the Bdf2KOcells until 48 h after induction, where a growth defect emerged, coinciding with
perturbations in cell cycle (S8A and S8C Fig). Bdf3kdcells were growth arrested between 12
and 24 h, and we observed cell cycle defects at 24 h (S8B and S8C Fig). Cell cycle defects largely resolved between 1 and 2 d of treatment (S8C Fig, right panel, coinciding with a restoration in Bdf3 protein level at 48 h (S8D Fig, bottom), implying that the RNAi against Bdf3 appears to shut off after 24 h by an unknown mechanism.
RNA-seq analysis was performed on Bdf2KOand Bdf3kdcells using similar methods as
those described for I-BET151 treatment. Because the kinetics for deletion of Bdf2 were slightly slower than for knockdown of Bdf3 (S8D Fig), we allowed a longer time period for induction of Bdf2 deletion and associated downstream transcriptional effects prior to harvesting RNA (48 h for Bdf2 versus 24 h for Bdf3 knockdown). polyA+ RNA was isolated from 3 independent bio-logical samples to generate RNA-seq libraries for cells treated with and without Dox. DESeq analysis revealed that many of the insect-specific genes that were up-regulated in I-BET151-treated cells were also up-regulated in Bdf3kd, but not in Bdf2KOcells, including
EP1-3,
GPEET2and procyclin-associated genesPAG1,2,4,5(Fig 5D, Additional File 15 and
Addi-tional File 16 inS5 Data). We performed GSEA analysis in Bdf3kdand Bdf2KOcells using the
same clusters and functional groups described earlier, which had previously been shown to be differentially expressed during the transition from the BF to the PF [12]. All results of GSEA analysis on Bdf3kdand Bdf2KOcells are listed inS7
–S10Tables. Of the functional groups ana-lyzed, 10 groups met our criteria of having a GSEA FDR of<0.1 and 70% of genes moving in
one direction in Bdf3kdcells (S7 Table). Boxplots of these functional groups are shown inS9A
Fig, left. By contrast, only one functional group passed our criteria in Bdf2KOcells (S9B Fig,
left). Of the clusters analyzed, six clusters passed our criteria in Bdf3kdcells (S9A Fig, right),
while four clusters passed in Bdf2KOcells (S9B Fig, right).
RNA-seq analysis revealed that transcripts for VSGs located at silent bloodstream expres-sion sites (BESs) were significantly increased in both Bdf3kdand Bdf2KOcells. This was also
true for metacyclicVSGs, whileVSGs in minichromosomes were only slightly up-regulated in Bdf3kdcells (S10A Fig). Consistent with its more widespread genomic localization, knockdown
of Bdf3 increased transcription for more of theVSGs in the genome than was the case for Bdf2 (S10B Fig). These results imply that while both proteins maintain monoallelic expression of
VSGgenes, Bdf2 has a more specialized role in maintaining silencing at ESs. We tested whether Bdf2 could be localized to the ES using chromatin IP followed by Q-PCR. We performed this test in a cell line with a Blasticidin resistance gene at the active ES promoter and a GFP marker >100 bp away from an TTS or TSS. Right, the percent of all transcription start sites within 100 bp of a peak are shown for Bdf1,3,4. No Bdf2 MACS-derived peaks were within the FDR<0.1 cutoff and are thus not included in this analysis. The total number of peaks called for Bdf1, 3 and 4 are 240, 307, and 175 respectively. Note that“head to tail”sites were not included in this analysis. (C) Isothermal titration calorimetry measuring binding of Bdf2 and Bdf3 to I-BET151. Conserved tyrosine and asparagine residues within the AcK binding pocket are mutated to alanine in the mutant constructs. (D) Volcano plot showing the most significant up-regulated and down-regulated genes in the trypanosome genome from an RNA-seq experiment comparing Dox-treated Bdf3kd(top) or Bdf2KO(bottom) to untreated control cells. DESeq was used to normalize counts, compute log
2(fold change) of treated cells over untreated
cells, and calculatep-adjusted values. Dots in red indicate genes with fold changes of>2 and ap-adjusted value<0.05. (E) Flow cytometry measuring surface EP1 expression in two-d Dox-treated Bdf2KO(top) or Bdf3kdcells (middle), or I-BET151-treated cells (bottom) following washout of IBET-151 or Dox,
and subsequent exposure to a 24 h treatment with one of two different differentiation triggers: incubation at 27°C (middle) or treatment with cis-aconitate (CA) at 37°C (right) compared to a control without any trigger (left, No stimulus). (F) Flow cytometry measuring the amount of primary anti-VSG antibody remaining on the surface following a 5-min incubation at the indicated temperatures, washout, fixation, and staining with secondary antibody in Dox-treated Bdf2KO(top
panels) and Bdf3kdcells (bottom panels) compared to controls. Numerical data for Fig 5 is inS5 Data, except wiggle plots shown in Fig 5A, which are inS6
Data.
at one of the silent ES promoters. We found that Bdf2 localized to the promoter region of both the active and silent ES, and we also detected weaker binding at each of theVSGs associated with these ESs (S10C Fig, left). Binding to these regions was decreased in the presence of I-BET151 (S10C Fig, right). We also tested binding of Bdf3 to the ES using a cell line that did not distinguish the promoters of active and silent ESs. We found that Bdf3 also binds to the ES promoter (ESP1 inS10D Fig) and to a pseudogene located further down the ES, but that it did not appear to bind directly to theVSGgenes (S10D Fig). Finally, transcription ofESAGsin inactive ESs is also higher in Bdf3kdand Bdf2KOcells (S11 Fig).
We further tested whether Bdf3 binding was altered in the presence of I-BET151 by collect-ing samples for ChIP at 6 h, 12 h, and 24 h followcollect-ing initiation of treatment. We then used Q-PCR to test whether Bdf3 binding was altered at the ES promoter (ESP1 inS12A Fig) or at several other sites identified as peaks of Bdf3 binding in our ChIP-seq experiment (S12B–S12D Fig). We found that I-BET151 treatment decreased binding to both the ES promoter and to the other sites we tested in a progressive manner, whereas it did not decrease binding to theURA3
control region (S12A Fig).
Our RNA-seq experiments on Bdf2KOand Bdf3kdcells were conducted at 48 h and 24 h post-induction, respectively. We wanted to confirm that the changes in transcription at these later time points were reflected early upon depletion of each Bdf. To do this, we isolated RNA from Bdf2KOcells at 6, 12, 24, 36, and 48 h postinduction with Dox. For Bdf3kdcells, we
iso-lated RNA at 6, 12, and 24 h postinduction. We confirmed that PAG2, EP1, and GPEET2 mRNA expression increased after 6 h of induction in Bdf3kdcells. This was also the case for a VSGgene in a silent site (VSG3) (S13A Fig). We were also able to confirm that the transcrip-tion of silent ES VSGs and one metacyclic VSG was increased in Bdf2KOcells as early as 6 h
postinduction (S13B Fig).
Genetic depletion of Bdf3 did not result in the expression of EP1 on the surface of the cells (Fig 5E), but previous results from Batram et al. indicated that the presence of an ectopically expressed VSG“primed”cells for differentiation from the BF to the PF and increased their sensitivity to cis-aconitate, an acidic small-molecule differentiation trigger that mimics the increased acidity of the fly midgut [27,37,38]. We wondered whether the increase in transcrip-tion of normally silencedVSGs might have a similar effect, so we subjected Bdf3kdand Bdf2KO cells to treatment with cis-aconitate or reduced temperature. Indeed, genetic depletion of bro-modomain proteins primes BF trypanosomes for differentiation, and requires only one (cis-aconitate), rather than two, environmental stimuli to induce EP1 expression (Fig 5E). The effect was stronger in Bdf3kdcells, perhaps due to the significant up-regulation of EP1 mRNA. Unlike the Bdf2- and Bdf3-depleted trypanosomes, a large proportion of I-BET151-treated cells expressed EP1 at high levels in the absence of any environmental stimulus, and nearly all cells expressed EP1 following treatment with cis-aconitate or incubation at 27°C (Fig 5E). Con-trol cells with intact bromodomain proteins showed very low induction of EP1 upon exposure to differentiation triggers (Fig 5E). These results confirm that bromodomain proteins are important for preventing remodeling of the parasite surface until all the appropriate environ-mental signals have been received.
We were able to partially recapitulate the block in antibody internalization observed in I-BET151-treated cells in both Bdf3kdand Bdf2KOcells (Fig 5F). The block in Bdf3kdcells is
con-sistent with the decrease in transcription of flagellar genes necessary for motility (S9 Fig). The partial block in antibody internalization observed in Bdf2KOcells was unexpected, but might be
bromodomains, which most likely reflects simultaneous inhibition of at least two bromodo-mains (Bdf2 and Bdf3) by I-BET151. We cannot rule out the possibility that I-BET151 may also bind Bdf1, 4, and/or 5, and that these proteins may be able to partially compensate for the lack of Bdf3 in Bdf3kdcells. Overall, we show that most of the effects seen in I-BET151-treated cells are phenocopied in Bdf3kdcells, and that ES-specific effects are also observed in Bdf2KO
cells. Our results imply that bromodomain proteins are required for maintenance of BF stage identity.
Bromodomain Proteins Are Promising Drug Targets for Treatment of
Trypanosomiasis
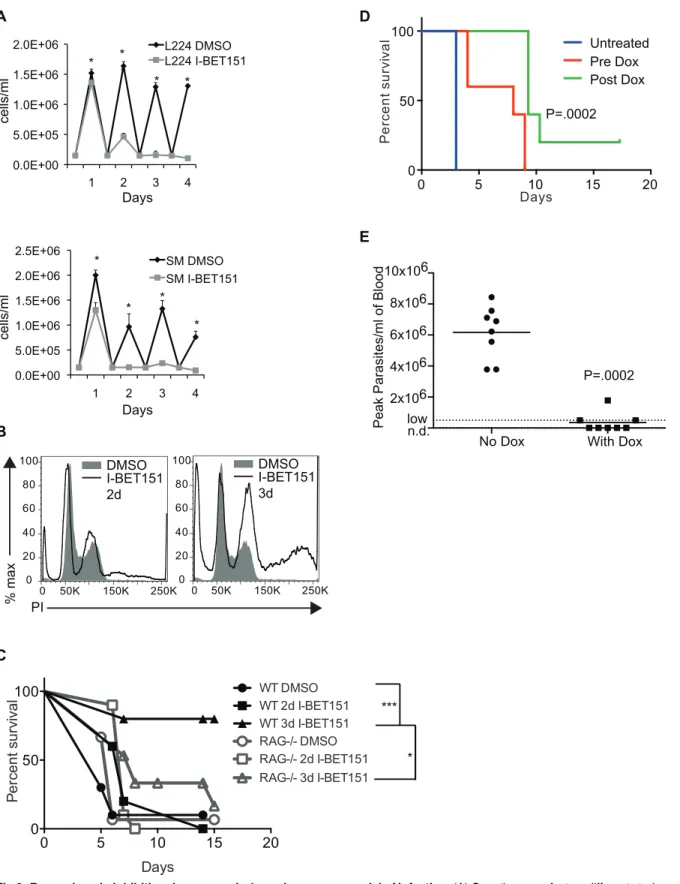
Inhibition of bromodomain proteins compromises BF-specific immune evasion mechanisms and provides several advantages for the host immune system, including slower parasite growth and cell cycle defects (Fig 6A and 6BandS8 Fig), expression of an invariant epitope on the sur-face of the cell (EP1) (Fig 1B), and defects in antibody internalization (Figs3Aand5F), making these proteins attractive drug targets. However, while repurposing known bromodomain inhib-itors to combat trypanosomiasis is a promising strategy, in vivo treatment with I-BET151 itself is suboptimal because of its low affinity for trypanosome bromodomain proteins and its high affinity for mammalian BET proteins that affect the immune system [22]. We therefore asked whether the course of parasitemia is altered in mice infected with trypanosomes treated in vitro with I-BET151 prior to infection. Mice infected with parasites treated for two days with I-BET151 survived significantly longer than control mice. In addition, 80% of the mice infected with parasites treated for three days with I-BET151 did not develop detectable parasitemia (Fig 6C). We wanted to make sure that the survival advantage in WT mice was not due to lack of viability of I-BET151-treated cells, and we also wanted to confirm that I-BET151-treated cells were able to establish infections in vivo. We reasoned that if the drug-treated trypanosomes were not viable or capable of establishing an infection, thenRAG-/-mice, which lack B and T cells, would have a similar advantage to WT mice in surviving infection with I-BET151-treated trypanosomes. We thus performed the same experiment inRAG-/-mice and observed that sur-vival was significantly lower inRAG-/-mice that had been treated with I-BET151-treated try-panosomes when compared to WT mice (Fig 6C). We conclude that the survival advantage conferred by I-BET151-treated cells in WT mice cannot be solely due to lack of viability of drug-treated trypanosomes, since they are capable of killing immunocompromised mice.
Fig 6. Bromodomain inhibition decreases virulence in a mouse model of infection.(A) Growth curves for two different strains used in the study (L224 and SM). I-BET151-treated cells were incubated at 37°C and counted daily on a hemacytometer and parasite numbers were compared with control cells.*
shown inFig 6. Consistent with the data inFig 6A, we did observe a lag in growth in I-BET151-treated cells, both prerecovery and postrecovery, which might contribute to the increased survival of WT mice infected with I-BET151 treated trypanosomes (S14C Fig).
We also tested the effects of genetically depleting bromodomain proteins in vivo. We infected mice with Bdf3kdcells and knocked down Bdf3 in vivo by feeding infected mice with
Dox pellets either before or after parasitemia became detectable. We observed an increase in survival specifically in Dox-fed mice (Fig 6D). Mice infected withBdf2conditional knockout
parasites were able to clear the infections without Dox treatment, possibly due to leakiness of theCregene and lower levels of Bdf2, compromising growth. Nonetheless, mice fed with Dox
pellets had extremely low or undetectable parasitemia when compared with regular pellet-fed mice (Fig 6E).
The Crystal Structure of Bdf2 in Complex with I-BET151 Reveals a
Novel Binding Mode of the Inhibitor
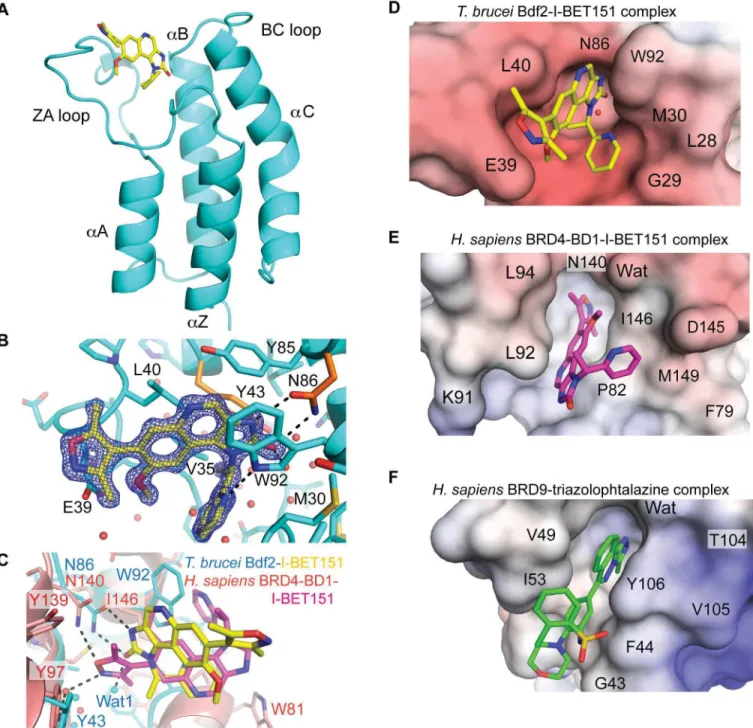
To provide a blueprint towards designing high-affinity trypanosome-specific bromodomain inhibitors, we determined the crystal structure of the Bdf2 bromodomain in complex with I-BET151 at 1.25Å resolution. The overall structure adopts the canonical bromodomain fold comprising fourα-helices linked by variable loop regions that form the ligand binding site [39,40] (Fig 7A and 7B). Unexpectedly, but consistent with the reduced affinity, the ligand is flipped by roughly 180° with respect to the human BRD4-BD1-I-BET151 complex and cannot adopt its classical binding mode (Fig 7C) [23]. In human BRD4-BD1, the dimethylisoxazole group mimics AcK, recognizing the conserved Asn (Asn140) and the conserved water network. In Bdf2, the dimethylisoxazole ring is solvent-exposed, while recognition of the conserved Asn takes place through a bidentate hydrogen bond to the imidazolone moiety. The new orientation is probably due to a clash of the pendent pyridine ring with the large trypanosome gatekeeper residue Trp92, which dominates ligand recognition through parallelπ–πstacking and which is not found in any of the 61 human bromodomains at this position [41]. The flipped binding mode is further enforced by the narrow AcK binding slot that cannot accommodate the ener-getically favorable twist of the dimethylisoxazole with respect to the quinoline ring (Fig 7D). Notably, the pyridine moiety forces the imidazolone to sit high up in the AcK binding pocket, resulting in an imperfect fit with a gap at the bottom of the pocket that is filled by an additional, unconserved water molecule (Wat1,Fig 7C). By contrast, the smaller gatekeeper residue Ile146 in human BRD4-BD1 allows the twisted dimethylisoxazole to engage in the classical AcK rec-ognition (Fig 7E).
BRD9 is one of the closest human structural homologs to Bdf2 and also possesses an aro-matic gatekeeper residue (Tyr106) that recapitulates the parallelπ–πstacking interaction with a triazolophtalazine compound within a narrow slot (Fig 7F). However, the negative electro-static surface potential of Bdf2 markedly differs from the slightly positively charged BRD9 pocket, highlighting the distinct character of the Bdf2 AcK binding site, a prerequisite for developing a trypanosome-specific drug. Thus, the structure illuminates how the compound may be optimized towards selective treatments for trypanosomiasis.
significantp-value of<.001 derived from Log-rank Mantel-Cox test between the indicated groups. Note that oneRAG-/-mouse was sacrificed at day ten due to infection unrelated to trypanosomiasis. (D) Survival curves of C57/B6 mice infected with Bdf3kdtrypanosomes and fed with Dox pellets for 2 d prior to
infection (Pre Dox), or once parasitemia reached detectable levels (Post Dox) compared with mice fed with regular pellets.p-Value derived from Log-rank Mantel-Cox test performed on the three groups. (E) Peak levels of parasites/ml of blood measured by tail bleed in Dox-fed wildtype mice infected with Bdf2KO
trypanosomes compared to mice fed with regular pellets.p-Value derived from Mann-Whitney test. Numerical data for Fig 6 is inS6 Data.
Discussion
T.bruceidifferentiation from the BF to the PF requires extensive reprogramming that results
in drastic changes in morphology, metabolism, and protein expression. These changes are reflected at the level of gene expression, with recent studies indicating that 25%–40% of all Fig 7. Structural analysis of I-BET151 binding to Bdf2.(A) Structure of the Bdf2 bromodomain in complex with I-BET151 (PDB code 4PKL). (B) Electron density of I-BET151 and key residues for ligand recognition. The two conserved residues mutated to alanine in the Bdf2 mutant are colored in orange. (C) Superimposition of Bdf2 (cyan) in complex with I-BET151 (yellow) onto human BRD4-BD1 (light red, 3ZYU) in complex with I-BET151 (magenta). (D to F) Electrostatic surface potential shown between -10 kT/e (red) and +10kT/e (blue) of (D) trypanosome Bdf2 bromodomain in complex with I-BET151, (E) human BRD4-BD1 in complex with I-BET151 (3ZYU), and (F) human BRD9 in complex with a triazolophtalazine inhibitor (4NQN).
genes are differentially expressed as the cells transition from one form to another [10,12,42]. A number of mechanisms have been shown to be involved in the developmental regulation of gene expression, including alternative splicing [42] and mRNA stability mediated by regulatory sequences within 5’and 3’UTRs [6–8,43]. These regulatory sequences are, in turn, bound by RNA binding proteins. For example, ZFP3 associates with EP1 and GPEET mRNA and can interact with translation factors [44,45]. Our studies indicate that there may be an additional layer of developmental regulation of gene expression that is mediated at the DNA level. We show that inhibition of bromodomain proteins cause some transcriptional changes that are similar to those observed during the physiological transition from the BF to the PF. These tran-scription changes have functional consequences, such as the appearance of EP1 on the cell sur-face and the gradual disappearance of sursur-face VSG.
An alternate explanation for the data is that treatment with I-BET151 and/or knockdown of Bdf genes results in a global transcriptional dysregulation, such that all formerly silenced genes show increased transcription and active genes show decreased transcription. To try and deter-mine whether this was the case for our I-BET151 time course, we split genes into those that had previously been shown to change during differentiation as defined by the Queiroz study, and those that have not. If global dysregulation were occurring, we would expect that in the group of genes not associated with differentiation, there should be an increase in median RPKM for genes that are poorly expressed at time 0, and a decrease in median RPKM for genes that are highly expressed at that time point. Genes in the“procyclic”group, as defined by Queiroz et al. are poorly expressed in BF cells. We examined the range of starting RPKMs for this group of genes and extracted genes of similar starting RPKM from the set of genes that have not previously been shown to be involved in differentiation. We then plotted the median level of gene expression over time for this group of poorly expressed genes. We did not observe a significant increase in the median RPKM for this set of genes over the course of I-BET151 treatment (S15 Fig), indicating that global disregulation is not occurring. We obtained similar results for the set of genes with high starting RPKM, whose range was chosen based on the range of expression for the genes found in the“glycolysis 1”group of genes defined by Queiroz et al. (S15 Fig). We did not observe a general decrease in median RPKM for the set of highly expressed genes that were not previously shown to be involved in differentiation over the course of I-BET151 treatment. While we have not formally disproved global disregulation, we believe these findings argue for a more specific effect of I-BET151 treatment on the set of genes known to be involved in differentiation.
InT.brucei, there is a paucity of sequence-specific DNA regulatory sequences that can serve
as transcription factor binding sites. Only one transcription factor has been well characterized [46], and it appears to primarily mediate Pol I transcription. To our knowledge, enhancer-like sequences have not been identified. It is thus unlikely that transcription factors are the means by which developmental transcriptional programs are put in place. This leaves epigenetic marks and the proteins that read them as a potential mechanism for regulating developmental changes in gene expression at the DNA level. Our work implies that bromodomain protein localization could change during differentiation from the BF to the PF in the normal course of the trypanosome lifecycle, and that this may be part of the mechanism by which a new, PF-spe-cific transcriptional program is initiated. While we have demonstrated that bromodomain pro-teins bind chromatin, and that binding is altered following their inhibition, technical
We were able to demonstrate that bromodomain protein-mediated changes in transcrip-tional program are reversible (Fig 4), and we theorize that this plasticity may be a significant advantage to an organism that must reprogram itself quickly to adapt to the changing environ-ments encountered between the insect and the mammalian host. Our results are in good agree-ment with a very recent study in mice, where small-molecule bromodomain protein inhibition in embryonic stem cells resulted in loss of the undifferentiated state and in spontaneous onset of differentiation [16]. The surprising parallels between bromodomain-mediated maintenance of cell fate in mouse embryonic stem cells and BF trypanosomes have interesting implications for how these processes may have evolved across diverse biological systems.
We found that inhibition of bromodomain proteins caused growth arrest, both in our genetic knockdowns of Bdf2 and Bdf3 and upon treatment with I-BET151 (Fig 6andS8 Fig), albeit with different timing in each case. This is interesting in light of the fact that long slender BF trypanosomes cease to divide as they progress to the stumpy forms that are eventually ingested by the tsetse. Transcriptional profiling has revealed that many of the gene expression changes that take place during the transition from the BF to the PF are already in motion dur-ing the stumpy stage [10,11,42], and thus some of the transcription changes that we observe in I-BET151-treated cells might be shared with cells transitioning from the long slender to the stumpy form. That is to say that it is possible that the cell cycle arrest observed upon bromodo-main protein inhibition is a result of the transcriptional program that is set forth following inhibition. The Lister427 strain used in this study is not pleomorphic and thus cannot be induced to form stumpies. However, it may be that bromodomain inhibition causes the cells to acquire some characteristics of stumpy forms. That said, we were unable to detect PAD1 on the surface of I-BET151-treated cells [47], and thus do not think the drug is inducing formation of a true stumpy form. Conversely, it is possible that the growth arrest is causing transcriptional changes consistent with progression to the next lifecycle stage. However, the fact that we see an up-regulation of EP1 mRNA at 3 h following I-BET151 treatment, and that we do not observe a pronounced growth arrest in the first 24 h of treatment does not support this notion. In future studies, it will be interesting to see what effect I-BET151 has on pleomorphic strains, and whether it is able to instigate transition to the stumpy form.
We initially chose to focus on the BF cell fate because its loss could have important thera-peutic implications. For example, disrupting immune evasion mechanisms specific to BF cells (e.g., antigenic variation or antibody internalization) could lend the host immune system a much-needed boost in combating infection. However, the question as to whether bromodo-main proteins are important for bromodo-maintaining cell fate in other lifecycle stages, such as in PF cells, is an important one to be addressed in future studies.
bromodomain proteins from the ESs, resulting in up-regulation of mRNA from many differ-ent ESs, which in turn could cause active ES attenuation and initiate a PF transcription pro-gram, as envisioned by Batram et al. Conversely, a global removal of bromodomain proteins from transcription initiation sites could be the event by which a PF-specific transcription program is initiated, with active ES attenuation and transient derepression being part of this more global differentiation program. Our observation that inhibiting the more ES-specific factor Bdf2 caused less of a change in the global transcriptome, but that Bdf2-depleted cells were still“primed”to undergo differentiation to a larger degree than wildtype cells (Fig 5E) supports the first scenario.
Our insights into this differentiation process have fundamental implications for the design of new strategies to treat trypanosomiasis, as inhibiting bromodomain proteins decreases viru-lence in a mouse model (Fig 6). This finding is important because trypanosomiasis is fatal if untreated and there is a paucity of drugs available for this disease [33]. Novel drug targets are necessary; as late-stage treatments are highly toxic, few new drugs are in development, and drug resistance is increasing [22]. The notion that bromodomain inhibitors can“trick”a BF trypanosome into prematurely initiating differentiation to the insect stage while still in the bloodstream imparts this class of molecules with substantial therapeutic potential. In addition to the adverse effects of I-BET151 on the parasite’s fitness itself (Fig 6A and 6BandS8 Fig), the host immune system would have specific advantages overT.brucei: (1) expression of invariant insect stage proteins on theT.bruceisurface provides a“handle”for a single antibody type to recognize the parasite (in contrast to the constantly antigenically varying VSG coat that is native toT.bruceiin the bloodstream) and (2) blockade of rapid antibody internalization, another hallmark of theT.bruceiBF, would allow more time for host effector cells to recognize and eliminate the parasites.
While I-BET151’s low affinity for trypanosome bromodomain proteins currently limits its use in therapeutic intervention, our crystal structure of Bdf2 in complex with I-BET151 pro-vides critical information to guide the design of a highly specific trypanosome bromodomain inhibitor. The fact that the architecture of the AcK recognition site of the Bdf2 bromodomain markedly differs from its mammalian counterparts (Fig 7) implies that a trypanosome-specific bromodomain inhibitor can in principle be developed. This is particularly relevant, because various bromodomain inhibitors such as I-BET151 affect the mammalian immune response [22], which could pose problems during an infection. Our structure provides specific clues, for example deletion of the pendent pyridine ring or expansion of the tricyclic aromatic ring sys-tem to fill the gap at the bottom of the binding site, for augmenting the drug-Bdf2 interactions to yield a trypanosome-specific, high-affinity ligand, while concurrently decreasing affinity for mammalian bromodomain proteins (Fig 7C). This would avoid compromising the immune response in the host, while inhibiting trypanosome growth, offering a promising new avenue toward therapeutic intervention for trypanosomiasis.
Materials and Methods
Culture Methods and Strains
T.bruceiBF cells (strain Lister 427 antigenic type MITat1.2 clone 221a) were cultured in
Strain Construction
Trypanosomes were maintained at the following drug concentrations, unless otherwise stated: 2.5μg/ml, G418 (Sigma); 5μg/ml, blasticidin (Invivogen); 5μg/ml, hygromycin (Invivogen);
0.1μg/ml, puromycin (Invivogen); 1μg/ml, phleomycin (Invivogen). The Bdf2KOstrain was
generated by cloning the coding sequence ofBdf2(Tb427.10.7420) upstream of an HA tag in the pMOTAG5H loxP plasmid. A portion of the 3’UTR was cloned downstream of a phleomy-cin resistance gene and cells were selected in phleomyphleomy-cin following transfection with an Amaxa nucleofector kit. The remaining endogenous allele of Tb427.10.7420 was replaced with a hygro-mycin resistance gene using 5’and 3’UTR homology arms cloned into the pyrFEKO-HYGRO loxP plasmid. The pLEW100cre-EP1-6G Phleo plasmid was integrated into the cell line by selecting for Phleomycin resistance following transfection to allow for inducible CRE expres-sion as in [52]. The Bdf3kdstrain was generated by cloning the coding sequence ofBdf3
(Tb427.01.1830) upstream of an HA tag in the pMOTAG5H plasmid. A portion of the coding sequence of Tb427.01.1830 was cloned into the RNAi vector P2T7TABlue and integrated into the rDNA locus. All cell lines were checked for proper integration using PCR. The cell line used for ChIP (HSTB-907) was generated by first randomly integrating a cassette containing puromycin-resistance gene, luciferase, and EmGFP (pHJ1, reference) at a silent BES promoter, and then targeting a blasticidin resistance marker at the active BES promoter (BES1-VSG2). To determine which silent BES promoter was targeted with pHJ1, in situ switched cells were selected at 100x higher concentration of puromycin (10μg/ml) and confirmed by GFP-FACS
(HSTB-717). VSG RNA analysis confirmed that the switched cells express VSG11 in BES11.
I-BET151 and Dox Treatment
Cells were treated with 20μM I-BET151 in DMSO to inhibit bromodomains, or with 1μg/ml
doxycyclin to induce deletion ofBdf2or RNAi againstBdf3.
Western Blotting
5–10 million cells were suspended in 2X Laemmli Sample Buffer (Biorad 161–0737) and sepa-rated on a 4%–20% SDS gradient gel. After transfer to PVDF membrane, blots were blocked in
5% milk in PBS and probed with anti-HA HRP (Miltenyi 130-091-972), anti-H3 (Abcam 1791), or anti-tubulin (gift from Keith Gull) followed by anti-rabbit IgG-HRP or anti-mouse IgG-HRP.
Flow Cytometry
1–2 million treated and control cells were suspended in HMI-9 and stained with fluorescence conjugated anti-VSG2 or anti-VSG3 for 10min with vortexing [53]. Cells were washed twice in HMI-9 before analysis on either a BD LSRII or a BD FACSCalibur. PI (BD 51–66211) was added to the final suspension for dead cell exclusion at 0.75μg/ml.
Differentiation Experiments
Antibody Internalization
L224, Bdf2KO, or Bdf3kdtrypanosomes were treated for 2–3 d with I-BET151 and Dox, respec-tively. Cells were stained with unconjugated anti-VSG3 (L224) or anti-VSG2 (Bdf2KOor
Bdf3kd) primary antibody and washed. Cells were subjected to a 5 min incubation at either 4°C (controls) or at 37°C to allow internalization to take place. Cells were immediately fixed in 1% formaldehyde and stained with a FITC-conjugated secondary antibody (BD 349031) to mea-sure the remaining amount of primary antibody on the surface. Cells were then analyzed by flow cytometry. For immunofluorescence, cells were adhered to poly-L-lysine coverslips fol-lowing fixation, blocked in PBS with 0.2% cold water fish gelatin (Sigma G7765) and 0.5% (w/ v) BSA and stained with anti-mouse IgG FITC (BD 349031) at 1:1,000 for 1 h. Cells were washed, counterstained with DAPI and imaged on a DeltaVision Image Restoration inverted Olympus IX-70 microscope (Applied Precision).
Movies
L224 trypanosomes were treated with I-BET151 or DMSO for 2–3 d and 1.5 million live cells
in media were imaged in a MatTek glass-bottom dish (P35G-0.17-14-C) at 1 ms intervals on a DeltaVision Image Restoration inverted Olympus IX-70 microscope (Applied Precision).
Cell Cycle PI Staining
Cells were fixed for 5 min in 1% formaldehyde in PBS. After 3 washes, cells were resuspended in solution containing 0.2 mg/ml RNAse and 0.05 mg/ml PI in PBS. Cells were incubated for 2 h at 37°C and analyzed by flow cytometry.
Growth
Trypanosomes treated with either I-BET151 or Dox were diluted to 100,000 cells/ml in HMI-9 every 24 h, counted on a hemacytometer and compared to DMSO control-treated cells or untreated cells (for Dox treatments).
Viability
Three independent cultures of trypanosomes were treated with I-BET151 for 3 d or with DMSO as a control. Following treatment cells were washed, counted on a hemacytometer and then serially diluted to a concentration of 5 cells/100μL HMI9 or 50 cells/10 0μL HMI9 with
no drug. They were plated on three 96-well plates and cultured for 3–4 d at 37°C before
quanti-fying the number of wells growing in each plate. An aliquot of each culture was subjected to PI staining (BD 51–66211) at 0.75μg/ml to assess viability and countbright beads (Life
technolo-gies C36950) were added to quantify cell growth. Washed cells were allowed to recover for 3 d before being subjected to PI staining again.
RNA-Seq
RNA was extracted from treated or control cells using RNA Stat-60 (Tel-Test) following the manufacturer’s protocol and quantified on a NanoDrop2000c. Following DNAse treatment on 5μg of RNA, poly(A)+sequencing libraries were prepared using the NEBNext Poly(A) mRNA
three and aligned first to the reference genome (Tb927v5.1) and then to the Lister 427 VSGnome [1] using bowtie [54] to uniquely align reads and allowing for two mismatches. For the ESAG analysis, reads were uniquely aligned allowing for zero mismatches to unambigu-ously determine the BES. Example commands are given below.
trim_galore—stringency 3 L224-1_CGATGT_L002_R1_001.fastq.gz
bowtie—best—strata -t -v 2 -a -m 1—sam—un UN_L224-iB_1_140804_tb927_v5.1 /Users/ dschulz/To_Clean/bowtie-0.12.8/indexes/140804_tb927_v5.1 L224-1_CGATGT_L002_R1_001. fq L224-iB_1_140804_tb927_v5.1.sam
bowtie—best—strata -t -v 0 -a -m 1—sam /Users/dschulz/To_Clean/bowtie-0.12.8/indexes/ 141107_VSGs_CDSs_ESAGs UN_L224-iB_1_140804_tb927_v5.1 L224-iB_1_141107_VSGs_ CDSs_ESAGs_m1_v0.sam
RPKM values were quantified using SeqMonk from Babraham Bioinformatics (http://www. bioinformatics.babraham.ac.uk/projects/seqmonk) or, in the case ofVsg- andESAG-aligned reads, custom python scripts. All sequencing reads were performed in biological duplicate or triplicate and RPKM values were averaged. For reads aligning to the genome, DESeq [24] was used to generatep-adjusted values using the negative binomial test for differences between the base means for two conditions with the following command: nbinomTest(cds, condA, condB). For reads aligning toVSGs andESAGs, Q values were calculated using SeqMonk’s statistical replicate set test, which adjusts thep-values using Benjamimi and Hochberg correction. Note that the Bdf2 dataset had to be sequenced more deeply forESAGanalysis because of the strin-gent parameters used (unique alignments with no mismatches). This dataset was sequenced in duplicate rather than triplicate, so nop-values were generated for the Bdf2ESAGanalysis shown inS9 Fig. Plots from RNA-seq were generated using python’s matplotlib library. Box-plots were generated using the command plt.boxplot(data). ScatterBox-plots were generated using plt.scatter(x,y). All other plots were generated using plt.plot(data).
GSEA
GSEA analysis [25] was conducted using software available athttp://www.broadinstitute.org/ gsea/index.jsp. We used custom sets of functional groups and hierarchical clusters defined in [35]. These sets are provided as Additional File 3 and Additional File 4 inS1 Data. For time course data, GSEA was run using the Pearson metric for ranking genes in a time series with the following parameters:
Permutations: 1000
Collapse dataset to gene symbols: False Permuation type: gene_set
Enrichment statistic: weighted Metric for ranking genes: Pearson Gene list sorting mode: real
Gene list ordering mode: descending Max size: 500
Min size: 1
An example command is given below