Sparse Modeling Reveals miRNA Signatures
for Diagnostics of Inflammatory Bowel
Disease
Matthias Hübenthal1☯, Georg Hemmrich-Stanisak1☯
*, Frauke Degenhardt1,
Silke Szymczak1¤, Zhipei Du1, Abdou Elsharawy1,2, Andreas Keller3, Stefan Schreiber1,4,
Andre Franke1
1Institute of Clinical Molecular Biology, Christian-Albrechts-University of Kiel, Kiel, Germany,2Chemistry Department, Division of Biochemistry, Faculty of Sciences, Damietta University, New Damietta City, Egypt, 3Chair for Clinical Bioinformatics, Saarland University, Saarbruücken, Germany,4Department of Internal Medicine I, University Hospital Schleswig-Holstein, Kiel, Germany
☯These authors contributed equally to this work.
¤ Current address: Institute of Medical Informatics and Statistics, Christian-Albrechts-University of Kiel, Kiel, Germany
Abstract
The diagnosis of inflammatory bowel disease (IBD) still remains a clinical challenge and the most accurate diagnostic procedure is a combination of clinical tests including invasive endos-copy. In this study we evaluated whether systematic miRNA expression profiling, in conjunc-tion with machine learning techniques, is suitable as a non-invasive test for the major IBD phenotypes (Crohn's disease (CD) and ulcerative colitis (UC)). Based on microarray technol-ogy, expression levels of 863 miRNAs were determined for whole blood samples from 40 CD and 36 UC patients and compared to data from 38 healthy controls (HC). To further discrimi-nate between disease-specific and general inflammation we included miRNA expression data from other inflammatory diseases (inflammation controls (IC): 24 chronic obstructive pulmo-nary disease (COPD), 23 multiple sclerosis, 38 pancreatitis and 45 sarcoidosis cases) as well as 70 healthy controls from previous studies. Classification problems considering 2, 3 or 4 groups were solved using different types of penalized support vector machines (SVMs). The resulting models were assessed regarding sparsity and performance and a subset was selected for further investigation. Measured by the area under the ROC curve (AUC) the corre-sponding median holdout-validated accuracy was estimated as ranging from 0.75 to 1.00 (including IC) and 0.89 to 0.98 (excluding IC), respectively. In combination, the corresponding models provide tools for the distinction of CD and UC as well as CD, UC and HC with expected classification error rates of 3.1 and 3.3%, respectively. These results were obtained by incor-porating not more than 16 distinct miRNAs. Validated target genes of these miRNAs have been previously described as being related to IBD. For others we observed significant enrich-ment for IBD susceptibility loci identified in earlier GWAS. These results suggest that the pro-posed miRNA signature is of relevance for the etiology of IBD. Its diagnostic value, however, should be further evaluated in large, independent, clinically well characterized cohorts. OPEN ACCESS
Citation:Hübenthal M, Hemmrich-Stanisak G, Degenhardt F, Szymczak S, Du Z, Elsharawy A, et al. (2015) Sparse Modeling Reveals miRNA Signatures for Diagnostics of Inflammatory Bowel Disease. PLoS ONE 10(10): e0140155. doi:10.1371/journal. pone.0140155
Editor:Mathias Chamaillard, INSERM, FRANCE
Received:March 30, 2015
Accepted:September 22, 2015
Published:October 14, 2015
Copyright:© 2015 Hübenthal et al. This is an open access article distributed under the terms of the
Creative Commons Attribution License, which permits unrestricted use, distribution, and reproduction in any medium, provided the original author and source are credited.
Data Availability Statement:All relevant data are within the paper and its Supporting Information files.
Funding:This study was supported by the German Ministry of Education and Research (BMBF) program e:Med sysINFLAME (http://www.
gesundheitsforschung-bmbf.de/de/5111.php, no.: 01ZX1306A) and received infrastructure support from the Deutsche Forschungsgemeinschaft (DFG) Cluster of Excellence‘Inflammation at Interfaces’
Introduction
Inflammatory bowel disease (IBD) is a complex, polygenic, chronic intestinal disorder of unknown etiology, comprising two major types: Crohn’s disease (CD) and ulcerative colitis (UC). IBD is believed to evolve through a dysregulated response of the immune system to the commensal microbiota associated with intestinal tissues in a genetically susceptible host. The diagnosis of IBD is often achieved only months or years after the first onset of symptoms and still requires a multitude of information from clinical, radiological, endoscopic and histological tests. Extensive heterogeneity is observed in terms of disease presentation, behavior, and response to treatment. However, a definite diagnosis of CD or UC cannot be established in approximately 10%–17% of colitis patients (known as“indeterminate colitis”(IC)) [1] and more than 10% of IBD patients change diagnosis (CD or UC) during the first year of the dis-ease course [2]. Fecal and serological diagnostic tests, e.g. for calprotectin, lactoferrin or CRP (C-reactive protein) as well as serum antibodies like pANCAs (perinuclear antineutrophil cyto-plasmic antibody) and ASCAs (anti-S.cerevisiae antibody), supplement invasive endoscopic/ colonoscopic methods to verify IBD-diagnosis, to differentiate between the major subtypes or to evaluate disease progression [3,4]. In the last 10 years, several genome-wide association stud-ies (GWAS) were carried out to identify common susceptibility variants for IBD. In a large meta-analysis of previous IBD GWAS, including more than 75,000 cases and controls, Jostins
et al. identified 71 additional loci, increasing the total number of known IBD susceptibility loci
with association of genome-wide significance to more than 163 [5]. While GWAS findings have added tremendously to the understanding of disease etiology and the genetic architecture, common genetic variants have low diagnostic value as shown for IBD [6] and other diseases [7]. Other studies, employing mRNA-based measurements of differential gene expression in tissue or peripheral blood of IBD patients of varying disease state, revealed distinct expression patterns [8–11]. Limitations of these studies were reported when comparing cases and healthy controls or trying to classify disease subphenotypes [12]. Non-coding, regulatory microRNAs (miRNAs) have been studied in the context of their function in IBD [13] but especially because of their ability to serve as diagnostic markers, as recently summarized by Chenet al. [14]. As miRNA expression levels are more stable in tissues and body fluids, such as peripheral blood, and as miRNAs act as master-regulators of mRNAs, differential signatures of miRNAs could serve as superior, non-invasive diagnostic markers to verify IBD diagnosis, discriminate between major IBD subphenotypes and to predict prognosis. A core set of deregulated miRNAs has been identified in a series of studies investigating differential miRNA expression in biopsies and peripheral blood of IBD patients [15–22]. Functional links gained from the analysis of IBD-associated miRNA target genes implicate an involvement of cellular pathways of the immune system (NF-κB, IL-23/IL-23R, IL-6/STAT3) [23–29], autophagy [13,30,31], epithelial barrier function [32,33], IBD-associated dysplasia and colorectal cancer [34–36] in IBD disease etiology. Besides these mechanistic insights into the disease, highly accurate predictive sets of miRNAs suitable for diagnostic purposes have not yet been reported. Interestingly, most of the afore-described studies, investigating deregulation of miRNAs, follow the classic approach of statistical hypothesis testing for significant differential expression of single candidate miRNAs. Some publications, however, point out an alternative way of employing large miRNA datasets and machine-learning techniques, such as support vector machines (SVMs) [37] or random forests (RFs) [38]. Keller and colleagues successfully applied SVM-based approaches to identify diagnostic miRNA-profiles for several different diseases [39], such as multiple sclerosis [40,41], lung cancer [42] or male infertility [43]. Others used similar analysis strategies to generate miRNA expression signatures for pharyngeal squamous cell carcinomas [44], thyroid lesions
Professorship) of the“Stiftung Experimentelle Biomedizin”located in Zuerich, Switzerland.
[45], lung adenocarcinoma [46] or pulmonary tuberculosis [47]. Even ulcerative colitis has been investigated using SVMs, leading to a signature of platelet-derived miRNAs [48].
Here we investigate microarray-based miRNA expression profiles from peripheral blood of IBD patients, using penalized SVMs [49] and random forests for distinction of CD and UC from healthy controls and other complex inflammatory diseases (chronic obstructive pulmo-nary disease (COPD), multiple sclerosis, pancreatitis and sarcoidosis). The promising results of our pilot study show, that machine-learning techniques and miRNA signatures should be fur-ther investigated for IBD diagnostics. Moreover, the miRNA profiles identified yield furfur-ther insight into the disease-relevant signaling pathways.
Material and Methods
Patient recruitment and sampling
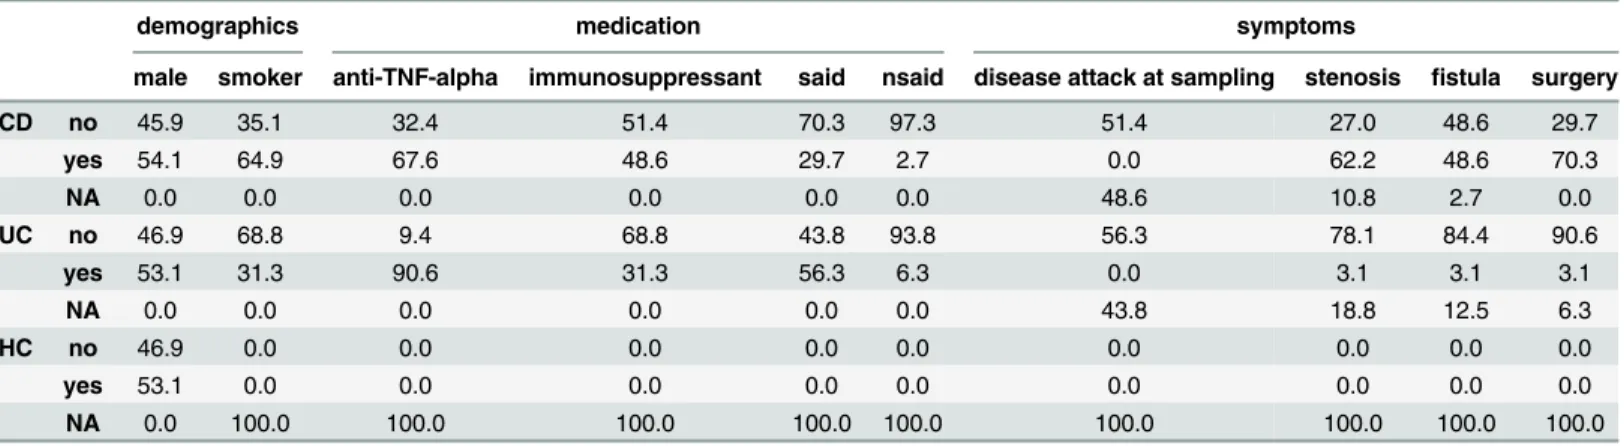
Clinical data and sample material used in this study were obtained under written informed consent of patients as well as healthy donors, and under approvals of the local ethics commit-tees (Biobank Popgen & Ethik-Komission der Medizinischen Fakultät, Universitätsklinikum Schleswig-Holstein, Kiel). We randomly selected blood samples of 40 CD, 36 UC patients and included 38 healthy controls (HC) from our biobank. Patients were collected at the UKSH ter-tiary referral center. Diagnoses were verified by a clinician after reviewing the respective medi-cal health records. As shown inTable 1, patients of every group were matched regarding demographic parameters (mean age at diagnosis of 27.3 and 28.1 years for CD and UC cases, respectively; mean age at sampling of 46.0 and 43.8 years for CD and UC cases, respectively; fraction of males of 54.1% in CD and 53.1% in UC patients, respectively). The majority of the patients was treated with anti-TNF-αinhibitors, such as Infliximab or Mesalazine (67.6% of CD and 90.6% of UC cases) and is therefore assumed to be stable regarding the clinical presen-tation. The activity of immune cells is assumed to be altered partially since a fraction of the patients additionally was treated with immunosuppressive drugs, such as Azathioprine, Cyclo-sporine, 6-Mercaptopurine or Tacrolimus (48.6% of CD and 31.3% of UC cases). Furthermore a substantial fraction of the patients underwent the clinically common treatment with SAIDs (steroidal anti-inflammatory drugs; 29.7% of CD and 56.3% of the UC cases, respectively) and/ or NSAIDs (non-steroidal anti-inflammatory drugs; 2.7% of CD and 6.3% of the UC cases, respectively). However, based on the available data exacerbation of IBD at sampling was ruled out for 51.4% of CD and 56.3% of UC cases.
Table 1. Characterization of the study subjects. Grouped by CD, UC and HC frequency information (in percent) on demographics (gender and smoking status), medication (anti-TNF-α, immunosuppressant, SAIDs and NSAIDs) as well as symptoms (disease attack at sampling, stenosis, fistula and surgery) is shown.
demographics medication symptoms
male smoker anti-TNF-alpha immunosuppressant said nsaid disease attack at sampling stenosis fistula surgery
CD no 45.9 35.1 32.4 51.4 70.3 97.3 51.4 27.0 48.6 29.7
yes 54.1 64.9 67.6 48.6 29.7 2.7 0.0 62.2 48.6 70.3
NA 0.0 0.0 0.0 0.0 0.0 0.0 48.6 10.8 2.7 0.0
UC no 46.9 68.8 9.4 68.8 43.8 93.8 56.3 78.1 84.4 90.6
yes 53.1 31.3 90.6 31.3 56.3 6.3 0.0 3.1 3.1 3.1
NA 0.0 0.0 0.0 0.0 0.0 0.0 43.8 18.8 12.5 6.3
HC no 46.9 0.0 0.0 0.0 0.0 0.0 0.0 0.0 0.0 0.0
yes 53.1 0.0 0.0 0.0 0.0 0.0 0.0 0.0 0.0 0.0
NA 0.0 100.0 100.0 100.0 100.0 100.0 100.0 100.0 100.0 100.0
miRNA extraction and microarray measurement
After sampling, peripheral blood was anticoagulated using ethylenediaminetetraacetic acid (EDTA) and immediately processed for RNA isolation. Total RNA, including miRNAs, was extracted using the miRNeasy Mini Kit (Qiagen GmbH, Hilden, Germany) and stored at -80°C. All samples were analyzed on the automated Geniom Real Time Analyzer (GRTA, febit biomed GmbH, Heidelberg, Germany) using the Geniom miRNA Biochip for Homo sapiens, covering 866 human miRNA species [50]. Since miRBase has been updated from version 12 to 14 during the time course of the study, we used 863 miRNAs that were consistently present in all three versions for the final data analysis. Biotin labeling was conducted by microfluidic enzymatic on-chip labeling of miRNAs as described previously [51]. Hybridization was carried out for 16 hours at 42°C followed by signal enhancement processing with GRTA. Detection images were analyzed using the Geniom Wizard Software.
Data preprocessing
Sample data for other inflammatory diseases, representing the inflammation control panel for the current investigation, was taken from a previously published study [39]. This dataset com-prised 24 COPD, 23 multiple sclerosis, 38 pancreatitis and 45 sarcoidosis cases as well as another 70 healthy controls. Raw data of these samples was downloaded from Gene Expression Omnibus (GEO, Accession code: GSE31568) and analyzed jointly with raw data of samples generated for this study. Samples with median background-subtracted intensity exceeding 1.5IQRwhere removed as outliers resulting in 273 samples, including 37 CD, 32 UC, 92 HC, 23 COPD, 23 multiple sclerosis, 35 pancreatitis and 32 sarcoidosis cases. To account for batch effects arising from differences in the source of data the background-subtracted intensity values were centered with regard to the medians of the healthy controls. Normalization then was per-formed using the R package vsn [52] for robust calibration and variance stabilization.
Classification with penalized support vector machines
To obtain mathematical models that allow diagnostic applications as well as the elucidation of the role of miRNAs in the development of IBD, different types of classification problems were investigated. Aiming for the distinction between CD, UC and HC initially a set of mod-els considering 2 groups was examined (CD vs. HC, UC vs. HC, CD vs. UC). Classification problems additionally incorporating IC (CD vs. IC, UC vs. IC, IC vs. HC) were carried out to differentiate CD, UC and HC from general inflammation. Models aiming for the distinction of combinations of groups were examined by jointly considering 3 groups (CD vs. UC+HC, UC vs. CD+HC, HC vs. CD+UC as well as CD vs. UC+IC, UC vs. CD+IC, IC vs. CD+UC). Finally, also a set of models allowing for 4 groups was investigated (CD vs. UC+HC+IC, UC vs. CD+HC+IC, HC vs. CD+UC+IC, IC vs. CD+UC+HC). Each of the 16 classification prob-lems was solved using different types of linear penalized support vector machines, namely LASSO SVM, elastic net SVM, SCAD SVM and elastic SCAD SVM. Additionally, the linear standard SVM not performing feature selection was used as a reference. It is worth noting that not every classification problem considered has a diagnostic meaning. However, for the subsequent construction of combined classifiers, none of these can be neglected.
model complexity to provide sparse solutions, i.e. small sets of features that enable good classification.
For data D2 fðxi;yiÞjxi2R m
;yi2 f 1;1ggni¼1with input vectors xiand class labels yifor i = 1,. . ., n the SVM optimization problem corresponds to the minimization ofkbk2
2with
respect to the decision rule yiðbxi b0Þ 1. As shown by Hastie [49] this also can be written
as a regularization problem minb0;b
Pn
i¼1 Lðyi;fðxiÞÞ þplðbÞwhere Lðyi;fðxiÞÞ ¼maxð0;1 yiðβxi b0ÞÞis a loss (or cost) function and plðbÞa penalty function with parameterλ. The
classic choices of plðbÞinclude the ridge penalty [49] (standard SVM, plðbÞ ¼lkbk
2
2) and the
LASSO [53] (least absolute shrinkage and selection operator, plðbÞ ¼lkbk1) as well as their
combination known as the elastic net [54] (plðbÞ ¼l1kbk1þl2kbk 2
2; l1;l10). More
recently a penalty function improving the properties of the LASSO was published. The SCAD (smoothly clipped absolute deviation) penalty [55] is given by the quadratic spline
pSCAD
l ðbÞ ¼ Xm
j¼1
ljbjjIðjbjj lÞ þ
jbjj2 2aljbjj þl2
2ða 1Þ Iðl<jbjj alÞ þ
ðaþ1Þl2
2 Iðjbjj>alÞ
!
for a>2 andλ>0 and indicator function I(). Similar to the LASSO this function provides feature
selection by shrinking small coefficients |βj|λto zero (resulting in a sparse model). However, in
contrast to the LASSO it applies a constant penalty to large coefficients |βj|>aλ(resulting in an
approximately unbiased model). Combining SCAD with the ridge penaltyfinally results in the elas-tic SCAD penalty [56] defined as pðbÞ ¼pSCAD
l1 ð
bÞ þl2kbk 2
2with tuning parametersλ1,λ20.
Efficient implementations of SVMs regularized using the penalty functions mentioned before are available in the R package penalizedSVM (version 1.1) [57].
The normalized miRNA expression data were randomly split at a ratio of 5:3, preserving the proportion of samples per group. The first partition was used to construct the respective model, whereas the second was used for evaluation. To estimate the distribution of each mod-el’s predictive performance, the partitioning was conducted repeatedly applying 500-fold hold-out sampling (random choice of samples withhold-out replacement). The tuning parameters thereby were trained using 5-fold cross validation and fixed grid search based on the respective training datasets. The final SVMs then were obtained by selecting the sparsest median perform-ing model for each investigated classification task. A classifier’s performance thereby was mea-sured by the area under the receiver operating characteristic (ROC) curve (AUC, sensitivity as a function of 1-specificity). For illustrative purpose, additional performance measures of vary-ing informational content were determined, e.g. balanced accuracy (BAC), sensitivity (SN), specificity (SP). For each classification problem the sets of miRNAs (miRNA signatures) con-sidered by the sparsest median performing model were selected for further investigation, including validation with random forests and target enrichment analysis.
Validation with random forests
A second machine-learning approach, random forest (RF), was used to analyze the reported miRNA dataset. RF is an ensemble tree method that was first introduced by Breimanet al. in 2001 [38], and has been shown to be accurate in both classification and regression problems. Randomization is introduced by constructing each decision tree with a randomly chosen boot-strap sample. Additionally, at each node the optimal splitting variable is selected among a ran-dom subset of variables (predictors). Variables selected in RF classification trees are assigned an importance score that is a measure of how much the particular predictor contributes to clas-sifying the respective data. In this study relative recurrency variable importance metric
(r2VIM), recently proposed as a measure of variable importance, was used. Based on the per-mutation importance scheme this measure reduces noisy signal selection [59]. For further details on the concept of RF refer to Stroblet al. [60]).
To evaluate the validity of the feature selection employed by the penalized SVMs, two ran-dom forests were built for each classification problem. While the first model incorporated vari-ables per holdout selected by the RF, the second contained varivari-ables per holdout selected by the SVM (holdout signature). To further validate the meaningfulness of the proposed miRNA sig-nature, another two random forests were built. This time the variable set was constant across the training datasets for each classification problem. For the third model all variables selected in at least one training dataset were ranked by the number of times they were selected and the 50% most frequently selected variables (top signature) were used for training of the RF. Finally, for the fourth model the variables incorporated by the sparsest median performing SVM (median signature) were used.
For comparability, model training, as well as evaluation, incorporated the randomly selected datasets (500-fold holdout partitioning) previously used to construct the SVM classifier. As a measure of model performance again the area under the ROC curve (AUC) was used. All RF analyses were performed in R (version 3.0.1) using the packages parallelRandomForest (version 4.6–7) and ROCR (version 1.0–5) [61]. For each forest, 500 trees (ntree) were built with a ter-minal node size (nodesize) of 10% of the sample size. The number of randomly selected vari-ables at each node (mtry) was set to the square root of the total number of predictors. For each analysis a random seed was set to a randomly chosen number between 1 and 100,000.
miRNA target gene enrichment analysis
Experimentally validated miRNA target genes were extracted from miRTarBase [62] version 4.5 and tested for significant enrichment within the previously published IBD susceptibility loci [5]. In total more than 163 genetic risk loci have been previously identified as being associ-ated with inflammatory bowel disease (CD: 30, UC: 23, IBD: 110) [5]. 49 out of 1332 experi-mentally validated miRNA target genes, as listed in miRTarBase, overlap with these loci. To test for overrepresentation of risk loci among the targets of the miRNAs selected for distin-guishing CD, UC and HC, Fisher’s exact test was applied (see alsoS7 Table). Enrichment was considered as being significant in case p-values were smaller than 0.05. Adjustment for multi-ple testing was conducted using Bonferroni correction.
Results
Differential expression analysis of peripheral blood miRNAs
utilizing the Geniom Biochip miRNA (Homo sapiens). After batch-correction and normaliza-tion the background-subtracted microarray intensity values did not show considerable sample-based mean-variance dependencies or sample-sample-based variability of dispersion estimates. As illustrated using multidimensional scaling based on Spearman’s rank correlation distance (S1 Fig), the groups of interest are visually hardly distinguishable.
In the differential expression analysis (summarized inS1 Table)we were able to identify 292 and 353 miRNAs as being significantly deregulated in CD and UC, respectively, when compared to healthy controls (Student's t-test with significance threshold of 0.05 applied to p-values adjusted for multiple testing according to Holm’s sequential Bonferroni method). In terms of miRNA expression level differences these results correspond well to previously pub-lished findings (seeS2 FigandS2 Table). The degree of consistency, thereby, increases with the sample size of the reference study. The correspondence to expression levels of the core set of altered miRNAs involved in IBD [14] was estimated to be 75.0%. Additional 20 miRNAs investigated by Wuet al. (14 cases of active CD, 10 cases of active UC, 13 HC) agree with our data in 45.0% of the cases [16]. Evaluation of another 7 miRNAs identified in a study employ-ing 20 UC and 20 HC samples shows a correspondence of 71.4% [48]. Finally, the studies con-ducted by Zahmet al. [18] (11 deregulated miRNAs identified in 46 cases of active CD and 32 HC) and Paraskeviet al. [22] (17 miRNAs, 128 cases of active CD, 88 cases of active UC, 162 HC) completely overlap with our results (correspondence of 100.0%). Interestingly, a large pro-portion of miRNAs that have previously been reported as being differentially expressed only for a certain group (CD or UC) appear to be deregulated similarly in both subtypes in our data and thus may be general IBD miRNAs. This effect may be explained due to the smaller sample size and/or higher variability in previous studies.
Classification with penalized support vector machines
Since there are various ways to construct complex classifiers for the distinction between CD, UC and HC (and IC, respectively), we assessed different types of penalized SVMs as well as the corresponding sets of miRNAs based on model performance and sparsity. Considering models incorporating 2 groups, differences in holdout-based median classifier performance of the penalization methods were small. However, due to its theoretic properties, the elastic SCAD SVM (median AUC = 0.97) was chosen for further investigation. Plots and tables illustrating the performance of the LASSO SVM (median AUC = 0.96), elastic net SVM (median AUC = 0.94) and SCAD SVM (median AUC = 0.95) are shown inS4–S6FigsandS3–S5 Tables.
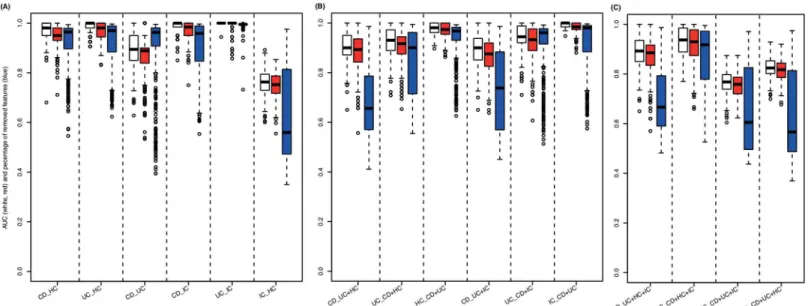
Fig 1summarizes the elastic SCAD SVM’s performance in solving the 16 different diagnos-tic problems measured by the area under the curve (AUC). The models incorporating 2 groups show stable superiority (median AUC = 0.97; 0.98 including vs. 0.95 excluding IC) in compari-son to the models considering 3 groups (median AUC = 0.92; 0.93 including vs. 0.92 excluding IC) or 4 groups (median AUC = 0.85). In addition, these models provide remarkable sparsity (median percentage of miRNAs removed = 99.3%, 99.4% including vs. 99.2% excluding IC) and only marginal loss of performance compared to the standard SVM. As shown inTable 2, in terms of median sensitivity and specificity, the performance of the selected models can be estimated as 1.00 and 0.90, respectively (1.00 and 0.91 including IC, 1.00 and 0.90 excluding IC). The median balanced accuracy (BAC) was 0.95 (0.96 including IC, 0.95 excluding IC). Additional performance measures (e.g. median Matthews correlation coefficient (MCC) and Youden’s index (YOUDEN)) are listed inS3 Tablefor each particular classifier.
hsa-miR-34b-Fig 1. SVM classification results.Measured by the area under the ROC curve (AUC), classification performance is shown for models considering(A)2 groups (CD vs. HC, UC vs. HC, CD vs. UC, CD vs. IC, UC vs. IC, IC vs. HC),(B)3 groups (CD vs. UC+HC, UC vs. CD+HC, HC vs. CD+UC, CD vs. UC+IC, UC vs. CD+IC, IC vs. CD+UC) and(C)4 groups (CD vs. UC+HC+IC, UC vs. CD+HC+IC, HC vs. CD+UC+IC, IC vs. CD+UC+HC). Performance of linear standard SVMs (considering every miRNA measured, white boxes) is compared to linear elastic SCAD SVMs (considering subsets of miRNAs measured, red boxes). In addition, as a measure of model complexity the percentage of miRNAs neglected for constructing the respective penalized SVMs are plotted (blue boxes).
doi:10.1371/journal.pone.0140155.g001
Table 2. Performance measures for the different classification models.Corresponding to the classification accuracy of the sparsest median performing penalized SVM (seeFig 1) for each classifier area under the ROC curve (AUC), sensitivity (SN = TPR, true positive rate), specificity (SP = TNR, true negative rate) and balanced accuracy (BAC = (SN+SP)/2) are shown.
#groups classifier AUC SN SP BAC
CD/HC 0.950 0.963 1.000 0.981
UC/HC 0.981 1.000 0.900 0.950
CD/UC 0.889 1.000 0.833 0.917
2 median 0.950 1.000 0.900 0.950
CD/IC 0.984 1.000 0.909 0.955
UC/IC 1.000 1.000 1.000 1.000
IC/HC 0.752 0.750 0.765 0.757
median 0.984 1.000 0.909 0.955
CD/UC+HC 0.893 0.969 0.692 0.831
UC/CD+HC 0.917 0.971 0.800 0.886
HC/CD+UC 0.974 1.000 0.963 0.981
3 median 0.917 0.971 0.800 0.886
CD/UC+IC 0.876 0.951 0.800 0.876
UC/CD+IC 0.933 0.976 0.889 0.933
IC/CD+UC 0.984 0.950 1.000 0.975
median 0.933 0.951 0.889 0.933
CD/UC+HC+IC 0.885 0.970 0.800 0.885
UC/CD+HC+IC 0.930 0.985 0.800 0.893
4 HC/CD+UC+IC 0.758 0.830 0.708 0.769
IC/CD+UC+HC 0.817 0.860 0.765 0.813
median 0.851 0.915 0.783 0.849
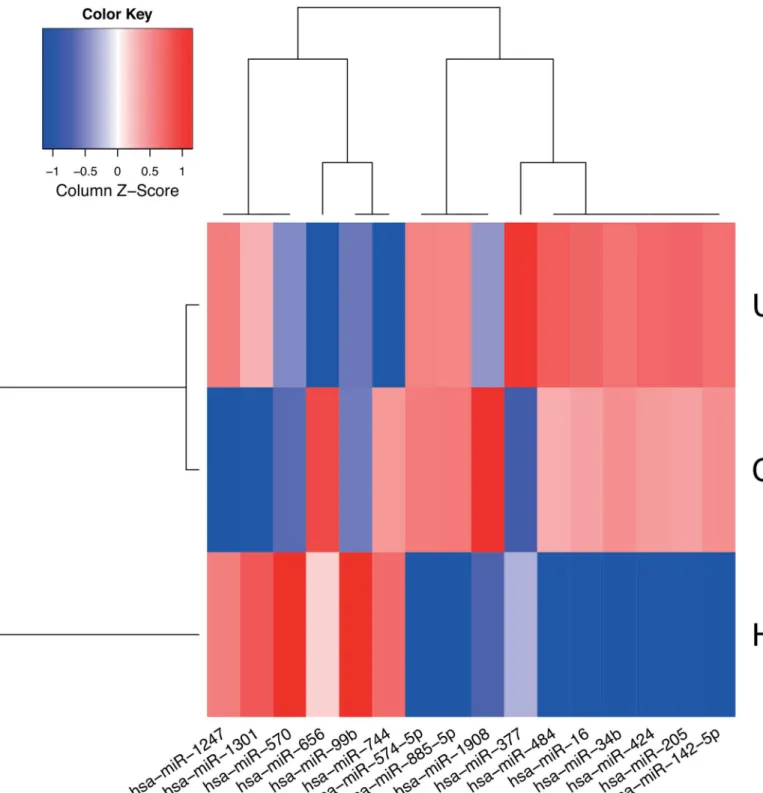
3p, hsa-miR-142-5p, hsa-miR-205-5p, hsa-miR-424-5p, hsa-miR-570-3p, hsa-miR-885-5p, hsa-miR-1301-3p (CD vs. HC), hsa-miR-16-5p, hsa-miR-34b-3p, hsa-miR-99b-5p (UC vs. Fig 2. Expression profile of signature miRNAs.Median normalized expression levels for miRNAs considered by the final models (sparsest median performing elastic SCAD SVMs) used to distinguish CD, UC and HC are shown. The heat map was generated using a distance function based on
Spearman’s rank correlation coefficient and agglomerative hierarchical clustering using complete-linkage. Low and high expression levels are plotted using red and blue, respectively.
HC) and hsa-miR-34b-3p, hsa-miR-377-3p, hsa-miR-484, hsa-miR-574-5p, hsa-miR-656-3p, hsa-miR-744-5p, hsa-miR-1247-5p, hsa-miR-1908-5p (CD vs. UC, miRBase version 21 nomenclature). The corresponding models provide tools for the distinction of CD and UC as well as CD, UC and HC with remarkable small classification error rates of 3.1 and 3.3%, respec-tively (i.e. applying the proposed models will result in approximately 3 incorrect diagnoses per 100 tests). Notably, these estimates are not based on an independent dataset. Therefore, they are potentially optimistic but still provide a measure for the combined classifier’s diagnostic value. This is confirmed by permutation tests showing significant deviation of the classification error from its random expectation. For further examples of classifier combinations and the cor-responding size of miRNA signatures seeS6Table.
Validation using random forests
A second, independent machine learning approach, random forest analysis (RFs), was employed to validate our SVM-based miRNA signatures. As shown inTable 3, random forest analyses confirmed our SVM results. In the case of models considering 2 groups, the perfor-mance differences were small (AUC = 0.990 for the SVM using the entirety of the miRNAs, AUC = 0.992 for the RF per holdout sample using miRNAs selected by the RF and
AUC = 0.996 for the RF using the top 50% of the miRNAs most frequently selected by the RF across all runs). When using the miRNAs selected by the elastic SCAD SVM for training the RF in the same way, highly accurate models were obtained: AUC = 0.965 for the elastic SCAD SVM, AUC = 0.992 for the RF per holdout sample using miRNAs selected by the elastic SCAD SVM and AUC = 0.994 for the RF using the miRNAs considered by the median performing elastic SCAD SVM. These results strongly support the validity of the miRNA combinations chosen as putative diagnostic markers by the SVM approach.
Target genes of the diagnostic miRNA signature correlate with
susceptibility genes
To assess the potential biological significance of miRNAs within the signatures revealed by the machine-learning approaches we correlated previous knowledge about disease relevance of IBD-related genes to the experimentally validated target genes of the miRNA signatures (results summarized inTable 4andS7 Table). Irrespective of the miRNA signature tested (CD vs. HC, UC vs. HC or CD vs. UC), we observed an overlap of miRNA target genes and pub-lished IBD-related genes or, on the other hand, genes within known IBD susceptibility loci. Thus, target genes of signature miRNAs used for the distinction of CD and HC are significantly enriched for loci known to be associated with CD (p = 3.2210−3), UC (p = 1.0910−3) and
sug-gestive for IBD (p = 4.3710−2). Targets of signature miRNAs used for the distinction of UC
and HC show suggestive enrichment for loci associated with CD (p = 3.3410−2). Considering
Table 3. Comparison of classification approaches. The table shows the median classifier performance (AUC) of the classification problems considering different numbers of groups (2, 3 and 4) and models (SVM and RF). Performance of the standard SVM is compared to the elastic SCAD SVM (a). Perfor-mance of the RF per holdout sample using the miRNAs selected by the RF is compared to the RF per holdout sample using the miRNAs selected by the elas-tic SCAD SVM (b). Performance of the RF using the top 50% of the miRNAs most frequently selected by the RF across all runs is compared to the RF using the miRNAs selected by the median performing elastic SCAD SVM (c). For each comparison performance estimates based on miRNAs selected by the elas-tic SCAD SVM are enclosed in parentheses.
classification signature 2 groups 2 groups, no IC 3 groups 3 groups, no IC 4 groups
(a) SVM 0.990 (0.965) 0.981 (0.950) 0.938 (0.925) 0.931 (0.917) 0.858 (0.851)
(b) RF, holdout signature 0.992 (0.992) 0.985 (0.985) 0.978 (0.980) 0.969 (0.974) 0.919 (0.910) (c) RF, top/median signature 0.996 (0.994) 0.992 (0.988) 0.982 (0.989) 0.977 (0.992) 0.941 (0.940)
the targets of the complete set of miRNAs used for the distinction of CD, UC and HC sugges-tive enrichment is observed for previously published susceptibility loci of CD (p = 4.8010−3)
and UC (p = 4.8010−3).
In a next step we investigated whether previously identified genetic variation in the IBD sus-ceptibility genes could directly play a role in miRNA-target gene interaction. We used dbSNP annotations of the human genome provided by the UCSC genome browser to identify SNPs that could interfere with miRNA binding sites. As a result we found that most 3’-UTRs of the analyzed IBD-risk genes indeed exhibit genetic variation (SNPs and small InDels) but mostly not in the respective signature-miRNA binding site regions. Only for hsa-miR-99b, which is part of the UC signature, we were able to identify potentially interesting SNPs located in the essential miRNA binding site seed regions of RAVER2 (rs183861354, chr1:64831085, G>A)
and mTOR (rs375505566, chr1:11107188, G>A). Strikingly, both SNPs change the same
nucleotide position within the seed region of the miRNA binding site. Whether this single nucleotide variant affects the binding behavior and as a consequence the gene functions in IBD cases compared to healthy controls, remains to be shown.
Discussion
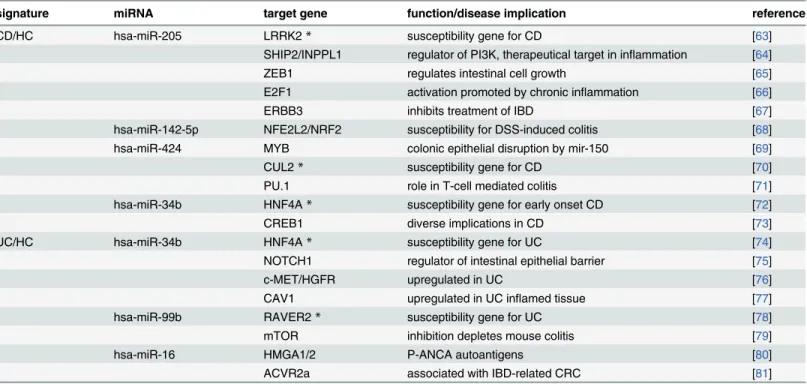
In this study we compared miRNA expression profiles of whole peripheral blood samples from patients with inflammatory bowel disease (Crohn’s disease and ulcerative colitis) to healthy controls and“disease controls”. We were able to confirm significantly deregulated miRNAs in blood that were previously reported by others and could further add new candidates to the cat-alogue of IBD-associated miRNAs. To our knowledge this study represents the largest (both in terms of samples and measured miRNAs) blood-based miRNA-expression study for IBD pub-lished to date. Our analysis, however, was focused on the identification of disease specific, Table 4. Signature miRNAs regulate target genes previously identified as IBD-risk genes.Both CD and UC diagnostic signatures contain several miR-NAs that regulate experimentally validated target genes known to be involved in IBD-related phenotypes in humans and/or mice. Genes marked with*have even been reported as candidate genes in susceptibility loci identified in recent IBD GWAS.
signature miRNA target gene function/disease implication reference
CD/HC hsa-miR-205 LRRK2* susceptibility gene for CD [63]
SHIP2/INPPL1 regulator of PI3K, therapeutical target in inflammation [64]
ZEB1 regulates intestinal cell growth [65]
E2F1 activation promoted by chronic inflammation [66]
ERBB3 inhibits treatment of IBD [67]
hsa-miR-142-5p NFE2L2/NRF2 susceptibility for DSS-induced colitis [68]
hsa-miR-424 MYB colonic epithelial disruption by mir-150 [69]
CUL2* susceptibility gene for CD [70]
PU.1 role in T-cell mediated colitis [71]
hsa-miR-34b HNF4A* susceptibility gene for early onset CD [72]
CREB1 diverse implications in CD [73]
UC/HC hsa-miR-34b HNF4A* susceptibility gene for UC [74]
NOTCH1 regulator of intestinal epithelial barrier [75]
c-MET/HGFR upregulated in UC [76]
CAV1 upregulated in UC inflamed tissue [77]
hsa-miR-99b RAVER2* susceptibility gene for UC [78]
mTOR inhibition depletes mouse colitis [79]
hsa-miR-16 HMGA1/2 P-ANCA autoantigens [80]
ACVR2a associated with IBD-related CRC [81]
diagnostic classification signatures derived from the overall miRNA expression profiles irre-spective of single miRNA deregulation.
miRNAs are often referred to as“blood-based biomarkers”for diagnosing disease or moni-toring disease progression. As it has been shown for several types of cancer this holds true as long as a relatively stable condition, such as a recurrent aberrant gene expression in certain tis-sues or exosomal miRNA content can be measured repeatedly. Concerning blood-based miRNA expression in inflammatory or auto-immune diseases, however, the assumption of sta-ble conditions is often violated. Numerous known comorbidities as well as environmental and life-style factors, treatment and disease activity may influence miRNA levels in the blood stream and lead to intra- and interindividual miRNA-expression variability. Also general fac-tors like blood cell composition, depending on the type of disease may vary significantly, and hence impact miRNA levels in peripheral blood. Thus, instead of aiming to identify single miRNA“biomarkers”, to enhance predictive power it appears more promising to investigate complex predictors that are based on larger numbers of miRNAs. In this way, besides simple deregulation, also certain combinations of regulatory effects are taken into account for diagnos-tic or predictive models.
In this work we demonstrated the use of machine-learning techniques to construct IBD-spe-cific miRNA signatures and we were able to reveal highly accurate classification models that distinguish healthy and diseased individuals as well as the two main IBD subtypes and other inflammatory conditions from each other. Furthermore, a minimal set of not more than 16 miRNAs, being sufficient for sensitive and specific classification, holds great promises and should be further evaluated in independent sample panels.
The here-investigated models represent solutions to construct classifiers for miRNA expres-sion data but they also exhibit some limitations, most notably the limited generalizability of the models to other technologies. All models are trained based on the same type of data that origi-nate from a certain technology (here the Geniom Array). Application of these models to inde-pendent samples in a clinical or diagnostic setting would always require to remove technology biases. In addition to that, the here-presented classifiers remain restricted to the set of miRNAs that are present on the microarray used to detect differential expression. Future studies utiliz-ing next generation sequencutiliz-ing (NGS) will presumably overcome this limitation as all present miRNAs in a sample are theoretically detectable by this technology. Furthermore, implement-ing approaches that include more levels of available information e.g. genetic variants, micro-biome data or clinical data from electronic health records (that include information on differential diagnoses, medication, disease activity, etc.) will potentially add to the predictive power needed for highly sensitive and specific classification.
Regularized instances of support vector machines incorporate penalties for model complex-ity to prevent overfitting and to provide sparse solutions. In the here-presented study this prop-erty is used to obtain small sets of miRNAs suitable for diagnostic application. It is expected that miRNAs essential for solving a particular classification problem likewise are selected by random forests using the recurrent relative variable importance. However, this approach does not aim at selecting a minimal set of features so that one does not expect miRNA signatures to be fully overlapping. To obtain more comparable results, future studies might consider regular-ized random forests as introduced by Deng and Runger [82]. In this work the miRNA signature selected using the elastic SCAD SVM was confirmed by comparably high classification perfor-mance of random forests as an independent classification approach. For this purpose afore-mentioned limitations can be neglected.
probability of being overfitted to the dataset generated for this study. However, due to correlat-ing expression profiles it is expected that models with matchcorrelat-ing accuracy potentially incorpo-rate differing miRNAs. For the same reason more complex signatures may exist which merely incoporate additional highly correlated miRNAs.
Classifiers for complex diagnostic problems were constructed by majority voting of simpler models. As shown in this study, this approach results in remarkable low classification error rates. However, follow-up studies could potentially incorporate the estimation of class proba-bilities to enhance the interpretability of the classification results.
To get insights into functional implications of the miRNAs contained in the revealed IBD signature, we screened current databases for experimentally validated miRNA-target gene interactions. Notably, a considerable fraction of the target genes within the IBD miRNA signa-tures has been implicated in intestinal diseases (seeTable 4). Many of those targets were identi-fied in recent IBD GWAS but most of the genetic variation detected does not correlate (and thus not interfere) with miRNA regulatory binding sites. Only the hsa-mir-99b binding sites in the 3’-UTRs of the IBD susceptibility gene RAVER2, a ribonucleoprotein (hnRNP) involved in regulation of splicing and mTOR, a serine/threonine proteine kinase, shown to be involved in activation of autophagy, represent good candidates for further experimental investigation. In the future, more complete data on genetic varation in 3’-UTRs of IBD related genes will sup-posedly come from whole genome sequencing approaches and will thus enable for more com-plete analyses of miRNA target genes. In a recent review on genetic studies in IBD Liu and Anderson [83] conclude that most of the identified GWAS loci actually reside in noncoding regions of the genome and that a vast number of these noncoding variants will likely play a role in gene regulation. miRNAs are certainly an important part of the regulatory machinery of the genome, but besides their utility in diagnostics, miRNA signatures might also give valuable insights into disease development and progression.
Supporting Information
S1 Fig. MDS (multidimensional scaling) plots for visualization of background-subtracted intensity values.Background-subtracted intensity values normalized using variance stabiliza-tion(A)before and(B)after median centering based on the batches observed for healthy con-trols. The corresponding medians are indicated by black circles. MDS was performed using a distance function based on Spearman’s rank correlation coefficient. Data points of each group are represented by theirα-shape (generalized convex hull). The second plot visualizes the batch-corrected normalized data used for diagnostic classification.
(TIFF)
S2 Fig. Median expression levels of miRNAs previously published as being deregulated in CD, UC and HC.The horizontal side bar indicates the correspondence between the literature and the dataset used for this study. Measurements with directions of effect deviating from the literature are marked using black bars. The heat map was generated using a distance function based on Spearman’s rank correlation coefficient and agglomerative hierarchical clustering using complete-linkage. Low and high expression levels are plotted using red and blue, respec-tively.
(TIFF)
S3 Fig. Median expression profiles of significantly deregulated miRNAs in CD, UC and HC.For each pair of groups two-sample t-tests were applied. Deregulation was considered as being significant for Holm-corrected p-values<0.05. Not significantly differentially expressed
comparisons. (TIFF)
S4 Fig. Classification results for LASSO SVM.Measured by the area under the ROC curve (AUC) classification performance is shown for models considering(A)2 groups (CD vs. HC, UC vs. HC, CD vs. UC, CD vs. IC, UC vs. IC, IC vs. HC),(B)3 groups (CD vs. UC+HC, UC vs. CD+HC, HC vs. CD+UC, CD vs. UC+IC, UC vs. CD+IC, IC vs. CD+UC) and(C)4 groups (CD vs. UC+HC+IC, UC vs. CD+HC+IC, HC vs. CD+UC+IC, IC vs. CD+UC+HC). Perfor-mance of linear standard SVMs (considering every miRNA measured, white boxes) is com-pared to linear LASSO SVMs (considering subsets of miRNAs measured, red boxes). In addition, as a measure of model complexity the percentage of miRNAs neglected for construct-ing the respective penalized SVMs are plotted (blue boxes).
(TIFF)
S5 Fig. Classification results for elastic net SVM.Measured by the area under the ROC curve (AUC) classification performance is shown for models considering(A)2 groups (CD vs. HC, UC vs. HC, CD vs. UC, CD vs. IC, UC vs. IC, IC vs. HC),(B)3 groups (CD vs. UC+HC, UC vs. CD+HC, HC vs. CD+UC, CD vs. UC+IC, UC vs. CD+IC, IC vs. CD+UC) and(C)4 groups (CD vs. UC+HC+IC, UC vs. CD+HC+IC, HC vs. CD+UC+IC, IC vs. CD+UC+HC). Perfor-mance of linear standard SVMs (considering every miRNA measured, white boxes) is com-pared to linear elastic net SVMs (considering subsets of miRNAs measured, red boxes). In addition, as a measure of model complexity the percentage of miRNAs neglected for construct-ing the respective penalized SVMs are plotted (blue boxes).
(TIFF)
S6 Fig. Classification results for SCAD SVM.Measured by the area under the ROC curve (AUC) classification performance is shown for models considering(A)2 groups (CD vs. HC, UC vs. HC, CD vs. UC, CD vs. IC, UC vs. IC, IC vs. HC),(B)3 groups (CD vs. UC+HC, UC vs. CD+HC, HC vs. CD+UC, CD vs. UC+IC, UC vs. CD+IC, IC vs. CD+UC) and(C)4 groups (CD vs. UC+HC+IC, UC vs. CD+HC+IC, HC vs. CD+UC+IC, IC vs. CD+UC+HC). Perfor-mance of linear standard SVMs (considering every miRNA measured, white boxes) is com-pared to linear SCAD SVMs (considering subsets of miRNAs measured, red boxes). In
addition, as a measure of model complexity the percentage of miRNAs neglected for construct-ing the respective penalized SVMs are plotted (blue boxes).
(TIFF)
S7 Fig. Comparison of SVM and random forest.Measured by the area under the ROC curve (AUC) classification performance is shown for models considering(A)2 groups (CD vs. HC, UC vs. HC, CD vs. UC, CD vs. IC, UC vs. IC, IC vs. HC),(B)3 groups (CD vs. UC+HC, UC vs. CD+HC, HC vs. CD+UC, CD vs. UC+IC, UC vs. CD+IC, IC vs. CD+UC) and(C)4 groups (CD vs. UC+HC+IC, UC vs. CD+HC+IC, HC vs. CD+UC+IC, IC vs. CD+UC+HC). Classifi-cation performance of the linear elastic SCAD SVM (white box) is compared to aRandom for-ests per holdout sample considering variables selected using the SVM(red box) and the Random forest itself (blue box), respectively.
(TIFF)
Classification performance of the linear elastic SCAD SVM (white box) is compared to a Ran-dom forests considering variables selected using the median performing SVM(red box). Additionally, Random forests were trained with the top 50% of the variables ranked by their frequency of selection (blue box).
(TIFF)
S1 Table. Differential expression analysis.For each binary combination of groups t-tests for differential miRNA expression were conducted. The test results are summarized by the fold change (fc), the t-statistic (t), the p-value (p) and the p-values adjusted for multiple testing using Holm-correction (padj).
(XLSX)
S2 Table. miRNAs previously described to be deregulated in IBD.Tables were adapted from
Chenet al.(A)and Coscun et al.(B), respectively. For binary comparisons (CD vs. HC, UC vs.
HC, IBD vs. HC and CD vs. UC). Directions of effect known from the literature as well as mea-sured by the microarray used for this study are summarized.
(XLSX)
S3 Table. Performance measures for LASSO SVM.Corresponding to the classification accu-racy of the sparsest median performing penalized SVM (seeS4 Fig) for each classification task area under the ROC curve (AUC), Matthews correlation coefficient (MCC), balanced accuracy (BAC), Youden’s index (YOUDEN), sensitivity (SN = TPR), specificity (SP = TNR), positive predictive value (PPV), false discovery rate (FDR), negative predictive value (NPV) and false omission rate (FOR) are shown.
(XLSX)
S4 Table. Performance measures for elastic net SVM.Corresponding to the classification accuracy of the sparsest median performing penalized SVM (seeS5 Fig) for each classification task area under the ROC curve (AUC), Matthews correlation coefficient (MCC), balanced accuracy (BAC), Youden’s index (YOUDEN), sensitivity (SN = TPR), specificity (SP = TNR), positive predictive value (PPV), false discovery rate (FDR), negative predictive value (NPV) and false omission rate (FOR) are shown.
(XLSX)
S5 Table. Performance measures for SCAD SVM.Corresponding to the classification accu-racy of the sparsest median performing penalized SVM (seeS6 Fig) for each classification task area under the ROC curve (AUC), Matthews correlation coefficient (MCC), balanced accuracy (BAC), Youden’s index (YOUDEN), sensitivity (SN = TPR), specificity (SP = TNR), positive predictive value (PPV), false discovery rate (FDR), negative predictive value (NPV) and false omission rate (FOR) are shown.
(XLSX)
S6 Table. Exemplary diagnostic application.The final median performing models were used to predict the disease status based on each individual’s miRNA expression data. For each com-bined classifier, constructed using majority voting, the number of groups, n(groups), consid-ered by the atomic models as well as the respective number of miRNAs, n(mirnas), and unique miRNAs, n(unique), are shown. In addition the classification errors per individual’s group (ε
(CD),ε(UC),ε(HC) andε(IC)) were estimated. Furthermore, for each classifier the mean clas-sification error (mean) as well as the corresponding permutation based Z-score (Z(mean)) were calculated. Z-scores corresponding to p-values lower than the significance threshold of 0.05 are marked using.
S7 Table. Enrichment analysis for validated signature miRNA targets.The proportion of validated targets of the miRNAs selected for diagnostic prediction (CD vs. HC, UC vs. HC, CD vs. UC and CD vs. UC vs. HC) known to be coded at risk loci (CD, UC and IBD) is compared to the proportion of general miRNA targets known to be coded at risk loci (CD, UC and IBD). Targets of signature miRNA coded at risk and non-risk loci are denoted as C_r and C, repec-tively. miRNA targets excluding signature targets coded at risk and non-risk loci are denoted as R_r and R, repectively. The total number of validated miRNA targets is denoted as N. Enrich-ment analysis was performed using Fisher’s exact test, resulting p-values are marked as being nominal significant (, p<0.05) and significant after Bonferroni correction for multiple testing
(; padj<0.05).
(XLSX)
S8 Table. Raw miRNA expression data.Background subtracted microarray intensities from Geniom Wizard Software that were used to infer miRNA expression levels.
(XLSX)
Acknowledgments
We thank Matthias Scheffler and Thomas Brefort at the Comprehensive Biomarker Center GmbH, Heidelberg, Germany for sample processing and excellent technical support. This study was supported by the German Ministry of Education and Research (BMBF) program e: Med sysINFLAME (http://www.gesundheitsforschung-bmbf.de/de/5111.php, No.:
01ZX1306A) and received infrastructure support from the Deutsche Forschungsgemeinschaft (DFG) Cluster of Excellence‘Inflammation at Interfaces’(
http://www.inflammation-at-interfaces.de, No.: XC306/2). Andre Franke receives an endowment professorship (Peter Hans
Hofschneider Professorship) of the“Stiftung Experimentelle Biomedizin”located in Zuerich, Switzerland.
Author Contributions
Conceived and designed the experiments: MH GH AF. Performed the experiments: MH GH. Analyzed the data: MH GH FD S. Szymczak. Contributed reagents/materials/analysis tools: ZGD AE AK S. Schreiber. Wrote the paper: MH GH FD S. Szymczak AF.
References
1. Dotan I, Fishman S, Dgani Y, Schwartz M, Karban A, Lerner A, et al. Antibodies against laminaribioside and chitobioside are novel serologic markers in Crohn’s disease. Gastroenterology. 2006; 131: 366–
78. doi:10.1053/j.gastro.2006.04.030PMID:16890590
2. Moum B, Ekbom A, Vatn MH, Aadland E, Sauar J, Lygren I, et al. Inflammatory bowel disease: re-evalu-ation of the diagnosis in a prospective populre-evalu-ation based study in south eastern Norway. Gut. 1997; 40: 328–32. PMID:9135520
3. Lewis JD. The utility of biomarkers in the diagnosis and therapy of inflammatory bowel disease. Gastro-enterology. 2011; 140: 1817–1826.e2. doi:10.1053/j.gastro.2010.11.058PMID:21530748
4. Iskandar HN, Ciorba M. Biomarkers in inflammatory bowel disease: current practices and recent advances. Transl Res. Mosby, Inc.; 2012; 159: 313–25. doi:10.1016/j.trsl.2012.01.001PMID:
22424434
5. Jostins L, Ripke S, Weersma RK, Duerr RH, McGovern DP, Hui KY, et al. Host-microbe interactions have shaped the genetic architecture of inflammatory bowel disease. Nature. Nature Publishing Group; 2012; 491: 119–24. doi:10.1038/nature11582PMID:23128233
7. Jakobsdottir J, Gorin MB, Conley YP, Ferrell RE, Weeks DE. Interpretation of genetic association stud-ies: markers with replicated highly significant odds ratios may be poor classifiers. PLoS Genet. 2009; 5: e1000337. doi:10.1371/journal.pgen.1000337PMID:19197355
8. Clark PM, Dawany N, Dampier W, Byers SW, Pestell RG, Tozeren A. Bioinformatics analysis reveals transcriptome and microRNA signatures and drug repositioning targets for IBD and other autoimmune diseases. Inflamm Bowel Dis. 2012; 18: 2315–33. doi:10.1002/ibd.22958PMID:22488912
9. Gologan S, Iacob R, Iancu D, Iacob S, Cotruta B, Vadan R, et al. Inflammatory gene expression profiles in Crohn’s disease and ulcerative colitis: a comparative analysis using a reverse transcriptase multiplex ligation-dependent probe amplification protocol. J Crohns Colitis. European Crohn’s and Colitis Organi-sation; 2013; 7: 622–30. doi:10.1016/j.crohns.2012.08.015PMID:23014361
10. van Lierop PPE, Swagemakers SM, de Bie CI, Middendorp S, van Baarlen P, Samsom JN, et al. Gene expression analysis of peripheral cells for subclassification of pediatric inflammatory bowel disease in remission. PLoS One. 2013; 8: e79549. doi:10.1371/journal.pone.0079549PMID:24260248
11. Montero-Meléndez T, Llor X, García-Planella E, Perretti M, Suárez A. Identification of novel predictor classifiers for inflammatory bowel disease by gene expression profiling. PLoS One. 2013; 8: e76235. doi:10.1371/journal.pone.0076235PMID:24155895
12. Granlund AVB, Flatberg A,Østvik AE, Drozdov I, Gustafsson BI, Kidd M, et al. Whole genome gene expression meta-analysis of inflammatory bowel disease colon mucosa demonstrates lack of major dif-ferences between Crohn’s disease and ulcerative colitis. PLoS One. 2013; 8: e56818. doi:10.1371/ journal.pone.0056818PMID:23468882
13. Brest P, Lapaquette P, Souidi M, Lebrigand K, Cesaro A, Vouret-Craviari V, et al. A synonymous vari-ant in IRGM alters a binding site for miR-196 and causes deregulation of IRGM-dependent xenophagy in Crohn’s disease. Nat Genet. Nature Publishing Group; 2011; 43: 242–5. doi:10.1038/ng.762PMID:
21278745
14. Chen W-X, Ren L-H, Shi R-H. Implication of miRNAs for inflammatory bowel disease treatment: Sys-tematic review. World J Gastrointest Pathophysiol. 2014; 5: 63–70. doi:10.4291/wjgp.v5.i2.63PMID:
24891977
15. Iborra M, Bernuzzi F, Correale C, Vetrano S, Fiorino G, Beltrán B, et al. Identification of serum and tis-sue micro-RNA expression profiles in different stages of inflammatory bowel disease. Clin Exp Immu-nol. 2013; 173: 250–8. doi:10.1111/cei.12104PMID:23607522
16. Wu F, Guo NJ, Tian H, Marohn M, Gearhart S, Bayless TM, et al. Peripheral blood microRNAs distin-guish active ulcerative colitis and Crohn’s disease. Inflamm Bowel Dis. 2011; 17: 241–50. doi:10.1002/ ibd.21450PMID:20812331
17. Wu F, Zhang S, Dassopoulos T, Harris ML, Bayless TM, Meltzer SJ, et al. Identification of microRNAs associated with ileal and colonic Crohn’s disease. Inflamm Bowel Dis. 2010; 16: 1729–38. doi:10. 1002/ibd.21267PMID:20848482
18. Zahm AM, Thayu M, Hand NJ, Horner A, Leonard MB, Friedman JR. Circulating MicroRNA Is a Bio-marker of Pediatric Crohn Disease. J Pediatr Gastroenterol Nutr. 2011; 53: 26–33. doi:10.1097/MPG. 0b013e31822200ccPMID:21546856
19. Fasseu M, Tréton X, Guichard C, Pedruzzi E, Cazals-Hatem D, Richard C, et al. Identification of restricted subsets of mature microRNA abnormally expressed in inactive colonic mucosa of patients with inflammatory bowel disease. PLoS One. 2010; 5. doi:10.1371/journal.pone.0013160
20. Zahm AM, Hand NJ, Tsoucas DM, Le Guen CL, Baldassano RN, Friedman JR. Rectal microRNAs are perturbed in pediatric inflammatory bowel disease of the colon. J Crohns Colitis. European Crohn’s and Colitis Organisation; 2014; doi:10.1016/j.crohns.2014.02.012
21. Wu F, Zikusoka M, Trindade A, Dassopoulos T, Harris ML, Bayless TM, et al. MicroRNAs are differen-tially expressed in ulcerative colitis and alter expression of macrophage inflammatory peptide-2 alpha. Gastroenterology. 2008; 135: 1624–1635.e24. doi:10.1053/j.gastro.2008.07.068PMID:18835392
22. Paraskevi A, Theodoropoulos G, Papaconstantinou I, Mantzaris G, Nikiteas N, Gazouli M. Circulating MicroRNA in inflammatory bowel disease. J Crohns Colitis. European Crohn’s and Colitis Organisation; 2012; 6: 900–4. doi:10.1016/j.crohns.2012.02.006PMID:22386737
23. Ghorpade DS, Sinha AY, Holla S, Singh V, Balaji KN. NOD2-nitric oxide-responsive microRNA-146a activates sonic hedgehog signaling to orchestrate inflammatory responses in murine model of inflam-matory bowel disease. J Biol Chem. 2013; doi:10.1074/jbc.M113.492496
24. Kanaan Z, Rai SN, Eichenberger MR, Barnes C, Dworkin AM, Weller C, et al. Differential microRNA expression tracks neoplastic progression in inflammatory bowel disease-associated colorectal cancer. Hum Mutat. 2012; 33: 551–60. doi:10.1002/humu.22021PMID:22241525
26. Koukos G, Polytarchou C, Kaplan JL, Morley-Fletcher A, Gras-Miralles B, Kokkotou E, et al. MicroRNA-124 regulates STAT3 expression and is down-regulated in colon tissues of pediatric patients with ulcer-ative colitis. Gastroenterology. Elsevier, Inc; 2013; 145: 842–52.e2. doi:10.1053/j.gastro.2013.07.001
PMID:23856509
27. Chuang AY, Chuang JC, Zhai Z, Wu F, Kwon JH. NOD2 expression is regulated by microRNAs in colonic epithelial HCT116 cells. Inflamm Bowel Dis. 2014; 20: 126–35. doi:10.1097/01.MIB. 0000436954.70596.9bPMID:24297055
28. Chen Y, Wang C, Liu Y, Tang L, Zheng M, Xu C, et al. miR-122 targets NOD2 to decrease intestinal epi-thelial cell injury in Crohn’s disease. Biochem Biophys Res Commun. Elsevier Inc.; 2013; 438: 133–9. doi:10.1016/j.bbrc.2013.07.040PMID:23872065
29. Feng X, Wang H, Ye S, Guan J, Tan W, Cheng S, et al. Up-regulation of microRNA-126 may contribute to pathogenesis of ulcerative colitis via regulating NF-kappaB inhibitor IκBα. PLoS One. 2012; 7: e52782. doi:10.1371/journal.pone.0052782PMID:23285182
30. Thu Nguyen HT, Dalmasso G, Müller S, Carrière J, Seibold F, Darfeuille-Michaud A. Crohn’s Disease-associated Adherent Invasive Escherichia coli Affect Levels of microRNAs in Intestinal Epithelial Cells to Reduce Autophagy. Gastroenterology. Elsevier Ltd; 2013; doi:10.1053/j.gastro.2013.10.021
31. Zhai Z, Wu F, Chuang AY, Kwon JH. miR-106b Fine Tunes ATG16L1 Expression and Autophagic Activity in Intestinal Epithelial HCT116 Cells. 2013; 19: 17–19. doi:10.1097/MIB.0b013e31829e71cf
32. Shi C, Liang Y, Yang J, Xia Y, Chen H, Han H, et al. MicroRNA-21 knockout improve the survival rate in DSS induced fatal colitis through protecting against inflammation and tissue injury. PLoS One. 2013; 8: e66814. doi:10.1371/journal.pone.0066814PMID:23826144
33. Yang Y, Ma Y, Shi C, Chen H, Zhang H, Chen N, et al. Overexpression of miR-21 in patients with ulcer-ative colitis impairs intestinal epithelial barrier function through targeting the Rho GTPase RhoB. Bio-chem Biophys Res Commun. Elsevier Inc.; 2013; 434: 746–52. doi:10.1016/j.bbrc.2013.03.122PMID:
23583411
34. Olaru AV, Selaru FM, Mori Y, Vazquez C, David S, Paun B, et al. Dynamic changes in the expression of MicroRNA-31 during inflammatory bowel disease-associated neoplastic transformation. Inflamm Bowel Dis. 2011; 17: 221–31. doi:10.1002/ibd.21359PMID:20848542
35. Olaru AV, Yamanaka S, Vazquez C, Mori Y, Cheng Y, Abraham JM, et al. MicroRNA-224 negatively regulates p21 expression during late neoplastic progression in inflammatory bowel disease. Inflamm Bowel Dis. 2013; 19: 471–80. doi:10.1097/MIB.0b013e31827e78ebPMID:23399735
36. Ludwig K, Fassan M, Mescoli C, Pizzi M, Balistreri M, Albertoni L, et al. PDCD4/miR-21 dysregulation in inflammatory bowel disease-associated carcinogenesis. Virchows Arch. 2013; 462: 57–63. doi:10. 1007/s00428-012-1345-5PMID:23224068
37. Cortes C, Vapnik V. Support-Vector Networks. Mach Learn. 1995; 20: 273–297. 38. Breiman L. Random Forests. Mach Learn. 2001; 45: 5–32.
39. Keller A, Leidinger P, Bauer A, ElSharawy A, Haas J, Backes C, et al. Toward the blood-borne miR-Nome of human diseases. Nat Methods. Nature Publishing Group, a division of Macmillan Publishers Limited. All Rights Reserved.; 2011; 8: 841–843. doi:10.1038/nmeth.1682PMID:21892151
40. Keller A, Leidinger P, Steinmeyer F, Stähler C, Franke A, Hemmrich-Stanisak G, et al. Comprehensive analysis of microRNA profiles in multiple sclerosis including next-generation sequencing. Mult Scler. 2014; 20: 295–303. doi:10.1177/1352458513496343PMID:23836875
41. Keller A, Leidinger P, Lange J, Borries A, Schroers H, Scheffler M, et al. Multiple sclerosis: microRNA expression profiles accurately differentiate patients with relapsing-remitting disease from healthy con-trols. PLoS One. 2009; 4: e7440. doi:10.1371/journal.pone.0007440PMID:19823682
42. Keller A, Backes C, Leidinger P, Kefer N, Boisguerin V, Barbacioru C, et al. Next-generation sequenc-ing identifies novel microRNAs in peripheral blood of lung cancer patients. Mol Biosyst. 2011; 7: 3187–
99. doi:10.1039/c1mb05353aPMID:22027949
43. Abu-Halima M, Hammadeh M, Backes C, Fischer U, Leidinger P, Lubbad AM, et al. A panel of five microRNAs as potential biomarkers for the diagnosis and assessment of male infertility. Fertil Steril. 2014; doi:10.1016/j.fertnstert.2014.07.001
44. Lajer CB, Nielsen FC, Friis-Hansen L, Norrild B, Borup R, Garnæs E, et al. Different miRNA signatures of oral and pharyngeal squamous cell carcinomas: a prospective translational study. Br J Cancer. 2011; 104: 830–40. doi:10.1038/bjc.2011.29PMID:21326242
46. Patnaik SK, Yendamuri S, Kannisto E, Kucharczuk JC, Singhal S, Vachani A. MicroRNA expression profiles of whole blood in lung adenocarcinoma. PLoS One. 2012; 7: e46045. doi:10.1371/journal. pone.0046045PMID:23029380
47. Miotto P, Mwangoka G, Valente IC, Norbis L, Sotgiu G, Bosu R, et al. miRNA signatures in Sera of patients with active pulmonary tuberculosis. PLoS One. 2013; 8: e80149. doi:10.1371/journal.pone. 0080149PMID:24278252
48. Duttagupta R, DiRienzo S, Jiang R, Bowers J, Gollub J, Kao J, et al. Genome-wide maps of circulating miRNA biomarkers for ulcerative colitis. PLoS One. 2012; 7: e31241. doi:10.1371/journal.pone. 0031241PMID:22359580
49. Hastie T, Tibshirani R, Friedman J. The Elements of Statistical Learning: Data Mining, Inference, and Prediction (Springer Series in Statistics). 2nd ed. 2009.
50. Güimil R, Beier M, Scheffler M, Rebscher H, Funk J, Wixmerten A, et al. Geniom technology—the benchtop array facility. Nucleosides Nucleotides Nucleic Acids. 22: 1721–3. doi: 10.1081/NCN-120023122PMID:14565504
51. Vorwerk S, Ganter K, Cheng Y, Hoheisel J, Stähler PF, Beier M. Microfluidic-based enzymatic on-chip labeling of miRNAs. N Biotechnol. 25: 142–9. doi:10.1016/j.nbt.2008.08.005PMID:18786664
52. Huber W, von Heydebreck A, Sueltmann H, Poustka A, Vingron M. Parameter estimation for the cali-bration and variance stabilization of microarray data. Stat Appl Genet Mol Biol. 2003; 2. doi:10.2202/ 1544-6115.1008
53. Bradley PS, Mangasarian OL. Feature Selection via Concave Minimization and Support Vector Machines. Proceedings of the Fifteenth International Conference on Machine Learning ICML‘98. San Francisco, CA, USA: Morgan Kaufmann Publishers Inc.; 1998. pp. 82–90.
54. Zou H, Hastie T. Regularization and variable selection via the elastic net. J R Stat Soc Ser B (Statistical Methodol. 2005; 67: 301–320.
55. Zhang HH, Ahn J, Lin X, Park C. Gene selection using support vector machines with non-convex pen-alty. Bioinformatics. 2006; 22: 88–95. doi:10.1093/bioinformatics/bti736PMID:16249260
56. Becker N, Toedt G, Lichter P, Benner A. Elastic SCAD as a novel penalization method for SVM classifi-cation tasks in high-dimensional data. BMC Bioinformatics. BioMed Central Ltd; 2011; 12: 138. doi:10. 1186/1471-2105-12-138PMID:21554689
57. Becker N, Werft W, Toedt G, Lichter P, Benner A. penalizedSVM: a R-package for feature selection SVM classification. Bioinformatics. 2009; 25: 1711–1712. doi:10.1093/bioinformatics/btp286PMID:
19398451
58. Friedman JH. Another approach to polychotomous classification. 1996.
59. Szymczak S, Holzinger E, Dasgupta A, Malley J, Molloy A, Mills J, et al. r2VIM: A new variable selection method for random forests in genome-wide association studies. submitted.
60. Strobl C, Malley J, Tutz G. An introduction to recursive partitioning: rationale, application, and charac-teristics of classification and regression trees, bagging, and random forests. Psychol Methods. 2009; 14: 323–48. doi:10.1037/a0016973PMID:19968396
61. Sing T, Sander O, Beerenwinkel N, Lengauer T. ROCR: visualizing classifier performance in R. Bioin-formatics. 2005; 21: 3940–1. doi:10.1093/bioinformatics/bti623PMID:16096348
62. Hsu S-D, Tseng Y-T, Shrestha S, Lin Y-L, Khaleel A, Chou C-H, et al. miRTarBase update 2014: an information resource for experimentally validated miRNA-target interactions. Nucleic Acids Res. 2014; 42: D78–85. doi:10.1093/nar/gkt1266PMID:24304892
63. Franke A, McGovern DPB, Barrett JC, Wang K, Radford-Smith GL, Ahmad T, et al. Genome-wide meta-analysis increases to 71 the number of confirmed Crohn’s disease susceptibility loci. Nat Genet. 2010/11/26 ed. 2010; 42: 1118–1125. doi:10.1038/ng.717PMID:21102463
64. Blunt MD, Ward SG. Targeting PI3K isoforms and SHIP in the immune system: new therapeutics for inflammation and leukemia. Curr Opin Pharmacol. 2012; 12: 444–51. doi:10.1016/j.coph.2012.02.015
PMID:22483603
65. Chen Y, Xiao Y, Ge W, Zhou K, Wen J, Yan W, et al. miR-200b inhibits TGF-β1-induced epithelial-mes-enchymal transition and promotes growth of intestinal epithelial cells. Cell Death Dis. 2013; 4: e541. doi:10.1038/cddis.2013.22PMID:23492772
66. Ying L, Marino J, Hussain SP, Khan MA, You S, Hofseth AB, et al. Chronic inflammation promotes reti-noblastoma protein hyperphosphorylation and E2F1 activation. Cancer Res. 2005; 65: 9132–6. doi:10. 1158/0008-5472.CAN-05-1358PMID:16230367
68. Khor TO, Huang M-T, Kwon KH, Chan JY, Reddy BS, Kong A-N. Nrf2-deficient mice have an increased susceptibility to dextran sulfate sodium-induced colitis. Cancer Res. 2006; 66: 11580–4. doi:10.1158/ 0008-5472.CAN-06-3562PMID:17178849
69. Bian Z, Li L, Cui J, Zhang H, Liu Y, Zhang C-Y, et al. Role of miR-150-targeting c-Myb in colonic epithe-lial disruption during dextran sulphate sodium-induced murine experimental colitis and human ulcera-tive colitis. J Pathol. 2011; 225: 544–53. doi:10.1002/path.2907PMID:21590770
70. Balzola F, Bernstein C, Ho GT, Russell RK. Deep resequencing of GWAS loci identifies independent rare variants associated with inflammatory bowel disease: Commentary. 2011/10/11 ed. Inflammatory Bowel Disease Monitor. 2012. pp. 126–127.
71. Gerlach K, Hwang Y, Nikolaev A, Atreya R, Dornhoff H, Steiner S, et al. TH9 cells that express the tran-scription factor PU.1 drive T cell-mediated colitis via IL-9 receptor signaling in intestinal epithelial cells. Nat Immunol. 2014; 15: 676–86. doi:10.1038/ni.2920PMID:24908389
72. Marcil V, Sinnett D, Seidman E, Boudreau F, Gendron F-P, Beaulieu J-F, et al. Association between genetic variants in the HNF4A gene and childhood-onset Crohn’s disease. Genes Immun. Nature Pub-lishing Group; 2012; 13: 556–65. doi:10.1038/gene.2012.37PMID:22914433
73. Diegelmann J, Czamara D, Le Bras E, Zimmermann E, Olszak T, Bedynek A, et al. Intestinal DMBT1 expression is modulated by Crohn’s disease-associated IL23R variants and by a DMBT1 variant which influences binding of the transcription factors CREB1 and ATF-2. PLoS One. 2013; 8: e77773. doi:10. 1371/journal.pone.0077773PMID:24223725
74. Barrett JC, Lee JC, Lees CW, Prescott NJ, Anderson CA, Phillips A, et al. Genome-wide association study of ulcerative colitis identifies three new susceptibility loci, including the HNF4A region. Nat Genet. 2009; 41: 1330–4. doi:10.1038/ng.483PMID:19915572
75. Dahan S, Rabinowitz KM, Martin AP, Berin MC, Unkeless JC, Mayer L. Notch-1 signaling regulates intestinal epithelial barrier function, through interaction with CD4+ T cells, in mice and humans. Gastro-enterology. 2011; 140: 550–9. doi:10.1053/j.gastro.2010.10.057PMID:21056041
76. Sipos F, Galamb O, Herszényi L, Molnár B, Solymosi N, Zágoni T, et al. Elevated insulin-like growth factor 1 receptor, hepatocyte growth factor receptor and telomerase protein expression in mild ulcera-tive colitis. Scand J Gastroenterol. 2008; 43: 289–98. Available:http://www.ncbi.nlm.nih.gov/pubmed/ 18938767PMID:18938767
77. Andoh A, Saotome T, Sato H, Tsujikawa T, Araki Y, Fujiyama Y, et al. Epithelial expression of caveolin-2, but not caveolin-1, is enhanced in the inflamed mucosa of patients with ulcerative colitis. Inflamm Bowel Dis. 2001; 7: 210–4. Available:http://www.ncbi.nlm.nih.gov/pubmed/11515846PMID:
11515846
78. Bouzid D, Fourati H, Amouri A, Marques I, Abida O, Haddouk S, et al. Association of the RAVER2 gene with increased susceptibility for ulcerative colitis. Hum Immunol. 2012; 73: 732–5. doi:10.1016/j. humimm.2012.04.018PMID:22561236
79. Bhonde MR, Gupte RD, Dadarkar SD, Jadhav MG, Tannu AA, Bhatt P, et al. A novel mTOR inhibitor is efficacious in a murine model of colitis. Am J Physiol Gastrointest Liver Physiol. 2008; 295: G1237–45. doi:10.1152/ajpgi.90537.2008PMID:18927209
80. Sobajima J, Ozaki S, Osakada F, Uesugi H, Shirakawa H, Yoshida M, et al. Novel autoantigens of peri-nuclear anti-neutrophil cytoplasmic antibodies (P-ANCA) in ulcerative colitis: non-histone chromosomal proteins, HMG1 and HMG2. Clin Exp Immunol. 1997; 107: 135–40. Available:http://www.
pubmedcentral.nih.gov/articlerender.fcgi?artid=1904558&tool=pmcentrez&rendertype=abstractPMID:
9010268
81. Schulmann K, Mori Y, Croog V, Yin J, Olaru A, Sterian A, et al. Molecular phenotype of inflammatory bowel disease-associated neoplasms with microsatellite instability. Gastroenterology. 2005; 129: 74–
85. Available:http://www.ncbi.nlm.nih.gov/pubmed/16012936PMID:16012936
82. Deng H, Runger G. Gene selection with guided regularized random forest. 2012; Available:http://arxiv. org/abs/1209.6425