www.adv-geosci.net/16/19/2008/
© Author(s) 2008. This work is distributed under the Creative Commons Attribution 3.0 License.
Advances in
Geosciences
Quantifying uncertainties in precipitation: a case study from Greece
C. Anagnostopoulou1, K. Tolika1, P. Maheras1, H. Reiser2, and H. Kutiel2
1Department of Meteorology and Climatology, School of Geology, Aristotle University of Thessaloniki, 54124 Greece 1Laboratory of Climatology, Department of Geography and Environmental Studies, University of Haifa, Haifa 31905, Israel Received: 23 August 2007 – Revised: 14 December 2007 – Accepted: 8 February 2008 – Published: 9 April 2008
Abstract. The main objective of the present study was the examination and the quantification of the uncertainties in the precipitation time series over the Greek area, for a 42-year time period. The uncertainty index applied to the rainfall data is a combination (total) of the departures of the rain-fall season length, of the median data of the accumulated percentages and of the total amounts of rainfall. Results of the study indicated that all the stations are characterized, on an average basis, by medium to high uncertainty. The sta-tions that presented an increasing rainfall uncertainty were the ones located mainly to the continental parts of the study region. From the temporal analysis of the uncertainty index, it was demonstrated that the greatest percentage of the years, for all the stations time-series, was characterized by low to high uncertainty (intermediate categories of the index). Most of the results of the uncertainty index for the Greek region are similar to the corresponding results of various stations all over the European region.
1 Introduction
The quantification the assessment and the understanding of the uncertainties in several climatological parameters are of major interest in recent climate studies. Especially, in the case of precipitation, the identification of the uncertainties associated with the rainfall time series is considered to be crucial, as it influences many aspects of the human activity, such as agriculture, tourism and water management. Maskey et al. (2004) mentioned that for the rainfall – runoff models and for the flood forecasting, the precipitation uncertainty represents the major part of the input uncertainty. Therefore, the output of these models could be improved if the
uncer-Correspondence to:
C. Anagnostopoulou ([email protected])
tainties of precipitation are estimated. The quantification in time and space of these uncertainties would also contribute to the improvement of the reanalysis models (Smith et al., 2001).
Paz and Kutiel (2003) demonstrated that the “climatic un-certainty” is the inability to accurately forecast the magni-tude of a certain climatic variable at a specific location and time. They divided the uncertainties into three categories: temporal, spatial and magnitudinal uncertainties, a division that was also used by Maskey et al. (2004). Also, Thorne et al. (2005) identified two different sources of uncertainties, the structural and parametric uncertainty. The first one arises through the choice of approach, while the latter one gives the chosen approach in the presence of a finite sample of data.
This study is motivated by an interest in examining and estimating the spatial and temporal uncertainty of precipita-tion over the Greek region. The precipitaprecipita-tion regime in the study area is generally characterized by a long dry summer, especially in the islands of the central Aegean Sea and the wet period (during winter) is considered quite clearly dis-tinct. However, the great influence of local factors often re-sults in several cases to an irregular behavior of precipitation, thus numerous studies have analyzed the characteristics of the rainfall regime in Greece (Theoharatos and Tselepidaki, 1990; Maheras et al., 1992; Fotiadi et al., 1999; Bartzokas et al., 2003; Anagnostopoulou et al., 2003; Tolika and Maheras, 2005). Considering that the examination of the uncertainties associated with precipitation is limited, this study aims in this direction.
2 Methodology – data
2.1 Data
se-Agrinio
Alexandroupoli
Argostoli
Athens
Chania Heraklio
Ierapetra Ioannina
Kalamata Kerkyra
Kozani
Kythira Larissa
Milos
Mytilini
Naxos
Rodos Samos Skyros
Tripoli Thessaloniki
19 20 21 22 23 24 25 26 27 28 29
a) The stations under study
34 35 36 37 38 39 40 41 42
Elliniko
19 20 21 22 23 24 25 26 27 28 29
b) Regions in the Greek Area
34 35 36 37 38 39 40 41 42
Peloponnisos
Crete Aegean Sea
Cyclades Macedonia
Thessaly
Attica
Fig. 1. The geographical distribution of the stations(a)and the geographical location of the Greek regions(b)used in the study.
ries used were checked for homogeneity with Alexandersson test (1986) in order to ensure the validity of the conclusions. In the Mediterranean region, the highest amount of precip-itation is observed during the winter period, while the sum-mer rainfall is insignificant or zero. The years used in this study are hydrological years, which differ from the calen-dar year. We define the 1 September as the beginning of the hydrological year and 31 August as the end. Each year is named after the date of the September that it contains, for example the 1980 year starts at 1 September 1980 and fin-ished at 31 August 1981.
2.2 Methodology for evaluating uncertainty
Rainfall regime is affected by both the number and the length of rainspells and dryspells and the total annual rainfall. For the Greek region, a rainspell (dryspell) is defined as the num-ber of consecutive rainy (dry) days with precipitation higher (equal or lower) than 0.1 mm (Anagnostopoulou et al., 2003; Tolika and Maheras, 2005). This threshold was selected be-cause during spring and summer even this small amount of rain can be considered as an important factor for the growth of crops; in addition, the increase of the humidity of the air can favor the outbreak of crop diseases (Steineke and Jehle, 2004; Champeil et al., 2004). Changes in any of these param-eters could introduce uncertainties to an accurately forecast of the precipitation. Paz and Kutiel (2003) introduce the fol-lowing parameters in order to evaluate the uncertainty of the rainfall regime:
1. NRS(d) (Number of rainspells) is the number of rain-spells for a given duration in days (d).
2. RSY(d)(Rainspell Yield) is the average rainfall (in mm) accumulated during all rainspells of the duration of the Rainy Seasonal Length (RSL, in days). The RSL is de-fined as:
RSL=DAP(90)−DAP(10) (1)
where DAP(i)is the median date of an accumulated per-centage (i=10, 20, . . . ,90) of the annual rainfall (in days since 1 September)
3. TOTAL(d)is the total rainfall (in mm) given as follows:
TOTAL(d) =NRS(d)∗RSY(d) (2)
Furthermore, Paz and Kutiel (2003) defined the Uncer-tainty Index (UI) as:
U I =1RSL+1DAP+1TOTAL (3)
It is composed of a series of standardized components that measure the uncertainty:
1RSL=
RSL−MedRSL σ (RSL)
(4) where MedRSLis the median value of RSL andσ(RSL) is its standardized deviation
1DAP=
90
P
i=10
DAPi−MedDAPi
σ DAPi
where MedDAP(i)is the median value of DAP(i) and z is the number of the accumulated percentage (i=10, 20, . . . , 90), in our study is 9.
1TOTAL=
z
P
i=1
TOTAL(d)−TOTAL(d)
σTOTAL(d)
z (6)
wherezis the number of the different TOTALs, in our study is 7.
All the components of the UI were calculated using the Rainfall Uncertainty Model (RUM) developed at the Labo-ratory of Climatology, University of Haifa, by the last two authors. Due to space limitations the full description of this model and all its components is not possible to be described in this section. A detailed description of these can be found at the website: http://geo.haifa.ac.il/∼kutiel/RUEM%204.pdf.
The trend of the Rainy Seasonal Length (RSL) and the UI were calculated by a simple least squares fit, where the regression coefficient b gives the changes per year. Trend significance was tested using the Kendall –tau test at the 95% confidence level (5% significant level).
3 Results
3.1 Rainy Season Length (RSL)
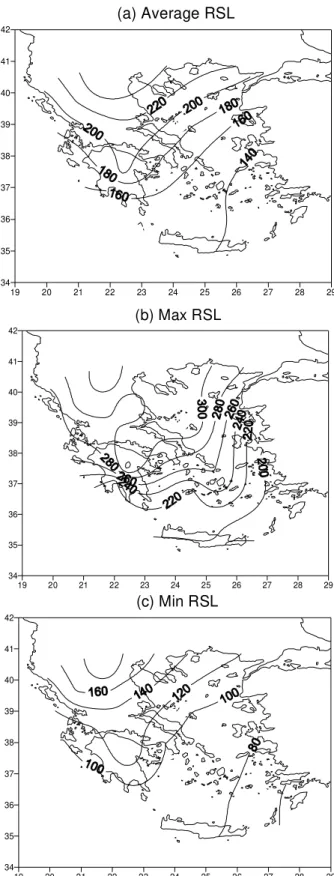
The Rainy Season Length (RSL) is defined as the elapsed time between two accumulated percentages of the annual rainfall (in days since 1. September). It is dependent on loca-tion and topography, as well as the regional circulaloca-tion over the study area. RSL could be regarded as a good indicator for plants growing and the surplus of water in the region. In the present study, the rainy season length between the 10%DAP and 90%DAP (90–10 RSL), 10%DAP and 50%DAP (50–10 RSL) and 50%DAP and 90%DAP (90–50 RSL) were ana-lyzed.
The mean Rainy Season Length (90–10 RSL), for the Greek region varies from 130 to 260 days, an increase that moves gradually from southeast to northwest (Fig. 2a). The maximum and minimum Rainy Seasonal Length performs in similar modes; the northern continental regions present the higher RSL for both cases (Fig. 2b, c). This means that over north-northwestern Greece, the duration of the rainfall period is longer (about nine months) during the hydrological year, while the rainfall over southern Greece limits in shorter time periods (more than 4 months).
In order to provide a more detailed analysis, the sub-periods, 50–10 RSL and the 90–50 RSL were evaluated and analyzed. These two sub-periods were selected as they rep-resent the two halves of the whole rainy period. Apart from these calculations, the trends of all the RSLs were also cal-culated. The length of the RSLs varies with time, depending also on the region. Generally, the length of the 50–10 RSL is shorter than the 90–50 RSL one, meaning that the first half
34 35 36 37 38 39 40 41 42
19 20 21 22 23 24 25 26 27 28 29
(a) Average RSL
19 20 21 22 23 24 25 26 27 28 29
34 35 36
(b) Max RSL
37 38 39 40 41 42
19 20 21 22 23 24 25 26 27 28 29
(c) Min RSL
34 35 36 37 38 39 40 41 42
19 20 21 22 23 24 25 26 27 28 29
(a) Trend 10% RSL
34 35 36 37 38 39 40 41 42
19 20 21 22 23 24 25 26 27 28 29
(b) Trend 50% RSL
34 35 36 37 38 39 40 41 42
19 20 21 22 23 24 25 26 27 28 29
(c) Trend 90% RSL
34 35 36 37 38 39 40 41 42
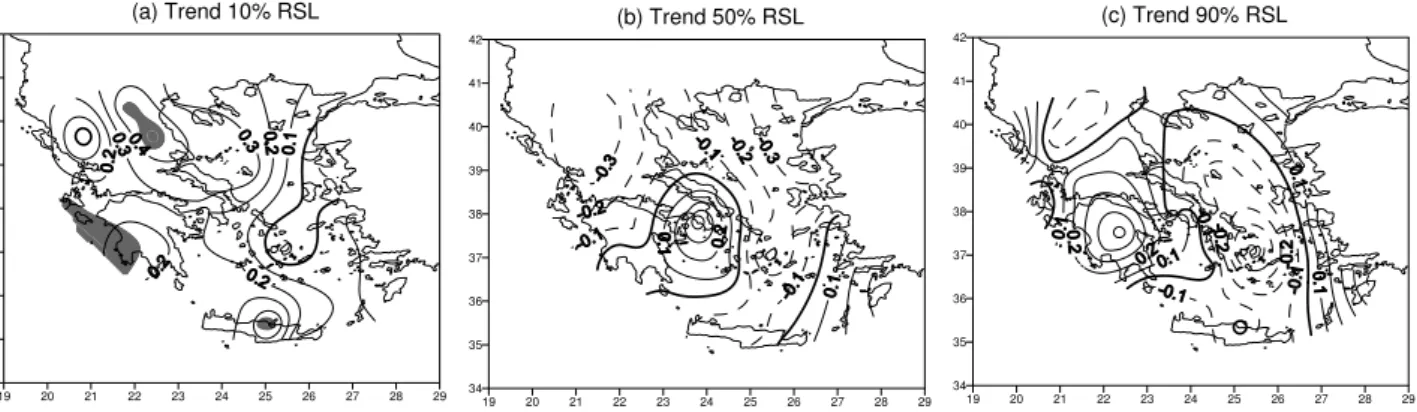
Fig. 3.The spatial distribution of the trends (day/year) of the 10%RSL(a), 50%RSL(b)and the 90%RSL(c). The grey regions indicate the statistical significant trends.
of the total rainfall is recorded in about two months duration, while the last half of the total rainfall spreads over a much longer time period (not shown). Mainly, for the continen-tal stations the 50–10 RSL is the longest one, holding about twice the time of the other stations. On the contrary, some of the island stations present the shortest length of 90-10 RSL that is divided almost into two equal parts, 50–10 RSL and 90–50 RSL (not shown).
The trends in the three selected rainfall percentiles (10%, 50% and 90%) are shown in Fig. 3. Concerning the 10% percentile, an increase is indicated in the majority of the stations (19 stations). Up to 4 days per decade is the ob-served increasing trend of the 10% percentile in central con-tinental Greece and in Crete. On the other hand, a smaller decreasing trend (1 day per decade) is found in the east-ern Aegean Sea (Fig. 3a).This means that the rainy season tends to start later during the hydrological year. However, it should be mentioned that this increasing trend is statistically significant only for five stations, three continental (Kozani, Larissa and Kalamata) and two island (Heraklio and Argos-toli). For the 50% percentile, a decreasing trend is evident in the three quarters of the stations, but none of them pre-sented significant decreasing results. Fifty per cent of rain-fall of the rainrain-fall tends to appear earlier in the hydrological year (decreasing trend of 3–4 days per decade) in the north-eastern and northwestern parts of the country. Conversely, in central Greece (Athens) and in the southeastern Aegean Sea the trend found is positive (up to 3 days per decade, see Fig. 3b).The 90% percentile also indicates an increas-ing trend, as the correspondincreas-ing 10% percentile, in more than half of the stations under study. For these stations the rainy period seems to present a tendency to end later during the hy-drological year, mainly in Peloponissos as well as in central continental Greece and in the station in the eastern Aegean Sea. All the other island stations of the Aegean and the sta-tions in Crete show a decreasing trend of this percentile. Es-pecially in the Cyclades, this negative trend reaches the value of 5 days per decade decrease (Fig. 3c). Generally, the 90–
10 RSL tends to last longer in 8 stations (island and coastal ones), while in the other 14 stations, the rainy period presents a negative trend and thus the RSL is shorter. However, at this point it should be noted that none of the RSL trends were found statistically significant (not shown).
3.2 Uncertainty Index (UI)
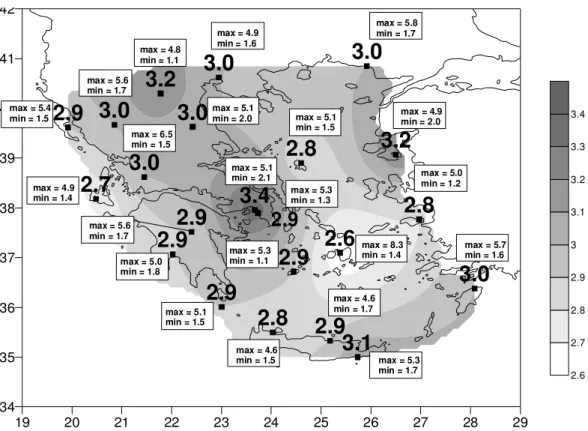
In the last section of the present study, an assessment is made to analyze the behavior of the uncertainty index (UI) in each of the selected stations. The spatial distribution of the mean standardized scores of the UI is presented in Fig. 4. The score values vary from 2.6 at the station of Naxos to 3.4 at the station of Athens. It can also be noted that mainly continental stations present the highest values of the index and especially in the central and northern continental Greece. However, one island station at the eastern Aegean Sea (Mytilini; 3.2) and one station on the island of Crete (Ierapetra; 3.1) present also quite high index score values. Since the selected index is a sum of three parameters (departures), it is also interesting to examine which of these three departures contributes the most to the high values of the UI. Analyzing the stations which presented a UI greater than 3.0, it is found that in most of the cases, the absolute departures of the total amount of rainfall (1TOTAL) play the most predominant role for the increase of the UI scores (not shown). Also, stations with high values of1RSL had quite high index scores, as well. However, in the case of Athens (highest index score), the high1TOTAL and1DAP are the departures that result to the increase of the uncertainty.
19 20 21 22 23 24 25 26 27 28 29 34
35 36 37 38 39 40 41 42
3.0
3.0
2.7
3.4
2.8
2.9
3.1
3.0
2.9
2.9
3.2
2.9
3.0
2.9
3.2
2.6
3.0
2.8
2.8
3.0
2.9
2.6 2.7 2.8 2.9 3 3.1 3.2 3.3 3.4
2.9
max = 6.5 min = 1.5
max = 5.8 min = 1.7
max = 4.9 min = 1.4
max = 5.1 min = 2.1
max = 4.6 min = 1.5
max = 5.3 min = 1.3
max = 4.6 min = 1.7
max = 5.3 min = 1.7 max = 5.6
min = 1.7
max = 5.0 min = 1.8 max = 5.4
min = 1.5
max = 4.8 min = 1.1
max = 5.1 min = 1.5
max = 5.1 min = 2.0
max = 5.3 min = 1.1
max = 4.9 min = 2.0
max = 8.3 min = 1.4
max = 5.7 min = 1.6 max = 5.0 min = 1.2 max = 5.1
min = 1.5
max = 5.6 min = 1.7
max = 4.9 min = 1.6
Fig. 4. The mean standardized scores both in the grey scale and over the location of each station. The numbers in the box indicate the maximum and minimum values (scores) of the index for each station.
highest ones in Athens (2.1). No general conclusion can be drawn for the years that these values appear, but in more than half of the stations both the maximum and the minimum in-dex scores are found on the second half of the study period, suggesting that the variability of the index is greater after the year of 1978. According to Anagnostopoulou (2003) and Norrant (2004), after this year there is an important change in the atmospheric circulation over the Mediterranean and especially over Greece.
Taking all the aforementioned results under consideration and aiming at providing a more detailed analysis of the un-certainty index, their values were divided into five classes (categories):
1. UI<2.0 very low uncertainty 2. 2.0≤UI<2.5 low uncertainty 3. 2.5≤UI<3.0 medium uncertainty 4. 3.0≤UI<4.0 high uncertainty 5. UI≥4.0 very high uncertainty
Using this categorization, the number of cases (in years) for each class was computed for all stations and the results are summarized in Table 1a. It is obvious that the three
medium classes are the ones with the highest frequencies: they almost double from the first and the last category. From a more thorough examination of the results, it is inferred that the station of Argostoli presents the maximum frequency in the first class; 11 years out of the 42 are characterized by very low uncertainty. The second highest frequency of this class is found for the station of Naxos with 10 years where the index scores are below 2.0. Conversely, the stations of Athens and Mytilini present high frequencies for the last class of very high uncertainty: 11 and 10 years respectively, are character-ized by index scores higher than 4.0.
Table 1. (a)Number of cases (years) for the different classes of the Uncertainty Index (UI) for the stations over the Greek area.
The UI classes
UI<2.0 2.0≤UI<2.5 2.5≤UI<3.0 3.0≤UI<4.0 UI≥4.0
Agrinio 5 9 12 9 7
Alexandroupoli 3 9 12 13 5
Argostoli 11 9 9 8 5
Athens 0 4 8 19 11
Chania 7 10 9 12 4
Elliniko 4 14 8 10 6
Heraklio 6 11 9 10 6
Ierapetra 3 6 8 23 2
Ioannina 2 10 11 11 8
Kalamata 4 12 10 11 5
Kerkyra 5 14 8 9 6
Kozani 3 7 7 19 6
Kythira 5 11 10 11 5
Larissa 0 14 10 13 5
Milos 4 10 16 6 6
Mytilini 1 10 9 12 10
Naxos 10 12 13 3 4
Rodos 4 9 11 15 3
Samos 6 13 7 13 3
Skyros 8 12 6 10 6
Thessaloniki 6 10 5 15 6
Tripoli 6 11 10 11 4
Average 4.68 (11.1%) 10.32 (24.6%) 9.45 (22.5%) 11.95 (28.5%) 5.59 (13.3%)
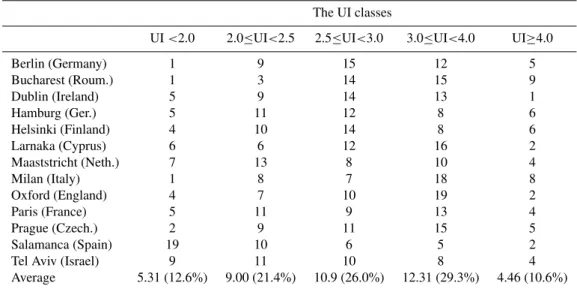
Table 1. (b) Number of cases (years) for the different classes of the Uncertainty Index (UI) for stations over the European region.
The UI classes
UI<2.0 2.0≤UI<2.5 2.5≤UI<3.0 3.0≤UI<4.0 UI≥4.0
Berlin (Germany) 1 9 15 12 5
Bucharest (Roum.) 1 3 14 15 9
Dublin (Ireland) 5 9 14 13 1
Hamburg (Ger.) 5 11 12 8 6
Helsinki (Finland) 4 10 14 8 6
Larnaka (Cyprus) 6 6 12 16 2
Maaststricht (Neth.) 7 13 8 10 4
Milan (Italy) 1 8 7 18 8
Oxford (England) 4 7 10 19 2
Paris (France) 5 11 9 13 4
Prague (Czech.) 2 9 11 15 5
Salamanca (Spain) 19 10 6 5 2
Tel Aviv (Israel) 9 11 10 8 4
Average 5.31 (12.6%) 9.00 (21.4%) 10.9 (26.0%) 12.31 (29.3%) 4.46 (10.6%)
Just two years are found with the index scores exceeding the value of 4.0 (Table 1b). This station presents also a quite low average UI score (2.3), a value that is lower than the corresponding average values of all the stations in the Greek region.
4 Conclusions and discussion
rainfall characteristics of several stations over the Greek area. The methodology developed was applied to daily precipita-tion time series from 22 staprecipita-tions distributed uniformly over the study region, but with different local characteristics. This gives the opportunity to investigate also if these local factors play an important role to the rainfall uncertainly or if the un-certainty is mainly caused by other larger-scale or regional factors.
From the analysis of the RSL, it is derived that the rainy length varies from 4 to 9 months, depending on the station. For the continental stations, the first 50% of the precipitation is observed for a longer time period, while for the insular stations the precipitation amounts are well divided into two rainy periods. It is worth mentioning also that the RSL is relocated during the study time period for the majority of the stations, meaning that the rainy season begins later and finishes also later during the hydrological year. It is also ob-served that the duration of the second 50% of rainfall has in-creased its duration. This could play an important role both in agriculture and hydrology, since the same amount of rain-fall rain-falls for a larger period which is essential for the devel-opment of the plants (less irrigation needed). As variations in the beginning and ending of the rainy season were detected, a further analysis is required.
The scores of the UI that were found during all the years of the study period range from 1.1 to 8.3 and were divided into five sub-categories (classes). For the majority of the stations the greatest percentage of the cases (years) were found in the intermediate categories (from low to high uncertainty). How-ever, from the average score values of the index, all the sta-tions are characterized by medium and high uncertainty. The greatest mean value (3.4) was found at the station of Athens, the city that was subjected to the most intense urban devel-opment during the study period. This could be an indication that the expansion of a city, the growth of the population and more intense thermal urban effect (Philandras et al., 1998; Makrogiannis et al., 1999) may play an important role in the increase of the rainfall uncertainty. At this point, it is worth mentioning that the Attica basin is one of the few regions where precipitation amounts and frequencies do not present a significant decrease in the last 50 years, as in the rest of Greece (Maheras and Anagnostopoulou, 2003). It could be attributed to the great urbanization of this area.
Finally, it was important to examine if the index could be applied in different regions in order to quantify the uncer-tainty of rainfall and to make the results comparable. So, the same analysis was employed for a number of stations all over the European region. It was found that the number of the years and the percentage of each one of the five classes was more or less the same as the one in the Greek stations. This could be an indication that the classification of the uncer-tainty index is applicable in other regions also, with different climatic characteristics. In our opinion, the high uncertainty presented in some of the European stations may be attributed to the changes in the circulation conditions that influence the
rainfall regime of the stations.
Undoubtedly, the uncertainty index needs further investi-gation. The authors orientate for a future work, to apply the UI in different regions, with different climatic characteris-tics, aiming on the validation of the index. Also, the applica-tion of the index employing GCM and RCM data in order to estimate the uncertainty of simulated time series could con-tribute to a more thorough evaluation of the models.
Acknowledgements. This work was funded both by the Ministry of National Education and Religious Affairs (Greece) and EU under the frame of the “PYTHAGORAS” project (EPEAEK II) and by the European Commission under the frame of the project GABARDINE (Groundwater Artificial recharge Based on Alternative sources of wateR: aDvanced INtegated technologies and management) contract no 518118.
Edited by: S. C. Michaelides
Reviewed by: two anonymous referees
References
Alexandersson, H.: A homogeneity test applied to precipitation data. J. Climatol., 6, 661–675, 1986.
Anagnostopoulou, C.:Contribution to the study of drought in the Greek area, Phd Thesis, Aristotle University of Thessaloniki, Department of Meteorology and Climatology, pp.219 (in greek), 2003.
Anagnostopoulou, C., Maheras, P., Karacostas, T., and Vafiadis, M.: Spatial and temporal analysis of dry spells in Greece, Theor. Appl. Climatol., 74, 77–91, 2003.
Bartzokas, A., Lolis, C., and Metaxas, D. A.: A study on the intra-annual variation and the spatial distribution of precipitation amount and duration over Greece on a 10 day basis, Int. J. Cli-matol., 23, 207–222, 2003.
Champeil, A., Dor´e, T., and Fourbet, J. F.: Fusarium: Head blight: epidemiological origin of the effects of cultural practices on head blight attacks and the production of mycotoxins by Fusarium in wheat grains, Plant Sci., 166, 1389–1415, 2004.
Fotiadi, A. K., Metaxas, D. A., and Barzokas, A.: A statistical study of precipitaiton in NW Greece, Int. J. Climatol., 19, 1221–1232, 1999.
Maheras, P., Balafoutis, C., and Vafiadis, M.: Precipitation in the central Mediterranean during the last century, Theor. Appl. Cli-matol., 45, 209–216, 1992.
Maheras, P. and Anagnostopoulou, C.: Circulation Types and their Influence on the Interannual variability and precipitation changes in Greece Mediterranean Climate-Variability and Trends, edited by: H. J. Bolle, Springer Verlag, Berlin, Heidelberg, 215–239, 2003.
Makrogiannis, T., Santamouris, M., Papanikolaou, N., Koronaki, I., Tselepidaki, I., and Assimakopoulos, D.: The Athens ur-ban climate experiment-temperature distribution. Klimat I Biok-limat Miast, Acta Universitatis Lodziensis, Wydawhictwo Uniw-ersytetu Lodzkiego, Folia Geographica Physica 3, Lodz, 33–50, 1999.
Norrant, C.: Tendances pluviometriques indictrices d’un chamge-ment climatique dans le basin Mediterraneee de 1950 `a 2000, Edude Diagnosique, These, Universite AIX-MARSEILLE I – Universit´e de Provence, Institut de G´eographie, pp.262, 2004. Paz, S. and Kutiel, H.: Rainfall regime uncertainty (RRU) in an
Eastern Mediterranean region – A methodological approach, Isr. J. Earth Sci., 52, 47–63, 2003.
Philandras, C., Metaxas, D., and Nastos, P.: Urban effect on air tem-perature in national observatory of Athens compared to climatic variability. Procedings of the 4th National Conference of Me-teorology, Climatology and Atmospheric Physics, Athens, 22– 25 September 1998, 199–204 (in Greek), 1998.
Smith, S., Legler, D. M., and Verzone, K. V.: Quantifying Uncer-tainties in NCEP Reanalyses using High-Quality Research Ves-sel Observations, J. Climate, 14, 4062–4072, 2001.
Steineke, S. B. and Jehle, J. A.: Investigating the horizontal trans-mission of the Cydia pomonella granulovirus (CpGV) in a model system, Biological Control, 30, 538–545, 2004.
Theoharatos, G. A. and Tselepidaki, I. G.: The distribution of rainy days in the Aegean Area, Theor. Appl. Climatol., 42, 111–116, 1990.
Thorne, P. W., Parker, D. E., Christy J. R., and Mears, C. A.: Uncer-tainties in climate trends, Am. Meteor. Soc., 1437–1442, 2005. Tolika, K. and Maheras, P.: Spatial and temporal characteristics of