www.atmos-chem-phys.net/8/4855/2008/ © Author(s) 2008. This work is distributed under the Creative Commons Attribution 3.0 License.
Chemistry
and Physics
Multiphase modeling of nitrate photochemistry in the quasi-liquid
layer (QLL): implications for NO
x
release from the Arctic and
coastal Antarctic snowpack
C. S. Boxe and A. Saiz-Lopez
Earth and Space Science Div., NASA Jet Propulsion Laboratory, California Inst. of Technology, Pasadena, CA 91109, USA Received: 18 January 2008 – Published in Atmos. Chem. Phys. Discuss.: 26 March 2008
Revised: 30 June 2008 – Accepted: 28 July 2008 – Published: 21 August 2008
Abstract. We utilize a multiphase model, CON-AIR (Condensed Phase toAirTransfer Model), to show that the photochemistry of nitrate (NO−3) in and on ice and snow sur-faces, specifically the quasi-liquid layer (QLL), can account for NOx volume fluxes, concentrations, and [NO]/[NO2] (γ=[NO]/[NO2]) measured just above the Arctic and coastal Antarctic snowpack. Maximum gas phase NOx volume fluxes, concentrations andγ simulated for spring and sum-mer range from 5.0×10⁴ to 6.4×10⁵molecules cm−3s−1, 5.7×10⁸ to 4.8
×109molecules cm−3, and
∼0.8 to 2.2, re-spectively, which are comparable to gas phase NOxvolume fluxes, concentrations and γ measured in the field. The model incorporates the appropriate actinic solar spectrum, thereby properly weighting the different rates of photolysis of NO−3 and NO−2. This is important since the immediate precursor for NO, for example, NO−2, absorbs at wavelengths longer than nitrate itself. Finally, one-dimensional model simulations indicate that both gas phase boundary layer NO and NO2exhibit a negative concentration gradient as a func-tion of height although [NO]/[NO2] are approximately con-stant. This gradient is primarily attributed to gas phase reac-tions of NOxwith halogens oxides (i.e. as BrO and IO), HOx, and hydrocarbons, such as CH3O2.
1 Introduction
Interest in the nitrogen cycle over the polar regions was revi-talized due to elevated NOx (NO+NO2) levels detected in
Correspondence to:C. S. Boxe ([email protected])
and above snowpacks (Honrath et al., 1999; Jones et al., 2000). Absorbing atλ≥290 nm, nitrate(NO−3)is one of the dominant anions present in the snowpack with approximately an even surface distribution with latitude and longitude at both polar regions (Legrand and Meyeski, 1997; Mulvaney et al., 1998). Due to production and long-range transport, ni-trate concentrations at the Arctic (∼10µM) are higher than those measured at coastal Antarctica (∼5µM). Through so-lar photolysis, nitrate is a major source of NOx emissions from the snowpack. NOxmixing ratios within and above the snowpack are proportional to NOxproduction rates, time of day, and temperature (Cotter et al., 2003; Jones et al., 2000). Consequently, nitrate photochemistry has been the focus of a series of field (Honrath et al., 1999., 2000a, 2002; Jones et al., 2000; Davis et al., 2001, 2004; Zhou et al., 2001; Dibb et al., 2002, 2004; Qiu et al., 2002; Beine et al., 2002, 2003; Jacobi et al., 2004) and laboratory experiments (Honrath et al., 2000b; Dubowski et al., 2001, 2002; Chu and Anasta-sio, 2003, Boxe et al., 2003, 2005, 2006; Jacobi et al., 2006; Jacobi and Hilker, 2007).
formation of oxidized hydrocarbons (e.g. formaldehyde, ac-etaldehyde, acetone) (Domin´e and Shepson, 1999; Sumner and Shepson, 2002; Grannas et al., 2004). In addition, HONO has been measured in the polar regions (Zhou et al., 2001; Honrath et al., 2002; Amoroso et al., 2006; Clemit-shaw, 2006), where it has also been suggested as a possible byproduct of nitrate photolysis (Zhou et al., 2001). Yet, ac-tual HONO concentrations and its source at polar sites have been debated (Chen et al., 2004; Dibb et al., 2004; Liao et al., 2006; Jacobi et al., 2007).
It is clear that overlying boundary layer chemistry is af-fected by photochemistry occurring at the snowpack at po-lar regions. A useful tool to study specified photochemi-cal mechanisms occurring in the snowpack is to multiphase model boundary layer chemistry linked to chemistry at the snowpack surface, which requires a physicochemical under-standing of ice surfaces. The ice-air interface of solids is an area that exhibits characteristics different from those of the bulk material. This is primarily due to the fact that atoms (or molecules) at the surface only encounter bonding forces with other molecules from one side; simultaneously, there is a similar imbalance at other interfaces. Furthermore, this behavior causes the dislocation of atoms from their origi-nal locations, alterations in their associated force and energy constants, and effects on layers below the ice-air demarca-tion. Michael Faraday in 1850 first suggested that the ice-air interface consists of a thin wet film (Faraday, 1850), vari-ously called the quasi-liquid layer (QLL), premelting layer, liquid-like layer, or surface melting layer, by showing “that a particle of water which could retain the liquid state whilst touching ice on only one side, could not retain the liquid if it were touched by ice on both sides” (Faraday, 1850).
The fact that the boundary between the solid and vapor phase is wetted by a thin liquid film causes the free energy of the boundary to be lower than it would be if the thin liquid film were absent (Dash et al., 1995). As a result, if the surface of ice were initially dry, then it would reduce its interfacial free energy by converting a layer (e.g. the surface) of the solid to liquid. Hence, a liquid-like layer should exist over some measurable and quantifiable temperature range on the surface of ice, below its bulk normal melting temperature. The existence of the QLL is not prohibited due to its thinness and closeness to the normal melting temperature of ice and is present at a state where the free energy of the ice system is at a minimum and is governed by the competition between the free energy of the ice surface and the energy required to melt a solid layer.
The thickness of the QLL as a function of temperature has been quantified both experimentally (Doppenschmidt and Butt, 2000; Pittenger et al., 2001; Bluhm et al., 2002; Sadtchenko and Ewing, 2002) and theoretically (Ohnesorge et al., 1994; Landa et al., 1995; Wettlaufer, 1999). With the single exception of Elbaum et al. (1993), whose experiments were done on exposed horizontal facets in the prismatic ori-entation 10¯10, these studies have shown that the QLL
in-creases with increasing temperature. Additionally, impurities enhance its thickness (Doppenschmidt and Butt, 2000; Wett-laufer, 1999). The addition of impurities at constant pressure will shift the normal melting point of the bulk solid, which is directly dependent on the concentration of the impurity. As the melting point is approached, the QLL appears to be in-distinguishable from the liquid phase in its uppermost layers. Concurrently, we do acknowledge that, at specified temper-ature regimes, below the actual melting point of pure water ice, the QLL is distinctly dissimilar than pure liquid water (e.g. its ability to take up trace gases). For instance, McNeill et al. (2006) showed for the first time that the solubility of HCl in the QLL, rather exhibiting a solubility similar that in a true-liquid matrix, exhibits a solubility that is intermedi-ate between that in bulk ice and its respective solubility in a true-liquid matrix.
The QLL can play a pivotal role in environmental phe-nomena such as 1) controlling the friction of ice and snow; 2) soil freezing, permafrost formation, and frost heave; 3) sintering and sliding in glaciers, sea-ice, and snow fields; and 4) behavior of atmospheric ice (Dash et al., 1995). The QLL has also been suggested to contribute to the electrifi-cation of thunder clouds via charge transfer at the liquid-ice interface (Baker and Dash, 1994). Abbatt et al. (1992) and Molina (1994) even proposed that polar stratospheric clouds are able to accommodate HCl by dissolution in multilayer-thick quasi-liquid films, where they can efficiently partici-pate in ozone destruction during winter and spring months in Antarctica and the Arctic. These hypotheses were later con-firmed by seminal work, via laboratory analyses, showing ex-plicitly that trace gases do efficiently accommodate snow/ice surfaces through trace-gas induce QLL formation McNeill et al. (2006).
As shown in Jones et al. (2007), spring and sum-mertime maximum NOx volume fluxes range from ∼4.5×10⁴ to ∼5.5×10⁵molecules cm−3s−1. In addition, field measurements of NOx range from ∼5.7×10⁸ to ∼2.9×10⁹molecules cm−3 and exhibit [NO]/[NO2] (γ=[NO]/[NO2])from∼0.8 to∼2.0 (Hon-rath et al., 1999, 2002; Jones et al., 2000; Beine et al., 2002; Dibb et al., 2002; Simpson et al., 2007). In this study, we use CON-AIR to show that nitrate photochemistry in the QLL does simulate well NOxvolume fluxes, concentrations, andγ measured just above the snowpack (i.e. at ∼25 cm) at various sites in the Arctic and coastal Antarctica. The implications of these findings are also discussed.
2 Model description
and ice, where water molecules are not in a rigid solid struc-ture, yet not in the random order of a liquid (Petrenko and Whitworth, 1999), which, in our model, is the demarcation between the vapor and bulk ice phase. It is structured in two main components: i) condensed phase chemistry and pho-tochemistry regime in the QLL; and ii) gas phase chemistry scheme comprising photochemical, thermal, and heteroge-neous reactions.
The exchange of nitrogen species between the QLL and the atmosphere depends on the respective Henry’s law constants of species including NO and NO2. The Henry’s law solubility constants and temperature de-pendences for the gas phase equilibrating species NO and NO2 are 1.9×10⁻³×e(1500(1/T−1/T o))M atm−1 and
6.4×10⁻³e(2500(1/T−1/T o))M atm−1, respectively (Schwartz
and White, 1981; Lelieveld and Crutzen, 1991). The tem-perature dependence of the solubility of species is taken into account by including a diurnal variation of the typical tem-perature profile of both the Arctic and coastal Antarctic re-gion during spring and summertime (i.e. 250≤T/K≤265). A description of the radiation and gas phase scheme, and a complete set of all gas phase reactions employed in the model are summarized in Table 1 of the supple-mentary material (http://www.atmos-chem-phys.net/8/4855/ 2008/acp-8-4855-2008-supplement.pdf).
2.1 Condensed phase scheme and QLL parameterizations We note that the following formulation is developed within the context of a current overall shortage of physico-chemical data pertinent to the uptake and release of trace gases to snow/ice at conditions relevant for the polar snowpack. Bulk concentrations ofNO−3 and NO−2 (i.e. at the top few cen-timeters) at the Arctic and coastal Antarctic snowpack are 1≤[NO−3]/µM≤17 and∼1 nM, respectively (Stotlemyer and Toczydlowski, 1990; Jaffe and Zukowski, 1993; Li, 1993; Silvente and Legrand, 1995; De Angelis and Legrand, 1995; Dibb et al., 1998; Jones et al., 2007). A number of labora-tory experiments have provided evidence that the photolysis of nitrate transpires in the QLL on the surface of ice crys-tals (Dubowski et al., 2001, 2002; Boxe et al., 2003; Chu and Anastasio, 2003). In this study, we restrict our model simulations within the context that all condensed phase re-actions take place in the much smaller volume of the QLL. Typical bulk concentrations of NO−3 and NO−2 measured in the Arctic and coastal Antarctic snowpack were re-quantified following the formulation established by Cho et al. (2002). Cho et al. (2002) derived the following equation
ψH2O(T )=
mH2ORTf
1000Hf0 T Tf −T
C0T, (1)
which relates the fraction of liquid water(ψH2O)as a
func-tion of temperature (T) and the total solute concentration in the QLL(C0T). ψH2O(T ) is the fraction of water in the
QLL as a function of temperature, mH2O is the
molecu-lar weight of water (18.01 g/mole), R is the gas constant (8.314×10⁻³kJ/K mole), H0
f is enthalpy of fusion of
wa-ter (6 kJ/mole), andTf is the freezing temperature of water
(273.15 K). Assuming that the total initial concentrations of NO−3 and NO−2 reside in the QLL, we relate their respective bulk concentrations(Cbulk)to their respective concentrations in the QLL via Eq. (2):
Cbulk=ψH2O(T )C
0
T (2)
Substituting Eq. (1) into Eq. (2), yields the following:
ψH2O(T )=
s
mH2ORTf
1000Hf0 T Tf −T
Cbulk. (3)
Then, given the upper limit Cbulk−upper−limit (=17.0001µM, [NO−3]o=17µM and [NO−2]o=1 nM) and the lower
limit Cbulk−lower−limit (=1.0001µM, [NO−3]o=1µM and
[NO−2]o=1 nM), we calculate 4.54×10⁻⁵ and 1.01×10⁻⁵
as the mean of the upper and lower limitψH2Ofrom 250 to
265 K, respectively, by using Eqs. (4) and (5): mean ofψH2O−upper−limit
=
i=265
P
i=250
r
mH2ORTf
1000Hf0
Ti
Tf−TiCbulk−upper−limit
16 ; (4)
mean ofψH2O−lower−limit
=
i=265
P
i=250
r
mH2ORTf
1000H0
f
Ti
Tf−TiCbulk−lower−limit
16 . (5)
Summing the mean of ψH2O−upper−limit and themean of
ψH2O−lower−limit gives 5.55×10−
5. In CON-AIR, as an approximation, we incorporate the average of this sum, 2.78×10⁻⁵, as the fraction of liquid water, representative for temperatures from 250 to 265 K. Taking the mean of the median of[NO−3]o found both in the Arctic (i.e. from 3 to
17µM) and coastal Antarctic (i.e. from 1 to 9µM) yields 7.5µM. Then, as an estimation, we take [NO−3]o=7.5µM
and[NO−2]o=1 nM as their initial bulk concentrations. Using
Eq. (2), the concentration of[NO−3]oand[NO−2]oin the QLL
is 270 mM and 0.04 mM, respectively, which we incorporate in CON-AIR as their initial concentrations.
Given our estimated ψH2O=2.78×10−
5, we calculate a QLL thickness∼300 nm by the following formulation: snow depth×snow column cross-sectional area×mass fraction of liquid water = 1 cm×1 cm2×2.78×10−5=2.78×10⁻⁵cm3; then, 2.78×10⁻⁵cm3/1 cm2=278 nm∼300 nm. This derived QLL thickness is comparable to previous laboratory mea-surements (Boxe, 2005; McNeill, 2005).
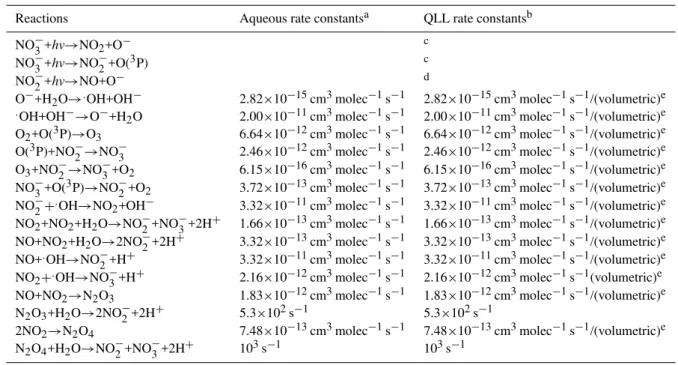
Table 1.QLL reactions and rate constants.
Reactions Aqueous rate constantsa QLL rate constantsb NO−3+hv→NO2+O− c
NO−3+hv→NO−2+O(3P) c
NO−2+hv→NO+O− d
O−+H2O→.OH+OH− 2.82×10⁻¹⁵cm3molec−1s−1 2.82×10⁻¹⁵cm3molec−1s−1/(volumetric)e
.OH+OH−→O−+H2O 2.00×10⁻¹¹cm3molec−1s−1 2.00×10⁻¹¹cm3molec−1s−1/(volumetric)e
O2+O(3P)→O3 6.64×10⁻¹²cm3molec−1s−1 6.64×10⁻¹²cm3molec−1s−1/(volumetric)e
O(3P)+NO−2→NO−3 2.46×10⁻¹²cm3molec−1s−1 2.46×10⁻¹²cm3molec−1s−1/(volumetric)e O3+NO−2→NO−3+O2 6.15×10⁻¹⁶cm3molec−1s−1 6.15×10⁻¹⁶cm3molec−1s−1/(volumetric)e NO−3+O(3P)→NO−2+O2 3.72×10⁻¹³cm3molec−1s−1 3.72×10⁻¹³cm3molec−1s−1/(volumetric)e NO−2+.OH→NO2+OH− 3.32×10⁻¹¹cm3molec−1s−1 3.32×10⁻¹¹cm3molec−1s−1/(volumetric)e NO2+NO2+H2O→NO−2+NO−3+2H+ 1.66×10⁻¹³cm3molec−1s−1 1.66×10⁻¹³cm3molec−1s−1/(volumetric)e NO+NO2+H2O→2NO−2+2H+ 3.32×10⁻¹³cm3molec−1s−1 3.32×10⁻¹³cm3molec−1s−1/(volumetric)e NO+.OH→NO−2+H+ 3.32×10⁻¹¹cm3molec−1s−1 3.32×10⁻¹¹cm3molec−1s−1/(volumetric)e NO2+.OH→NO−3+H+ 2.16×10⁻¹²cm3molec−1s−1 2.16×10⁻¹²cm3molec−1s−1(volumetric)e
NO+NO2→N2O3 1.83×10⁻¹²cm3molec−1s−1 1.83×10⁻¹²cm3molec−1s−1/(volumetric)e N2O3+H2O→2NO−2+2H+ 5.3×10²s−1 5.3×10²s−1
2NO2→N2O4 7.48×10⁻¹³cm3molec−1s−1 7.48×10⁻¹³cm3molec−1s−1/(volumetric)e
N2O4+H2O→NO−2+NO3−+2H+ 103s−1 103s−1
aAqueous phase reaction rate constants were obtained from Mack and Bolton (1999).
bQLL rate reaction rate constants were quantified by including the “volumetric” factor (Grannas et al., 2007; Takenaka et al., 1996). cJ
NO−3 values were extrapolated from Qui et al. (2002) and King et al. (2005). dJ
NO−2 was extrapolated from Zuo and Deng (1999). evolumetric
∼8.20×10⁻⁴(Grannas et al., 2007; Takenaka et al., 1996).
result, the total potential liquid content in a snow column of 1 cm2cross-sectional area of snowpack is:
total potential liquid content= 1 cm×0.31 g cm −3
1 g cm−3
=0.31 cm3cm−2 (6) The estimated fraction of liquid water is 2.78×10⁻⁵; there-fore, the QLL volume at the snowpack surface:
QLL volume=0.31 cm3cm−2×2.78×10−5
=8.6×10⁻⁶cm3cm−2 (7) To properly express aqueous phase reaction rates to QLL re-action rates, a volumetric factor (volumetric) was estimated based on laboratory derived reaction rate enhancement fac-tors. A volumetric factor was quantified by taking the av-erage of the upper limit reaction rate enhancement factors obtained in the laboratory by Grannas et al. (2007) and Tak-enaka et al. (1996), 40 and 2.4×10³, respectively, yielding
volumetric= 40+2.4×10 3
2 =1.22×10 3
(8)
Therefore, the reaction rates are quantified by incorporating volumetric factor, volumetric. The rate constants for reac-tions taking place in the QLL are:
k×volumetric, (9)
k×volumetric2, (10)
wherekare the actual literature aqueous phase rate constants in units of cm3molecule−1s−1and cm6molecule−2s−1, for second- and third-order rate constants, respectively. Table 1 lists the major reactions pertaining to nitrate photochemistry, their condensed phase reaction rates, and their QLL reaction rates.
The rate constant for the transfer of species from the QLL to the gas phase is calculated using an approximation of the first order rate constant, kt=1.25×10⁻⁵s−1 (Gong et al.,
1997; Michalowski et al., 2000).
kmix=kt×
9.31×10⁻⁶cm3(QLL)
for the phase equilibration of species from the QLL to the atmosphere is:
k(QLL→Atmosphere)=(kmix × [species concentration] × volumetric) /(H′) , (12) whereH′ is the dimensionless Henry’s law constant. H′is defined asH′=(H RT ), whereH is a species’ Henry’s law constant,R is the gas constant, 0.082058 L atm K−1mol−1, andT is the temperature (K).
3 Results and discussion
The photochemistry of nitrate in the aqueous phase has been studied extensively (Mark et al., 1996; Mack and Bolton, 1999). Dissolved nitrate has two primary absorp-tion bands in the ultraviolet (UV). The first occurs in the far UV via the strongπ→π∗transition, centered at 201 nm (εmax=9500 M−1cm−1), and the second is a weaker absorp-tion band that occurs via the highly forbiddenn→π∗ tran-sition, centered at 302 nm (εmax=7.14 M−1cm−1). Further-more, it was proposed that the weaker absorption band may occur from the combination of a singlet and tripletn→π∗
andσ→π∗transition (Maria et al., 1973).
Mack and Bolton (1999) showed that the overall stoi-chiometry for nitrate irradiation is
NO−3 −→hv NO−2 +1
2O2. (R1)
In the absence of.OH scavengers this stoichiometry is
main-tained over the entire pH range (Wagner and Strehlow, 1980). Forλ<280 nm, the major reaction pathway is through iso-merization of[NO−3]∗, generated via Reaction (R2), to form ONOO−, peroxynitrite, and at low pH, peroxynitrous acid, HONOO (Reaction R3). HONOO can also be produced from the recombination of.OH and NO2within a solvent cage as shown in Reaction (R4). HONOO isomerizes rapidly back to NO−3 (Reaction R5) (Mack and Bolton, 1999).
NO−3 −→ [hv NO−3]∗ (R2)
NO−3 −→ ONOO−+H++ −→ HONOO (R3)
.
OH+NO2−→ HONOO (R4)
HONOO−→NO−3 +H+ (R5)
Yet, in the troposphere, allλ<290 nm is completely attenu-ated by stratospheric ozone. Therefore,λ≥290 nm are per-tinent for this study. In aqueous solutions at pH<6 and
λ≥290 nm, nitrate photolysis proceeds via two primary pho-tolytic pathways as illustrated in Reactions (R6) and (R7), through the generation of nitrate in the excited state,[NO−3]∗, from Reaction (R2). As shown in Reaction (R8), O−reacts rapidly with water to form the hydroxyl radical.
[NO−3]∗+H+−→NO2+O− (R6)
[NO−3]∗−→ NO−2 +O(3P) (R7)
O−+H2O−→.OH+OH− (R8)
Atomic oxygen produced in Reaction (R7) can react with molecular oxygen ([O2]water∼0.3 mM) via Reaction (R9) or with nitrate by way of Reaction (R10) (Warneck and Wurzinger, 1988).
O2+O(3P)−→O3 (R9)
NO−3 +O(3P)−→NO−2 +O2 (R10) Ozone, generated by Reaction (R9), is either consumed by reaction with NO−2 (Reaction R11) (Hoigne et al., 1985) or by decomposition to.OH (Hoigne et al., 1985).
NO−2 +O3−→NO−3 +O2 (R11)
The UV absorption spectrum of nitrite displays three ab-sorption bands: the first involves a π→π∗ transition with maxima at 220 nm, and the latter two peaks are maxima at 318 nm (εmax=10.90 M−1cm−1) and 354 nm (εmax=22.90 M−1cm−1), both corresponding ton
→π∗ tran-sitions. Similar to nitrate, nitrite undergoes direct photolysis as shown in Reaction (R12) to produce NO, and it also oxi-dizes by reaction with.OH via Reaction (R13).
NO−2 +H+−→hv NO+.OH (R12)
NO−2 +.OH−→NO2+OH− (R13)
The photolysis of NO2 also produces NO (Reaction R14). We exclude this reaction from the chemical scheme used in CON-AIR since its photolytic lifetime during midday spring and summertime(1/JNO2=1/4.6×10−
3s−1
≈217 s ) (Yung and DeMore, 1999) is longer than its diffusion life-time through a∼300 nm thick QLL (see above calculation). As calculated using the diffusion length equation (Eq. 13) (Dubowski et al., 2001):
NO2−→hv NO+O(3P) (R14)
L=√Dτ;τ = (300×10
−7cm)2
9.8×10⁻⁹cm2s−1 ≈0.09 s (13)
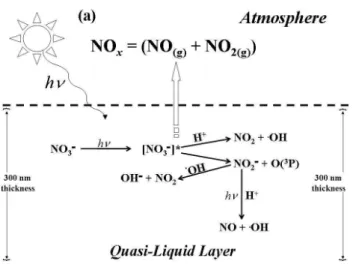
Fig. 1.Simplified schematic diagram illustrating the primary reac-tions governing NOxrelease from a 300 nm thick QLL film to the
gas phase from nitrate photochemistry. At QLL depths<15µm, NO2photolysis does not occur, while at QLL depths>15µm NO2
photolysis occurs.
which undergoes further chemical and photolytic processing (Dubowski et al., 2001; Boxe et al., 2005, 2006). Finally, the photoproduced NO and NO2are readily released to the gas phase after equilibration due to their low solubility (Re-action R15).
NO2(QLL),NO(QLL)
escape
−→ NO2(g),NO(g) (R15)
The protonation of nitrite to form nitrous acid(HONO(aq))
(Reaction R16) was also not considered in the QLL reac-tion mechanism since model simulareac-tions yieldedγ∼1500, much larger than any reported measurements from field stud-ies (e.g.γ∼0.8 to∼2.0) (Honrath et al., 1999, 2002; Jones et al., 2000, 2007; Beine et al., 2002; Dibb et al., 2002; Simp-son et al., 2007). This result implies that a significant amount of HONO produced in the snowpack may be retained by ma-trix or solvent cage effects or may be dependent on pho-tosensitized organic compounds, such as possible reaction cycles that may efficiently transfer electrons to NO2, possi-bly leading to the production of HONO (Beine et al., 2006). Presently, the mechanism of HONO formation from NO−3 is not well known.
NO−2 +H+−→HONO(aq)⇔ HONO(g) (R16)
A simplified scheme illustrating the primary reactions gov-erning NOxrelease from the QLL film to the gas phase from nitrate photochemistry used in CON-AIR is shown in Fig. 1. Laboratory studies have shown that the photochemistry of ni-trate in ice is analogous to its aqueous phase photochemistry (Dubowski et al., 2001, 2002; Chu and Anastasio et al., 2003; Boxe et al., 2006) Therefore, as shown in Table 1, QLL reac-tion rates were quantified by scaling aqueous phase reacreac-tion rates according to the micro-scopic dimensions of the QLL.
Wavelength (nm)
280 300 320 340 360 380 400 420
M
o
la
r
A
b
o
r
p
tiv
it
y
(M
-1 cm -1)
0 5 10 15 20 25
R
el
a
ti
v
e F
lu
x
(
a
rb
it
ra
ry
u
n
it
s)
0.0 0.2 0.4 0.6 0.8 1.0 1.2
The absorption spectrum for NO3
-. The absorption spectrum for NO2
-. Normalized solar spectrum at Earth's surface.
Fig. 2.The absorption spectrum for NO−3 and NO−2 (Gaffney et al., 1992; Zuo and Deng, 1998) and the normalized solar spectrum at the Earth’s surface from 290 to 400 nm.
Laboratory studies have shown that nitrate is a source of NO and NO2 from ice surfaces (Honrath et al., 2000b; Dubowski et al., 2001, 2002; Chu and Anastasio, 2003; Boxe et al., 2003, 2005, 2006; Jacobi et al., 2006; Jacobi and Hilker, 2007). Only a small number of laboratory inves-tigations of nitrate photochemistry in ice were carried out to correlate their respective NO and NO2 fluxes with field measurements (Boxe et al., 2003, 2006). Yet, these stud-ies were restricted by high detection limits for NO and NO2 and the use of irradiation sources emitting at 313±20 nm (i.e. overlapping the absorption spectrum of nitrate), result-ing in higher NOxconcentrations than measured in the field and much lower γ (e.g. 0.043 to 0.0005) than those mea-sured over the Arctic and Antarctic snowpack (Boxe et al., 2003, 2006). Compared to the typical initial nitrate concen-trations (1 to 20µM) and the typical actinic flux spectrum at Earth’s surface for the Arctic and coastal Antarctic re-gions, the higher initial nitrate concentrations (50 mM) and the dissimilar actinic flux spectrum used, likely contributed to the disparity between these laboratory results and those from the field. Figure 2 illustrates this disparity to some ex-tent by comparing the absorption spectrum for nitrate and nitrite and the actinic flux spectrum at the Earth’s surface. The surface irradiance is computed using a 2-stream radia-tive transfer code (Thompson, 1984). We calculate the di-urnal variation of JNO−
3 and JNO−2 for snowpack summer
and springtime conditions by extrapolating laboratory mod-eled and measuredJNO−
3 andJNO−2 for ice, snowpack, and
seawater (Zuo and Deng, 1998, Qiu et al., 2002; King et al., 2005) to the radiative transfer code, coupled to CON-AIR, such that JNO−
3 and JNO−2 vary as a function of
so-lar zenith angle (or as a function of time of day), therefore providing a more complete representation of nitrate photo-chemistry. Note, the smaller and larger summer/springtime diurnal profiles of JNO−
time (hr)
0 5 10 15 20 25
V
o
lum
e
F
lux
(
m
o
le
c
ul
es
c
m
-3 s -1)
0.0 5.0e+4 1.0e+5 1.5e+5 2.0e+5 2.5e+5 3.0e+5 3.5e+5
summertime NO2 incorporating lower limit JNO3
-. summertime NO2 incorporating upper limit JNO3 -.
summertime NO with diurnal JNO2 - profile.
(a)
time (hr)
0 5 10 15 20 25 30
V
o
lu
m
e F
lu
x
(
m
o
lec
u
les
cm
-3 s -1)
0 5000 10000 15000 20000 25000 30000 35000
springtime NO2 incorporating lower limit JNO3 -.
springtime NO2 incorporating upper limit JNO3 -.
springtime NO with diurnal JNO2
profile. (b)
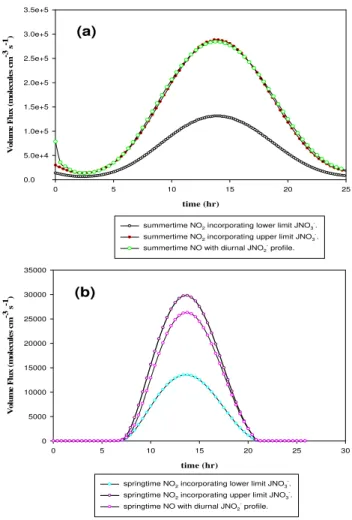
Fig. 3. (a)Simulated diurnal summer volume flux profiles of NO and NO2just above the snowpack.(b)Simulated diurnal springtime
volume flux profiles of NO and NO2just above the snowpack.
the lower and upper limits for the JNO−
3 values obtained
for surface snow and sea-ice (Qiu et al., 2002; King et al., 2005), while the summer/springtime diurnal profile ofJNO−
2
was derived from extrapolating theJNO−
2 value obtained for
surface seawater (Zuo and Deng, 1998). Figure 3 illus-trates a typical diurnal profile for NO (e.g. maximum volume fluxes of 2.3×10⁴molecules cm−3s−1 during spring and 3.2×10⁵molecules cm−3s−1during summer) and NO2(e.g. maximum concentrations of 1.2×10⁴molecules cm−3s−1 to 2.7×10⁴molecules cm−3s−1during spring and 1.8
×105 to 3.2×10⁵molecules cm−3s−1 during summer) over the Arctic and Antarctic snowpack. These simulated NOx volume fluxes are comparable to field measurements of Jones et al. (2007). Assuming a ∼100 m bound-ary height and taking the median of the concentra-tion of molecules between 250 and 265 K at atmo-spheric surface pressure (1 atm or 1.01325×10⁵ N m−2)
(2.86×10¹⁹molecules cm−3), simulated maximum concen-trations of NOx, ∼5.7×10⁸ to ∼4.8×10⁹molecules cm−3,
Mixing ratio / ppt
2 4 6 8 10 12 14 16
H
e
ig
h
t / m
5 10 15 20
NO NO2
Fig. 4.Calculated summertime gas phase NO and NO2
concentra-tion profiles as a funcconcentra-tion of height above the snowpack.
agree well with maximum concentrations of NOxmeasured just above the snowpack by field measurements,∼5.7×10⁸ to∼2.9×10⁹molecules cm−3, (Honrath et al., 1999, 2002; Jones et al., 2000; Beine et al., 2002; Dibb et al., 2002; Simp-son et al., 2007). It also accounts for the range ofγ mea-sured during Arctic and Antarctic summer and springtime, where springtime maximumγ ranges from∼0.84 to∼1.86 and summertime maximumγ ranges from∼0.50 to∼2.20, which is also in good accord with measuredγover the snow-pack (Honrath et al., 1999, 2002; Jones et al., 2000; Beine et al., 2002; Dibb et al., 2002; Simpson et al., 2007). Fur-thermore, these model results reinforce laboratory and snow chamber results showing that the major source of NO release from snow/ice surfaces isNO−2, its immediate photolytic pre-cursor that absorbs at wavelengths longer than nitrate itself (Cotter et al., 2003; Boxe et al., 2006), as shown in Fig. 2. Thus, incorporating the actinic flux at the Earth’s surface shows that nitrite is more photolabile than nitrate (Cotter et al., 2003).
4 Summary and conclusions
We use a novel multiphase model, CON-AIR (Condensed Phase toAirTransfer Model) to show that the photochem-istry of nitrate in and on snow/ice surfaces (i.e. the QLL) can account for measured NO and NO2volume fluxes, con-centrations, and [NO]/[NO2] measured just above the Artic and coastal Antarctic snowpack. Our model results produce comparable results although polar snowpack site physico-chemical properties are dynamic and specific in nature. In addition, our model simulations suggest that, in general, ni-trite photolysis (predominantly produced from nitrate pho-todecomposition) governs the release of NOxjust above the Arctic and coastal Antarctic snowpack, which is controlled by nitrite’s coincident absorption spectrum with the solar spectrum at the polar snowpack surface. Finally, our model analyses show that NO and NO2display a negative tration gradient as a function of height although their concen-tration ratios remain constant. We attribute this effect to gas phase reactions of these species with halogen oxides, HOx, and hydrocarbons.
Acknowledgements. C. S. Boxe and A. Saiz-Lopez were supported by an appointment to the NASA Postdoctoral Program at the Jet Propulsion Laboratory, administered by Oak Ridge Associated Universities through a contract with the National Aeronautics and Space Administration (NASA). Research at the Jet Propulsion Laboratory, California Institute of Technology, under a contract with NASA, was supported by the NASA Upper Atmosphere Research and Tropospheric Chemistry Programs.
Edited by: V. F. McNeill
References
Amoroso, A., Beine, H. J., Sparapani, R., Nardino, M., and Alle-grini, I.: Observations of coinciding arctic boundary layer ozone depletion and snow surface emissions of nitrous acid, Atmos. En-viron., 40, 1949–1956, 2006.
Baker, M. B. and Dash, J. G.: Mechanism of change-transfer be-tween colliding ice particles in thunderstorms, J. Geophys. Res.-Atmos., 99, 10 621–10 626, 1994.
Beine, H. J., Honrath, R. E., Domin´e, F., Simpson, W. R., and Fuentes, J. D.: NOxduring background and ozone depletion
pe-riods at Alert: fluxes above the snow surfaces, J. Geophys. Res., 107, 4584, doi:10.1029/2002JD002082, 2002.
Beine, H. J., Domin´e, F., Ianniello, A., Nardion, M., Allegrini, I., Teinila, K., and Hillamo, R.: Fluxes of nitrate between snow surfaces and the atmosphere in the European high Arctic, Atmos. Chem. Phys., 3, 335–346, 2003,
http://www.atmos-chem-phys.net/3/335/2003/.
Beine, H. J., Amoroso, A., Domin´e, F., King, M. D., Nardino, M., Ianniello, A., and France, J. L.: Surprisingly small HONO emis-sions from snow surfaces at Browning Pass, Antarctica, Atmos. Chem. Phys., 6, 2569–2580, 2006,
http://www.atmos-chem-phys.net/6/2569/2006/.
Bluhm, H., Olgetree, D. F., Fadley, C. S., Hussain, Z., and Salmeron, N.: The premelting of ice studied with photoelectron spectroscopy, J. Phys.-Condens. Matter, 14, L227–L233, 2002. Blunier, T. G., Floch, L., Jacobi, H.-W., and Quansah, E.: Isotopic
view on nitrate loss in Antarctic surface snow, Geophys. Res. Lett., 32, L13501, doi:10.1029/2005GL023011, 2005.
Boxe, C. S., Colussi, A. J., Hoffmann, M. R., Tan, D., Mastro-marino, J., Case, A. T., Sandholm, S. T., and Davis, D. D.: Mul-tiscale ice fluidity in NOxphotodesorption from frozen nitrate
solutions, J. Phys. Chem. A, 107, 11 409–11 413, 2003. Boxe, C. S.: Nitrate photochemistry and interrelated chemical
phe-nomena in ice: influence of the quasi-liquid layer (QLL), Ph.D. thesis, California Institute of Technology, 2005.
Boxe, C. S., Colussi, A. J., Hoffmann, M. R., Murphy, J. G., Wooldridge, P. J., Betram, T. H., and Cohen, R. C.: Photochem-ical production and release of gaseous NO2from nitrate-doped
water ice, J. Phys. Chem. A, 109, 8520–8525, 2005.
Boxe, C. S., Colussi, A. J., Hoffmann, M. R., Perez, I. M., Mur-phy, J. G., and Cohen, R. C.: Kinetics of NO and NO2evolution from illuminated frozen nitrate solutions, J. Phys. Chem. A, 110, 3578–3583, 2006.
Chen, G., Davis, D., Crawford, J., Hutterli, L. M., Huey, L. G., Slusher D., Mauldin, L., Eisele, F., Tanner, D., Dibb, J., Buhr, M., McConnell, J., Lefer, B., Shetter, r., Blake, D., Song, C. H., Lombardi, K., and Arnoldy, J.: A reassessment of HOxSouth
Pole chemistry based on observations recording during ISCAT 2000, Atmos. Environ., 38, 5451–5461, 2004.
Cho, H., Shepson, P. B., Barrie, L. A., Cowin, J. P., and Zaveri, R.: NMR investigations of the quasi-brine layer in ice/brine mix-tures, J. Phys. Chem. B, 106, 11 226–11 232, 2002.
Chu, L. and Anastasio, C.: Quantum yields of hydroxyl radical and nitrogen dioxide from the photolysis of nitrate on ice, J. Phys. Chem. A, 107, 9594–9602 2003.
Clemitshaw, K. C.: Coupling between the tropospheric photochem-istry of nitrous acid (HONO) and nitric acid (HNO3), Environ. Chem., 3, 31–34, 2006.
Cotter, E. S. N., Jones, A. E., Wolff, E. W., and Baugitte, S. J.-B.: What controls photochemical NO and NO2production from
Antarctic snow? Laboratory investigation assessing the wave-length and temperature dependence, J. Geophys. Res., 108, 4147, doi:10.1029/2002JD))2602, 2003.
Dash, J. G., Fu, H. Y., and Wettlaufer, J. S.: The premelting of ice and its environmental consequences, Rep. Prog. Physics, 58, 115–167, 1995.
Davis, D., Nowak, J. B., Chen, G., Buhr, M., Arimoto, R., Hogan, A., Eisele, F., Mauldin, L., Tanner, D., Shetter, R., Lefer, B., and McMurry, P.: Unexpected high levels of NO observed at South Pole, Geophys. Res. Lett., 28, 3625–3628, 2001.
Davis, D., Chen, G., Buhr, M., Crawford, J., Lenschow, D., Lefer, B., Shetter, R., Eisele, F., Mauldin, L., and Hogan, A.: South Pole NOxchemistry: an assessment of factors controlling
vari-ability and absolute levels, Atmos. Environ., 38, 5375–5388, 2004.
De Angelis, D. and Legrand, M.: Preliminary investigations of post-depositional effects of HCl, HNO3, and organic acids in polar firn layers, in: Ice Core Studies of Global Biogeochemical Cy-cles, NATO ASI Ser., Ser. I, vol. 30, edited by: Delmas, R. J., Springer-Verlag, New York, 361–381, 1995.
Fast nitrogen oxide photochemistry in Summit, Greenland snow, Atmos. Environ., 36, 2501–2511, 2002.
Dibb, J. E., Huey, G. L., Slusher, D. L., and Tanner, D. J.: Solu-ble reactive nitrogen oxides at South Pole during ISCAT 2000, Atmos. Environ., 38, 5399–5409, 2004.
Domin´e, F. and Shepson, P. B.: Air-snow interactions and atmo-spheric chemistry, Science, 297, 1506–1510, 2002.
Doppenschmidt, A. and Butt, H. J.: Measuring the thickness of the liquid-like layer on ice surfaces with atomic force microscopy, Langmuir, 16, 6709–6714, 2000.
Dubowski, Y., Colussi, A. J., and Hoffmann, M. R.: Nitrogen diox-ide release in the 302 nm band photolysis of spray-frozen aque-ous nitrate solutions. Atmospheric implications,J. Phys. Chem. A., 105, 4928-4932, 2001.
Dubowski, Y., Colussi, A. J., Boxe, C., and Hoffmann, M. R.: Monotonic increase of nitrite yields in the photolysis of nitrate in ice and water between 238 and 294 K, J. Phys. Chem., 106, 6967–6971, 2002.
Faraday, M.: Lecture before the Royal Institution reported in the Athaneum, 640, 1850.
Gaffney, J. S., Marley, N. A., and Cunningham, M. M.: Measure-ment of the absorption constants for nitrate in water between 270 and 335 nm, Environ. Sci. Technol., 25, 207–209, 1992. Gong, S. L., Walmsley, J. L., Barrie, L. A., and Hopper, J. F.:
Mech-anisms for surface ozone depletion and recovery during Polar Sunrise, Atmos. Environ., 31(7), 969–981, 1997.
Grannas, A. M., Shepson, P. B., and Filley, T. R.: Photochemistry and nature of organic matter in Arctic and Antarctic snow, Global Biogeochem. Cycles, 18, GB1006, doi:10.1029/2003GB002133, 2004.
Hastings, M. G., Steig, E. J., and Sigman, D. M.: Seasonal varia-tions in N and O isotopes of nitrate in snow at Summit, Green-land: Implications for the study of nitrate in snow and ice cores, J. Geophys. Res., 109, D20306, doi:10.1029/2004JD004991, 2004.
Hoigne, J., Bader, H., Haag, W. R., and Staehelin, J.: Rate constants of reactions with organic and inorganic compounds in water-III. Inorganic compounds and radicals, Water Res., 19, 993–1004, 1985.
Honrath, R. E., Peterson, M. C., Guo, S., Dibb, J. E., Shepson, P. B., and Campbell, B.: Evidence of NOxproduction within or upon
ice particles in the Greenland snowpack, Geophys. Res. Lett., 26, 695–698 1999.
Honrath, R. E., Peterson, M. C., Dziobak, M. P., Dibb, J. E., Arse-nault, M. A., and Green, S. A.: Release of NOxfrom
sunlight-irradiated midlatitude snow, Geophys. Res. Lett., 26, 695–698, 2000a.
Honrath, R. E., Guo, S., Peterson, M. C., Dziobak, M. P., Dibb, J. E., and Arsenault, M. A.: Photochemical production of gas phase NOxfrom ice crystal NO−3, J. Geophys. Res., 105, 24 183–
24 190, 2000b.
Honrath, R. E., Lu, Y., Peterson, M. C., Dibb, J. E., Arsenault, M. A., Cullen, N. J., and. Steffen, K.: Vertical fluxes of NOx,
HONO, and HNO3above the snowpack at Summit, Greenland,
Atmos. Environ., 36, 2629–2640, 2002.
Jacobi, H.-W., Bales, R. C., Honrath, R. E., Peterson, M. C., Dibb, J. E., Swanson, A. L., and Albert, M. R.: Reactive trace gases mea-sured in the interstitial air of surface snow at Summit, Greenland, Atmos. Environ., 38, 1687–1697, 2004.
Jacobi, H.-W., Annor, T., and Quansah, E.: Investigation of the photochemical decomposition of nitrate, hydrogen peroxide, and formaldehyde in artificial snow, J. Photochem. Photobiol. A., 179, 330–338, 2006.
Jacobi, H.-W. and Hilker, B.: A mechanism for the photochemical transformation of nitrate in snow, J. Photochem. Photobiol. A, 185, 371–382, 2007.
Jaffe, D. A. and Zukowski, M. D.: Nitrate deposition to the Alaska snowpack, Atmos. Environ., 27A, 2935–2941, 1993.
Jones, A. E., Weller, R., Wolff, E. W., and Jacobi, H.-W.: Speci-ation and rate of photochemical NO and NO2production from
Antarctic snow, Geophys. Res. Lett., 27, 345–348, 2000. Jones, A. E., Wolff, E. W., Ames, D., Bauguitte, S. J.-B.,
Clemit-shaw, K. C., Fleming, Z., Mills, G. P., Saiz-Lopez, A., Salmon, R. A., Sturges, W. T., and Worton, D. R.: The multi-seasonal NOy budget in coastal Antarctica and its link with surface snow and ice core nitrate: results from the CHABLIS campaign, At-mos. Chem. Phys. Discuss., 7, 4127–4163, 2007,
http://www.atmos-chem-phys-discuss.net/7/4127/2007/. King, M. D., France, J. L., Fisher, F. N., and Beine, H. J.:
Measure-ment and modeling of UV radiation penetration and photolysis rates of nitrate and hydrogen peroxide in Antarctic sea ice: An estimate of the production rate of hydroxyl radicals in first-year sea ice, J. Photochem. Photobiol. A, 176, 39–49, 2005.
Legrand, M. and Mayewski, P.: Glaciochemistry of polar ice cores: a review, Rev. Geophys., 35, 219–243, 1997.
Landa, A., Wynblatt, P., Hakkinen, H., Barnett, R. N., and Land-man, U.: Equilibrium interphase interfaces and premelting of the Pb(110) surface, Phys. Rev. B, 51, 10 972–10 980, 1995. Lelieveld, J. and Crutzen, P. J.: The role of clouds in tropospheric
photochemistry, J. Atmos. Chem., 12, 229–267, 1991.
Li, S.-M.: Particulate and snow nitrite in the spring arctic tropo-sphere, Atmos. Environ., 27, 2959–2967, 1993.
Liao, W., Case, A. T., Mastromarino, J., Tan, D., and Dibb, J. E.: Observations of HONO by laser-induced fluorescence at the Sout Pole during ANTCI 2003, Geophys. Res. Lett., 33, L09810, doi:10.1029/2005GL025470, 2006.
Mack, J. and Bolton, J. R.: Photochemistry of nitrite and nitrate in aqueous solution: a review, J. Photochem. Photobiol. A, 128, 1–13, 1999.
Maria, H. J., McDonald, J. R., and McGlynn, S. P.: Electronic absorption spectrum of nitrate ion and boron trihalides, J. Am. Chem. Soc., 95, 1050–1056, 1973.
Mark, G., Korth, H.-G., Schuchmann, H.-P., and von Sonntag, C.: The photochemistry of aqueous nitrate ion revisited, J. Pho-tochem. Photobiol. A, 101, 89–103, 1996.
McCabe, J. R., Boxe, C. S., Colussi, A. J., Hoffmann, M. R., and Thiemens, M. H.: Oxygen isotopic fractionation in the photo-chemistry of nitrate in water and ice, J. Geophys. Res., 110, D15310, doi:10.1029/2004JD005484, 2005.
McNeill, V. F.: Studies of Heterogeneous Ice Chemistry Relevant to the Atmosphere, Ph.D. thesis, Massachusetts Institute of Tech-nology, 2005.
McNeill, V. F., Loerting, T., Geiger, F. M., Trout, B. L., and Molina, M. J.: Hydrogen chloride-induced surface disordering on ice, Proc. Natl. Acad. Sci. USA, 103, 9422–9427, 2006.
sunrise, J. Geophys. Res., 105, 15 131–15 145, 2000.
Molina, M. J.: The Probable Role of Stratospheric ‘Ice’ Clouds: Hetergeneous Chemistry of the ‘Ozone Hole’, in: The Chem-istry of the Atmosphere: The Impact of Global Change, edited by: Calvert, J. G., pp. 27–38, Blackwell Scientific Publications, Boston, 1994.
Mulvaney, R., Wagenback, D., and Wolff, E. W.: Postdeposi-tional change in snowpack nitrate from observation of year-round near-surface snow in coastal Antarctica, J. Geophys. Res., 103, 11 021–11 031, 1998.
Ohnesorge, R., Lowen, H., and Wagner, H.: Density-Functional theory of crystal fluid interfaces and surface melting, Phys. Rev. E, 50, 4801–4809, 1994.
Petrenko, V. F. and Whitworth, R. W.: Physics of Ice, Oxford Uni-versity Press, New York, 1999.
Pittenger, B., Fain, S. C., Cochran, M. J., Donev, J. M. K., Robert-son, B. E., Szuchmacher, A., and Overney, R. M.: Premelting at ice-solid interfaces studied via velocity-dependent indentation with force microscope tips, Phys. Rev. B, 63, 134 102, 2001. Qiu, R., Green, S. A., Honrath, R. E., Peterson, M. C., Lu, Y., and
Dziobak, M.: Measurements ofJNO−
3 in snow by nitrate-based
actinometry, Atmos. Environ., 36, 2563–2571, 2002.
Rothlisberger, R., Hutterli, M. A., Wolff, E. W., Mulvaney, R., Fis-cher, H., Bigler, M., Goto-Azuma, K., Hansson, M. E., Ruth, U., Siggaard-Andersen, M. L., and Steffensen, J. P.: Nitrate in Greenland and Antarctic ice cores: a detailed description of post-depositional processes, Ann. Glaciol., 35, 209–216, 2002. Sadtchenko, V. and Ewing, G. E.: Interfacial melting of thin ice
films: An infrared study, J. Chem. Phys., 116, 4686–4697, 2002. Saiz-Lopez, A., Plane, J. M. C., Mahajan, A. S., Anderson, P. S., Bauguitte, S. J.-B., Jones, A. E., Roscoe, H. K., Salmon, R. A., Bloss, W. J., Lee, J. D., and Heard, D. E.: On the vertical distri-bution of boundary layer halogens over coastal Antarctica: im-plications for O3, HOx, NOx, and the Hg lifetime, Atmos. Chem.
Phys., 8, 887–900, 2008,
http://www.atmos-chem-phys.net/8/887/2008/.
Schwartz, S. E. and White, W. H.: Solubility equilibria of the nitro-gen oxides and oxyacids in dilute aqueous solution, in: Advances in Environmental Science and Engineering, edited by: Pfafflin, J. R. and Ziegler, E. N., 4, 1–45, 1981.
Silvente, E. and Legrand, M.: A preliminary study of air-snow re-lationship for nitric acid in Greenland, in: Ice Core Studies of Global Biogeochemical Cycles, NATO ASI Ser., Ser. I, vol. 30, edited by: Delmas, R. J., Springer-Verlag, New York, 225–240, 1995.
Simpson, W. R., von Glasow, R., Riedel, K., Anderson, P., Botten-heim, J., Burrows, J., Carpenter, L. J., Frieß, Goodsite, M. E., Heard, D., Hutterli, M., Jacobi, H.-W., Kaleschke, L., Neff, B., Plane, J., Platt, U., Richter, A., Roscoe, H., Sander, R., Shepson, P., Sodeau, J., Steffen, A., Wagner T., and Wolff, E.: Halogens and their role in polar boundary-layer ozone depletion, Atmos. Chem. Phys., 7, 4375–4418, 2007,
http://www.atmos-chem-phys.net/7/4375/2007/.
Stottlemeyer, R. and Toczydlowski, D.: Pattern of solute movement from snow into an Upper Michigan stream, Can. J. Fish. Aquat. Sci., 47, 290–300, 1990.
Sumner, A. L. and Shepson, P. B.: Snowpack production of formaldehyde and its effect on the Arctic troposphere, Nature, 398, 230–233, 1999.
Thompson, A. M.: The effects of clouds on photolysis rates and ozone formation in the unpolluted troposphere, J. Geophys. Res.-Atmos., 89, 1341–1349, 1984.
Wagner, I. and Strehlow, H. Z.: Flash photolysis of nitrate ions in aqueous solutions, Phys. Chemie. Neue Folge, 123, 1–33, 1980. Warneck, P. and Wurzinger, C.: Product quantum yields for the 305-nm photodecomposition of NO−3 in aqueous solution, J. Phys. Chem., 92, 6278–6283, 1988.
Wettlaufer, J. S.: Impurity effects in the premelting of ice, Phys. Rev. Lett., 82, 2516–2519, 1999.
Yung, Y. L. and Demore, W. B.: Photochemistry of Planetary At-mospheres, Oxford University Press, 1999.
Zhou, X., Beine, H. J., Honrath, R. E., Fuentes, J. D., Simpson, W., Shepson, P. B., and Bottenheim, J. W.: Snowpack photochem-ical production of HONO: a major source of OH in the arctic boundary layer in springtime, Geophys. Res. Lett., 28, 4087– 4090, 2001.