Value Prediction
Zhiqiu Hu1, Zhiquan Wang2, Shizhong Xu1*
1Department of Botany and Plant Sciences, University of California Reverside, Reverside, California, United States of America,2Department of Agricultural Food and Nutritional Science, University of Alberta, Edmonton, Alberta, Canada
Abstract
We developed a marker based infinitesimal model for quantitative trait analysis. In contrast to the classical infinitesimal model, we now have new information about the segregation of every individual locus of the entire genome. Under this new model, we propose that the genetic effect of an individual locus is a function of the genome location (a continuous quantity). The overall genetic value of an individual is the weighted integral of the genetic effect function along the genome. Numerical integration is performed to find the integral, which requires partitioning the entire genome into a finite number of bins. Each bin may contain many markers. The integral is approximated by the weighted sum of all the bin effects. We now turn the problem of marker analysis into bin analysis so that the model dimension has decreased from a virtual infinity to a finite number of bins. This new approach can efficiently handle virtually unlimited number of markers without marker selection. The marker based infinitesimal model requires high linkage disequilibrium of all markers within a bin. For populations with low or no linkage disequilibrium, we develop an adaptive infinitesimal model. Both the original and the adaptive models are tested using simulated data as well as beef cattle data. The simulated data analysis shows that there is always an optimal number of bins at which the predictability of the bin model is much greater than the original marker analysis. Result of the beef cattle data analysis indicates that the bin model can increase the predictability from 10% (multiple marker analysis) to 33% (multiple bin analysis). The marker based infinitesimal model paves a way towards the solution of genetic mapping and genomic selection using the whole genome sequence data.
Citation: Hu Z, Wang Z, Xu S (2012) An Infinitesimal Model for Quantitative Trait Genomic Value Prediction. PLoS ONE 7(7): e41336. doi:10.1371/ journal.pone.0041336
Editor:Zhaoxia Yu, University of California, Irvine, United States of America
ReceivedMarch 15, 2012;AcceptedJune 20, 2012;PublishedJuly 18, 2012
Copyright:ß2012 Hu et al. This is an open-access article distributed under the terms of the Creative Commons Attribution License, which permits unrestricted use, distribution, and reproduction in any medium, provided the original author and source are credited.
Funding:The project was supported by the United States Department of Agriculture National Institute of Food and Agriculture Grant 2007-02784 to Dr. Xu, The Alberta Ingenuity Bio Solution Grant RES0008133 to Dr. Wang and The Alberta Livestock and Meat Agency/Alberta Agricultural Research Institute Grant G550000127 to Dr. Wang. The funders had no role in study design, data collection and analysis, decision to publish, or preparation of the manuscript.
Competing Interests:The authors have declared that no competing interests exist. * E-mail: [email protected]
Introduction
The infinitesimal model of quantitative traits has dominated quantitative genetics for over 70 years until the end of 1980’s when interval mapping of quantitative trait loci (QTL) was first introduced by Lander and Botstein [1]. The infinitesimal model states that a quantitative trait is controlled by an infinite number of loci and each locus has an infinitely small effect [2,3], the model is also called the polygenic model [4]. Under this model, the effect of each locus is unrecognizable and thus these loci must be studied collectively under the general framework of classical quantitative genetics [5]. Consider that all the small effect genes are linearly arranged in a genome, the infinitesimal model is essentially a continuous genome model. Prior to the genome era, it was impossible to directly validate the infinitesimal model other than using resemblance between relatives to estimate the collective contribution of all loci on the genome for a quantitative trait. With the advent of advanced molecular technology, DNA marker data are available and they have been used to identify major genes for some quantitative traits [6,7,8,9]. The major gene identification approach is based on a modified version of the infinitesimal model, called oligogenic model [10], which states that a quantitative trait is controlled by a few genes with large effects and many genes with small effects. In the context of linkage analysis, these genes are
called QTL. Using markers to detect QTL is called QTL mapping. QTL mapping may only detect genes with large and median sized effects. The small effect QTL may not be detected separately at all for the sample sizes affordable in a current experiment.
The high density SNP data provide a way to capture the polygene. Using a Bayesian approach, effects of the high density markers can be estimated jointly to predict the genomic values for a quantitative trait without performing marker selection. This approach is called genomic selection [11,12]. Simulation studies showed that genomic selection using markers alone can fit the model with an accuracy up to 85% [11]. The 85% accuracy is the correlation between the true genetic values and the predicted values of individuals in the next generation. True genetic values are only known in simulation studies. In real data analysis, the predictability of a model must be drawn from a cross validation study. The predictability obtained from cross validation and the goodness of model fit do not necessarily agree to each other. Starting from a small number of markers, they may both increase as the number of markers increases. Further increasing the number of markers may continue to increase the goodness of model fit but the predictability may fall down [13,14].
markers may be available for many species. No methods are available to estimate one million effects jointly in a single model. If we treat each marker as a QTL, the model is virtually an infinitesimal model. How to handle such a model with an infinite dimension remains a challenging problem. We will introduce a continuous genome model by replacing the summation of infinite terms by an integral and then used a numerical integration approach to calculate the integral. The numerical integration will be achieved via dividing the entire genome into many small intervals (also called bins). The bin effects are then subject to estimation, instead of the individual marker effects. Each bin may contain many markers and the bin effect represents the total effects of all markers within that bin. This special model dimension reduction approach has never been proposed before for genomic prediction.
We first present an infinitesimal model to handle populations initiated from line crossing experiments. Such populations represent the ones with high linkage disequilibrium. We then extend to model to handle populations with low or no linkage disequilibrium.
Materials and Methods
Concept of the Infinitesimal Model
Letyj be the observed phenotypic value for individual jin a population of size n. The linear model for a usual regression analysis is
yj~bzX p
k~1
Zjkckzej,Vj~1,:::,n ð1Þ
wherebis the intercept,ckis the effect of locusk,Zjkis a known genotypic indicator variable for individual j at locus k and ej*N(0,s2) is the residual error with an unknown variance s2.
The genotype indicator variableZjkfor locuskis defined as
Zjk~ z1
0
{1 8 > < > :
for
for for
A1A1 A1A2 A2A2
ð2Þ
whereA1A1,A1A2andA2A2are the three genotypes for locus k. Note that p is the number of loci included in the model. When p~?, the model becomes
yj~bzX ?
k~1
Zjkckzej,Vj~1,:::,n
ð3Þ
This is the infinitesimal model of quantitative trait [2]. The regression coefficientckcannot be estimated because (a) the model has an infinite size and (b) the model is ill-conditioned, e.g., high multicollinearity. Now let us replace k by the corresponding genome location of the locus, denoted byl, which is continuous and ranges from 0 to L where L is the genome size. The infinitesimal model may be replaced by
yj~bz ðL
0
Zj(l)c(l)dlzej,Vj~1,:::,n ð4Þ
whereZj(l)is known for genome saturated with markers andc(l) is the genetic effect expressed as an unknown function of the genome location. Our purpose is to estimatec(l)using the data, which include y~yj
and Z(l)~Zj(l)
. The parameters include b, s2 and c(l),Vl[(0,L). The estimation should be obtained by optimizing some well-defined criteria, such as minimizing the sum of squared differences
Q~X
n
j~1
yj{b{ ðL
0
Zj(l)c(l)dl
2
ð5Þ
or maximizing the log likelihood function
L(h)~{n 2ln (s
2){ 1 2s2
Xn j~1
yj{b{ ðL
0
Zj(l)c(l)dl
2
ð6Þ
The likelihood function is obtained based on the assumed normal distribution yj*N(mj,s2), where mj~bzÐ0LZj(l)c(l)dl is the expectation ofyj. The ultimate purpose of the infinitesimal model is to find the unknown functionc(l)so that we can use
mNew~bz ðL
0
ZNew(l)c(l)dl ð7Þ
to predict an unobservedyNew, where the subscript New means a new individual with knownZNew(l)but unknownyNew.
The infinitesimal model given in equation (3) is represented by the continuous genome model in equation (4). There is no explicit expression of the integral and thus numerical integration is required to approximate the integral. Let us divide the entire genome bymbins (a bin is also called an interval of the genome) indexed bykfor thekthbin. LetDkbe the size of bink, which may be the same for all bins or vary across different bins. The numerical approximation of the continuous genome model is
yj~bzX m
k~1 Z
Zj(lk)cc(lk)Dkzej ð8Þ
wherelkis the middle point position of thekthbin in the genome,
Z
Zj(lk)is the average value ofZjfor all markers covered by thekth bin,cc(lk)is the average effect of all QTL in that bin andDkis the size of this bin. Note thatZZj(lk)is a known quantity andcc(lk)Dk is unknown that is subject to estimation. Whenm??, the bin size
Dk?0 and the model becomes the exact continuous genome model. The unknown functioncc(lk) can be estimated from the data. The number of binsmdepends on the sample sizenand the level of linkage disequilibrium. A larger sample size allows a larger
m. High linkage disequilibrium can be dealt with a small number of bins. BecauseZZj(lk)is an average value of all markers within the bin, markers of the entire genome have been utilized. When the intervalDk covers a large number of markers,cc(lk) can be very small (not estimable). This is why the model is called the infinitesimal model.
Zjfor all markers in binkis
Zjk~ZZj(lk)~ 1 pk
Xpk h~1
Zj(h) ð9Þ
The total effect of all markers in the bin is
ck~cc(lk)pk~ Xpk h~1
c(h) ð10Þ
The working model formbins becomes
yj~bzX m
k~1
Zjkckzej ð11Þ
in which all parameters can be estimated provided thatmis not too large.
From model (10), we can see that the effect of binkis the sum of effects of all markers within that bin. Two assumptions are required for this infinitesimal model to work: (1) high linkage disequilibrium and (2) homogeneous effects of markers within a bin. For example, if the effects of individual markers are not in the same direction, positive and negative effects may be cancelled out each other, leading to a zero net effect for the bin. The first condition (high linkage disequilibrium) is satisfied in line crossing data analysis (QTL mapping), especially in F2, BC and DH populations. Recombinant inbred lines (RIL) usually have low linkage disequilibrium and thus application of the infinitesimal model to RIL is problematic. The second condition (homoge-neous effect) appears to be out of our control. However, we can choose bin sizes as small as a program can manage so that the chance of more than one markers having effects per bin is minimum. This will at least avoid cancellation of effects in opposite directions. If the number of QTL in the entire genome is not extremely large and the locations of these QTL are randomly distributed along the genome, a small bin containing more than two QTL may have a negligible probability, and thus the second condition may well be satisfied. Theoretical investigation of the infinitesimal model is provided in the next section. Although p can be infinitely large, the reduced model has a dimensionality of m. A model with a small number of effects can be handled by the ordinary least squares method. If mwn, a penalized regression
may be used, e.g., the Lasso method [16] or the Bayesian shrinkage method [12]. The idea of the proposed bin analysis is to reduce the model dimension from a virtually unlimited number of markers to a finite number of bins that can be managed easily using existing software packages.
Theory of the Infinitesimal Model
We now show the theoretical basis of the infinitesimal model and explain why this model requires the two assumptions (high linkage disequilibrium and homogenous effects within a bin). We now use an F2 population derived from the cross of two inbred lines as an example to demonstrate the theory. The genotype indicator variable for markerhwithin binkis defined as
Zj(h)~ z1
0
{1 8 > < > :
for for for
A1A1 A1A2 A2A2
ð12Þ
The average of the indicator variables for all the pk markers within binkis
Zjk~ 1 pk
Xpk h~1
Zj(h) ð13Þ
The variance ofZjkacross individuals determines the efficiency of the model. Letdhlbe the recombination fraction between locih andlwithin bink. The variance ofZj(h)is 1/2 and the covariance between Zj(h) and Zj(l) is (1{2dhk)=2. The variance of Zjk across individuals is
var(Zjk)~1 p2 k
Xpk h~1
varZj(h) z2X
pk
lwh
covZj(h),Zj(l)
( )
~1 p2 k
1 2pkz2|
1 2
Xpk lwh
(1{2dhl)
( )
~1 2
1 pkz
2 p2 k
Xpk lwh
(1{2dhl)
( )
ð14Þ
This variance will take a value between 0.5 and 0 corresponding topk~1andpk~?, respectively. Whenpk~1, the second term of the above equation will vanish and thusvar(Zjk)~1=2. The bin analysis becomes the individual marker analysis. When pk~?
and thepkmarkers do not overlap, thenvar(Zjk)~0. However, the reduction of the variance also depends on the pair-wise recombination fractions. If all the markers within the bin are jammed together (complete linkage), we have
Xpk hwl
(1{2dhl)~ 1
2pk(pk{1) ð15Þ which also leads to var(Zjk)~1=2. It is well known that the statistical power of a simple regression analysis depends on the variance of the independent variable. A larger variance of the independent variable leads to a higher power to detect the regression coefficient. In the proposed bin analysis, the indepen-dent variable isZjk and thus a largervar(Zjk) corresponds to a higher power for bin detection. The high linkage disequilibrium of markers within a bin will slow down the reduction of var(Zjk) from 1/2 to 0. This is why a high linkage disequilibrium within a bin is required for the infinitesimal model.
We now discuss why homogeneous effects of markers within a bin are required. Recall that we defined
cck~ 1
pk Xpk h~1
c(h) ð16Þ
marker effects within the bin are heterogeneous, especially when they are in opposite directions, the average value may end up being zero. Therefore, homogeneous marker effects within a bin are important; at least, they should not be in opposite directions. The exact genetic value of binkfor individualjis
ajk~ Xpk h~1
Zj(h)c(h)
~X
pk
h~1
Zj(h){ZjkzZjk
c(h){cckzcck
½
~ZjkcckpkzX pk
h~1
Zj(h){Zjk
c(h){cck
½
~ZjkckzX pk
h~1
Zj(h){Zjk
c(h){cck
½
ð17Þ
whereck~cckpk is the total genetic effect for bin k. The second term in the above equation is the sum of cross products ofZj(l) andc(l)in the bin, denoted byjjk
jjk~X pk
h~1
Zj(h){Zjk
c(h){cck
½ ð18Þ
The bin implemented infinitesimal model actually assumesjjk~0 and thusajk~Zjkck. Either one of the two assumption described early will make the ignorance safe. Under the assumption of high linkage disequilibrium,Zj(h)is pretty much a constant across the markers within the bin (not a function ofh) and thus
jjk&Zj(h){Zjk X pk
h~1
c(h){cck
½ ~
Zj(h){Zjk Xpk
h~1
c(h){pkcck " #
~0 ð19Þ
Under the assumption of homogeneous marker effects within a bin, the second condition,c(h)is pretty much the same across all markers within the bin. Therefore,
jjk&½c(h){cckX
pk
h~1
Zj(h){Zjk
~
c(h){cck
½ X
pk
h~1
Zj(h){pkZjk " #
~0 ð20Þ
The above discussion seems to be contradictory to the main purpose of the proposed bin analysis. The maximum power is obtained by choosing bins that contain only a single marker per bin. This would end up with an infinite number of bins and thus the model is not a working model. What we want here is to decide a finite number of bins that can be handled by a program, yet the power should not be lost too much: a new way to handle an infinite number of markers.
Concept of the Adaptive Infinitesimal Model
We now modify the infinitesimal model so that it can analyze infinite number of markers for populations in low or no linkage disequilibrium. Let us define a weighted average of Zj for all markers in binkby
Z
jk~ 1 pk
Xpk h~1
whZj(h)~ 1 pk
Xpk h~1
Z
j(h) ð21Þ
The weighted average effect for this bin is defined as
ck~cckpk~X pk
h~1 w{1
h c(h)~ Xpk h~1
c(h) ð22Þ
where wh is a weight assigned to marker h within bin k. The working model under the weighted strategy is
yj~bzX m
k~1
Zjkckzej ð23Þ
Since c
k is the effect of bin k and it is a quantity subject to estimation, we really do not needw{1
h . We only needwhto find the weighted average of the genotype indicator variableZ
jk. As a result, the weight can take zero as a legal value. The weighted model actually estimates the sum of the weighted effects of all markers within a bin. Our purpose here is to choose a weight so that the effects within the bin are homogenized. The weight should also be chosen from a preliminary analysis of the same data. With a proper selection of the weight, the two assumptions described in the unweighted infinitesimal model may be relaxed. There might be many different ways to choose the weight, but we proposed the following weight,
wh~ pk^bbh Ppk h~1
D^bbhD
ð24Þ
where^bbhis the least squares estimate of the hth marker in a single marker analysis. A special property of the weight is Ppk
h~1DwhD~pk. Because the weights depend on the least squares estimates of the marker effects and thus depend on the data, we call the modified model the adaptive infinitesimal model. The theory behind the adaptive infinitesimal model is given below.
Theory of the Adaptive Infinitesimal Model
We now show that the adaptive model can homogenize the marker effects within a bin so that it can handle populations in low or no linkage disequilibrium. Let us redefine the effect of binkfor individualjby
ajk~ Xpk h~1
Zj(h)c(h)~X pk
h~1
Zj(h)whw{1 h c(h)~
Xpk h~1
Zj(h)c(h) ð25Þ
wherewhis a weight for markerh,Z
j(h)~Zj(h)whis a weighted genotype indicator variable and c(h)~w{1
Zjk~ 1 pk
Xpk h~1
whZj(h)~1 pk
Xpk h~1
Zj(h) ð26Þ
as the weighted average indicator variable for bin k and
cck~ 1
pk Xpk h~1
w{1 h c(h)~
1 pk
Xpk h~1
c(h) ð27Þ
as the weighted average of all marker effects in bin k. The total effect of bin k isc
k~cckpk. Let us rewrite equation (25) as
ajk~ Xpk h~1
Zj(h){ZjkzZjk
h i
c(h){cckzcck
~ZjkcckpKzX pk
h~1
Zj(h){Zjk
h i
c(h){cck
~Zjkckzjjk
ð28Þ
where
jjk~X pk
h~1
Zj(h){Zjk
h i
c(h){cck
ð29Þ
Recall that the weight is,
wh~c{k1^bbh ð30Þ
where^bbhis the least squares estimate of the effect of thehth marker in a single marker analysis and
ck~ 1 pk
Xpk h~1
D^bbhD ð31Þ
is the average of the absolute values of the least squares estimates of all marker effects within bin k. This weight leads to Ppk
h~1DwhD~pk. The weighted effect for marker h in bin k is
c(h)~w{1 h c(h)~ck
c(h) ^ b
bh ð32Þ
If the least squares estimate ^bbhis proportional to c(h), the ratio c(h)=^bbh will be roughly a constant across all markers within the bin, i.e., c(h)=^bbh~r for all h~1,:::,pk. This is what we called homogenization of the effects. The homogenization will lead to
cck~ 1 pk
Xpk h~1
c(h)~ck pk
Xpk h~1
c(h) ^ b
bh~rck~ r pk
Xpk h~1
D^bbhD ð33Þ
Therefore, the bin effect defined byc
k is
c
k~cckpk~r Ppk h~1
D^bbhD ð34Þ
which is roughly proportional to the sum of the absolute values of all markers in bink. In addition, we can safely assume jjk&0
because of the homogenization. The adaptive working model with
mbins is now expressed as
yj~bzX m
k~1
Zjkckzej ð35Þ
Becauseckis either zero or positive, it is called the score of bink, which can be tested using any regression methods that can handle mbin effects.
Parameter Estimation and Cross Validation
When the number of bins is much smaller than the sample size, the effects of the bins can be estimated using the ordinary least squares method. However, the number of bins should be sufficiently large to achieve a high resolution for the purpose of QTL mapping. Therefore, the situation is often reversed in reality, i.e., the number of bins is often larger than the sample size. For example, if we choose a bin size of 1 cM, the entire human genome will be divided into over 3000 bins. To estimate 3000 effects in a single model using the ordinary least squares method, we need at least 3000 subjects just to make sure exist of a unique solution ofc. We may need a sample size of at least 5000 to get a reasonable good estimate ofc. If the number of bins is larger than the sample size, we need a penalized regression method, e.g., the Lasso method [16] and the Bayesian shrinkage method [12]. In this study, we chose the Lasso method implemented in the GLMNET/R package [17] for parameter estimation because of its fast computational speed.
Although the main purpose of the infinitesimal model is to predict the genomic value, the method can serve as a QTL mapping procedure. A QTL effect in a traditional mapping experiment is simply replaced by a bin effect in the current model. The GLMNET/R program does not provide such a test statistic and thus we calculated the test statistics from the output of the GLMNET/R program. We first calculated the estimation error for each bin effect using sk~pffiffiffiffiffiffiffiffiffiffiffiffiffiffiffivar(ck)
, where the variance is approximated by
var(ck)&
Xn j~1
Z2 jkz ^ s s2 ^ cc2 k !{1
^ s
s2~ ^cc2kss^2 ^
cc2 k
Pn
j~1Zjk2zss^2
ð36Þ
andss^2is the estimated residual error variance. The Lasso estimate often generate many zero estimated bin effects, for which the estimation errors are forced to be zero and thus tests are not performed for those zero effect bins. Given the estimated effect^cck and its errorsk, we are able to calculate the t-test statistic or its square, the F-test statistic. The F-test statistics is equivalent to the Wald test [18] when the numerator degree of freedom is one. Therefore, we can present the test statistic as the Wald test statistic,
Wk~ ^cc 2 k var(ck)~
^ cc2 k ^ s s2 Xn j~1
Zjk2z ^ s s2 ^ cc2 k !
~^cc 2 k ^ s s2 Xn j~1
Zjk2z1 ð37Þ
LODk~ Wk
2 ln (10) ð38Þ
As a convention in LOD score test, we may choose LOD = 3 as the criterion to declare statistical significance for each bin.
For purpose of genomic prediction, we used the mean squared error (MSE) obtained from the 10-fold cross validation [19] as a criterion to evaluate the predictabilities of the models under various bin sizes. In the first step of the cross validation, individuals of the population were random partitioned into 10 subsamples (parts). In the second step, we used nine parts of the sample to estimate parameters and used these estimated parameters to predict the phenotypes of individuals in the remaining part. The cross validation concluded after all parts have been predicted. The MSE [20] is defined as
MSE~1 n
Xn j~1
(yj{^yyj)2 ð39Þ
where
^ y
yj~^bbzX m
k~1
Zjk^cck ð40Þ
is the predicted value of individual j using parameters,^bb and^cc, that are estimated from samples excluding individual j. A small MSE means a better prediction. The MSE can be transformed into a quantity between 0 and 1, with 0 being no predictability and 1 being prefect prediction. This quantity is denoted byR2 and expressed by
R2~1{MSE SS ~1{
Pn j~1
(yj{^yyj)2
Pn j~1
(yj{yy)2
ð41Þ
which can be interpreted as the proportion of the phenotypic variance contributed by all the bins and thus markers of the entire genome.
Competing Methods of Genomic Selection
The adaptive infinitesimal model was compared to five competing models commonly used in genomic selection. The five competing models are: (1) empirical Bayes (eBayes) [21], (2) ridge regression [22], also called BayesA [11] or G-Blup [23,24], (3) BayesB-1 [11], (4) BayesB-2 [11] and (5) least absolute shrinkage and selection operator (Lasso) [16,17]. For the paper to be self-contained, we briefly describe these competing methods in this section. The eBayes method is a mixed model approach by treating intercept and co-variates as fixed effects and the marker effects as random effects with independent marker specific normal distributions, i.e., each marker effect has a normal distribution with mean zero and its own variance. It is called empirical Bayes because the marker effects are considered as parameters and their normal distributions considered as prior distributions. The method estimates the variance components first, independent of the marker effects, and then uses the estimated variance components as prior variances to generate Bayesian estimates of the marker effects. The G-Blup method is essentially the same as the eBayes
method except that all markers share the same normal distribution with mean zero and the same variance for all markers. The BayesB methods use a mixture prior distribution for each marker effect (ck),
ck~ppN(0,S1)z(1{p)N(0,S0) ð42Þ
whereS1is a variance either estimated from the data or set as a large constant andS0is a small positive number (a constant close to zero). The parameterpis the proportion of markers with effects large enough to be included in the model. Ifp is estimated from the data by using BayesCP [25], the BayesB method is called BayesB-1 in this study. If thepvalue is set as a constant, say 0.95, the BayesB method is called BayesB-2. The Lasso method can be interpreted as the eBayes method except that the marker specific variance s2
k is assigned an exponential prior distribution. The eBayes, the G-Blup and the Lasso methods are rule based methods in the sense that parameter estimation is obtained via an iteration process up to convergence. BayesB-1 and BayesB-2 are stochastic approaches via a Markov chain Monte Carlo (MCMC) sampling process. As a result, the BayesB methods are computationally very intensive.
The eBayes method was implemented via the SAS/IML program of Xu [21]. The Mixed Procedure in SAS (PROC MIXED) [26] was used to perform the G-Blup analysis. The BayesB and BayesCPmethods were implemented using the online tool GenSel provided by the BIGS project at Iowa State University (http://bigs.ansci.iastate.edu). The p value for the BayesB-1 method was obtained from the data by using BayesCP. For the BayesB-2 method,p~0:95 was used, which is suggested by the GenSel investigators as the default value.
Results
Simulated Data Analysis
Design I: Oligogenic model. In this experiment, we simulated several QTL in the genome with effects varying from small (explaining 1% of phenotypic variance) to large (explaining 15% of phenotypic variance). This experimental setup mimics the usual experimental setup for QTL mapping. In this experimental design, we simulated an F2population (high linkage disequilibri-um) with various sample sizes, 200, 300, 400, 500 and 1000. A single large chromosome was simulated with 2400 cM in length. We placed 120,001 SNP markers evenly on the genome with one marker per 0.02 cM. We simulated 20 main effect QTL with positions and effects depicted in Figure 1 (panel a). In addition, we generated 20 pair-wise interaction (epistatic) effects. Collectively, the 20 main effect QTL contributed 64.12 of the genetic variance and the 20 epistatic effects contributed 26.52 of the genetic variance. Since we only estimated the main effects, the epistatic effects would go to the residual (ignored). The proportion of phenotypic variance contributed by the 20 main effects was determined by
h2~ 64:12
These bin sizes corresponded to 50, 100, 250, 500, 1000, 2000 and 5000 markers per bin. The corresponding numbers of bins for the seven bin sizes were 2400, 1200, 480, 240, 120, 60 and 24. The largest model contained 2400 bins and the smallest model contained just 24 bins. The GLMNET/R [17] program was used to analyze the data. We chose the Lasso option of the program (L1 penalty) using a shrinkage factor (lambda value) ofexp ({2)that
was predetermined via cross-validation implemented by the GLMNET/R program.
We now present the result of the simulation experiment under sample sizen~500and heritabilityh2~0:58(corresponding to a pure environmental error variances2~20). The bin size ranged from 1 cM to 100 cM. The simulation experiment was replicated 100 times and the average estimated effects of the bins across the
Figure 1. True QTL effects and estimated bin effects for design I.The bin effect estimates were obtained from 100 replicated simulations. The
total number of markers was 120,001. The sample size wasn~500. The pure environmental error variance wass2~20. The 20 simulated QTL
collectively explained 0.581 of phenotypic variance. The three symbols represent the size of bin (Dk), the number of markers (model dimension)
replicates were represented. The true effects of the 20 QTL are given in Figure 1 (panel a). The estimated bin effects under different bin sizes are also given in Figure 1 (panels b – h). For bin size of 1 cM, corresponding to 2400 bins, the visual plots of the estimated bin effect against the genome location is given in Figure 1 (panel b). Compared with the true effects (panel a), the estimated bin effects showed similar pattern, but with seriously downward biases. Many small to median sized QTL were missed. As the bin size increased, the estimated bin effects visually matched the true QTL effects more closely until the bin size reached about 20 cM (panel f). Further increasing the bin size caused a reduction of the resolution of bin effect estimation. When the bin size reached 100 cM (panel h), some QTL were combined into the same bins and much of the resolution were lost. The estimated bin effects were larger than the simulated QTL effects due to the low resolution. The conclusion was that there appears to be an optimal bin size, at which both the estimated effects and the patterns (locations) of the bins closely match the simulated QTL effects. The close match was obtained visually at the moment. In the next paragraph, we will use the mean squared error (MSE) to evaluate the closeness of match under various bin sizes.
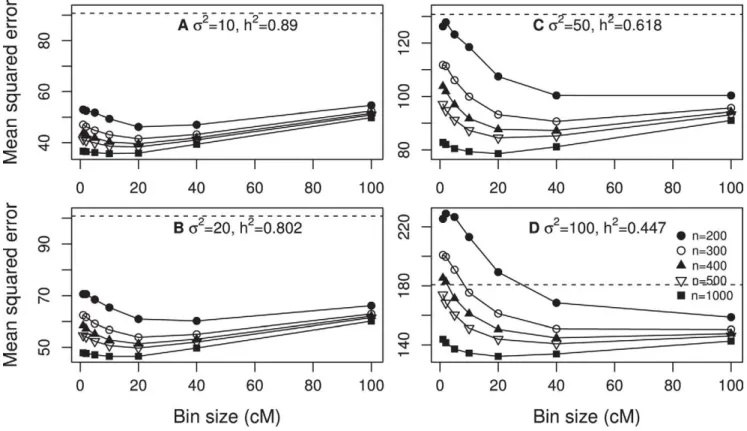
The best measurement of the predictability of a model is the MSE. We now examine the effect of bin size on the MSE of the infinitesimal model under various sample sizes and various levels of heritability. Figure 2 shows the MSE under four different levels of the residual error variance (and thus four different levels of heritability). When the residual error variance s2~10 and 20, corresponding to high heritabilities, the MSE curves all have a minimum value at around bin size of 10 cM to 20 cM. Whens2 increased to 50 (corresponding to low heritability), the minimum MSE shifted to bin size of 20 cM to 40 cM. When the sample size was 200, the MSE can be larger than the phenotypic variance by chance for smaller bins. Further increasings2to 100 caused the minimum MSE to shift further to the right. The conclusion from Figure 2 is that the size of bin influences the MSE and the pattern in the change of MSE also depends on the sample size and the heritability.
Design II: Clustered polygenic model. In this design, we split each of the 20 QTL given in Design I into 500 equal sized small QTL within65 cM of the original QTL position. In other words, each of the 20 QTL in Design I was replaced by a cluster of equal sized small QTL in Design II, which explains why the model is called clustered polygenic model. The total genetic variance contributed by all these small QTL was80:77. The heritability was calculated usingh2~80:77=(80:77zs2), which is a function of the residual error variance. Four levels of s2 was investigated, including 10, 20, 50 and 100, corresponding to four different levels ofh2, 0.89, 0.80, 0.62 and 0.45. Five different samples sizes were investigated, including 200, 300, 400, 500 and 1000. Figure 3 (panels a, b, c and d) shows the MSE plotted against the bin size. The general observation is that there seemed to be an optimal bin size that produced a minimum MSE. The optimal bin size shifted towards the right as the sample size increased. Exception of this general trend occurred when the sample size was small and the heritability was low (see panel d of Figure 3).
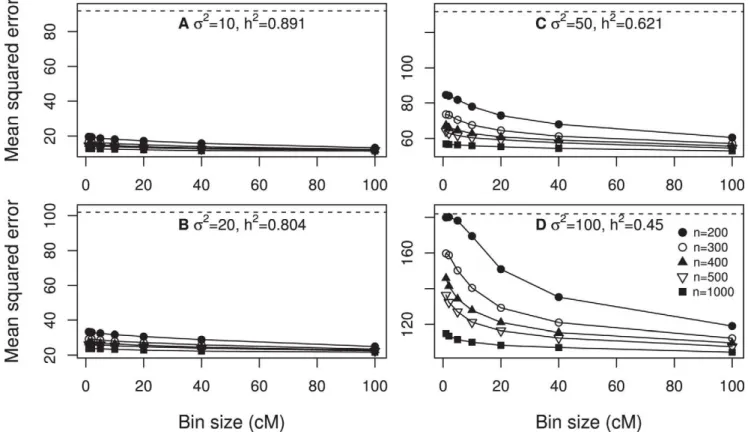
Design III: Polygenic model. Under this design, we simulated 1000 normally distributed QTL evenly placed on the genome. Each QTL explained 1/1000 of the total genetic variance (81.94). The total heritability was calculated using h2~81:94=(81:94zs2). The first 500 QTL had positive effects (located on the first half of the genome) and the second 500 QTL had negative effects (located on the second half of the genome). The heritability is a function of the residual error variance. Four
levels of s2 was investigated, including 10, 20, 50 and 100, corresponding to four different levels ofh2, 0.89, 0.80, 0.62 and 0.45. Five different samples sizes were investigated, including 200, 300, 400, 500 and 1000. Figure 4 (panels a, b, c and d) shows the MSE plotted against the bin size. The general observation is that the minimum MSE occurred when the bin size was 100 cM, which was the largest bin in the simulation experiment. When the heritability was high, the changes of MSE did not seem to be large across different sizes of bin. Further increasing the bin size actually increased the MSE (data not shown).
Design IV: Oligogenic model under low linkage disequilibrium. This design was similar to Design I except that we now expanded the genome from 2400 cM to 12,000,000 cM, which was 5000 times the genome size of Design I. In addition, we did not simulate epistatic effects in this design. The number of markers remained 120,001 but each marker interval covered 100 cM. The linkage disequilibrium level was very low or null. We expected that the infinitesimal model would break down due to the low linkage disequilibrium, but the adaptive infinitesimal would fix it. We simulatedn~500individuals under a residual error variance ofs2~20, corresponding toh2~0:80for all the 20 simulated QTL. The experiment was replicated 100 times. This time, we only presented the MSE to show the difference in predictability of the infinitesimal model and the adaptive infinitesimal model. Figure 5 shows the plot of the MSE against the bin size (log10cM) for both the infinitesimal model (filled circles) and the adaptive infinitesimal model (open circles). The infinitesimal model had all MSE above the actual phenotypic variance (89.71, indicated by the horizontal line in the middle of the figure). When the MSE is larger or equal to the phenotypic variance, it means no predictability. This simulation study did show the failure of the infinitesimal model under low linkage disequilibrium. We now evaluate the adaptive model under this low linkage disequilibrium design. The open circles represent the MSE under the adaptive infinitesimal model. All the MSE were smaller than the phenotypic variance, indicating that the adaptive model was effective for low linkage disequilibrium. The MSE actually decreased as the bin size increased. For the smallest bin (largest number of bins), the MSE was 48.53, corresponding to an R2 value of 0.459. As the bin size increased (number of bins decreased), the MSE progressively decreased until it reached 25.31, corresponding to anR2value of 0.718. The predictability was consistently improved as the bin size increased. However, we expect that further increasing the bin size would decrease the predictability.
Carcass Weight Analysis in Beef Cattle
removed from this analysis [30]. After the filtering with the above criterion, a total of 40,809 SNP remained for the analysis. A total of 86 animals with missing phenotypic observations were excluded from the analysis, resulting in 836 animals with carcass weight observations subject to the analysis. Co-factors considered in the analysis included sire breed, test group and the slaughter age. The systematic effects of the three co-factors were pre-adjusted via a linear model analysis and the residuals resulted from the linear model adjustment were subjected to the analysis.
The sample size wasn~836and the number of SNP markers wasp~40809. The sample size was sufficiently large to handle all the 40809 markers without using the bin analysis by Lasso method implemented in the GLMNET/R program. However, we still performed the bin analysis by defining various bin sizes with a log10bp unit. Phenotypic variance of the carcass trait after adjusting for the fixed effects was 670.36. The MSE under both the infinitesimal model (filled circles) and the adaptive infinitesimal model (open circles) are presented in Figure 6. First, all the MSE values were below the phenotypic variance (670.36, dashed line), meaning that both models were useful for prediction. Secondly, the MSE under the marker analysis (one marker per bin) was about 603.75 (the blue horizontal line), less than the phenotypic variance (the dashed line). The corresponding R2 value was R2~(670:36{603:75)=670:36~0:099, meaning that the 40809 markers collectively explained only about 9.9% of the phenotypic variance for the original marker analysis. Thirdly, as the bin size increased, the MSE of the infinitesimal model (filled circle) progressively increased until it reached the phenotypic variance (670.36), e.g., no predictability. This analysis showed that the beef
population had some level of linkage disequilibrium, but not high enough to make the unweighted bin analysis more effective. Finally, we evaluated the MSE of the adaptive infinitesimal model. In contrast to the infinitesimal model, the adaptive model showed a sharp decrease in MSE as the bin size increased. The MSE reached the minimum value of 447.10 when the bin size was about 5.9 log10bp. The corresponding R-square was R2~(670:36{447:10)=670:36~0:333, meaning that the bin effects collectively explained 33.3% of the phenotypic variance. As the bin size further increased, the MSE progressively increased. The bin analysis showed a significant improvement of the predictability of the model. The results of MSE and R-squares were obtained from the multiple regression models in the sense that all model effects were included in a single model. The software package used is GLMNET/R [17].
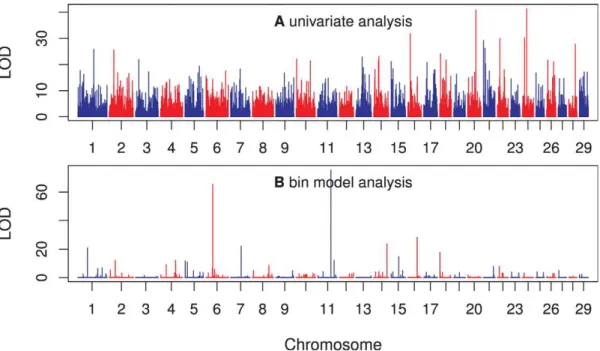
Finally, we showed the LOD scores of 3186 bins across the entire beef cattle genome in Figure 7 (panel b). The LOD scores were obtained from the adaptive infinitesimal model analysis with a bin size of 5.9log10bp(the optimal bin size). The top panel of Figure 7 gives the LOD scores for all the 40809 markers (not the bins) using a simple regression analysis (not from the Lasso method). The LOD scores of the two analyses do not agree with each other. The individual marker analysis showed that chromo-somes 20 and 24 each had a major marker with a very high LOD score. However, the bin model analysis did not show any evidence of major effects for these two chromosomes; instead, chromosomes 6 and 11, each had a major bin with LOD scores over 60. Note that the 40809 estimated marker effects (regression coefficients) corresponding to the LOD scores in this figure were only used to
Figure 2. Mean squared error expressed as a function of bin size for design I.The mean squared errors were obtained from 100 replicated
simulations. The overall proportion of the phenotypic variance contributed by the 20 simulated QTL was calculated using
h2~64:41=(64:41z26:53zs2). Each panel contains the result of five different sample sizes (
n). The phenotypic variance of the simulated trait is
find the weights for the adaptive infinitesimal model. They were not used in the MSE and R-square comparisons.
The infinitesimal model developed here is not a new statistical method. It generates new data (the bin data) and uses the new data to perform genomic selection. Any multiple regression methods can be used to perform the bin model analysis, as long as the model can handle the finite number of bins. We choose the Lasso method because it is computationally more efficient than all other competing methods. We have shown that the bin model is significantly better than the Lasso method that uses the original marker data. One reviewer stated that Lasso is not the standard method for genomic selection and other competing methods should be compared. Both reviewers suggested comparison be made between the bin model and other competing models. Following their suggestion, we compared our bin data analysis with the following competing methods, (1) eBayes, (2) G-Blup, (3) BayesB-1, (4) BayesB-2 and (5) Lasso. Brief descriptions of these methods are given in the methodology section.
Again, we used the MSE and the R-square values generated from the 10-fold cross validation analysis as criteria for the comparison. In all the five competing methods, the original 40809 SNP markers were included in the model. The MSE and the R-square values of all six models (five competing models plus the bin model) are given in Table 1. The MSE of all models are smaller than the phenotypic variance (670.36), meaning that all methods are effective to a certain degree. The bin model has the smallest MSE (447.10), followed by Lasso (603.75), G-Blup (632.46), eBayes (648.11), BayesB-1 (655.59) and BayesB-2 (658.19). The best competing model is Lasso. On contrary to the common belief that BayesB is the best method for genomic selection, this study
shows that BayesB is the worst one among these competing models. One may argue that the comparison is not fair because the bin model estimates bin effects rather than marker effects. If we use eBayes and BayesB methods for the bin data, they can be more efficient than the corresponding methods using the marker data. This is exactly the point we are trying to address: the bin model uses new data (bin data) and such a model has not been available yet before this study.
Discussion
Our analysis shows two bins with very large LOD scores. One bin is on chromosome 6 (bin 900, LOD score 65.48) and the other on chromosome 11 (bin 1652, LOD score 75.54). The first bin covers 19 SNP and the second bin covers 8 SNP. Information of the two bins and the SNP covered by the two bins are presented in Tables S1 and S2. Nine out of the 19 SNP covered by the bin on chromosome 6 have LOD scores .3.0, based on individual marker analyses. Some of the individual effects are positive while others are negative. None of the 8 SNP covered by the bin on chromosome 11 have LOD score .3.0, based on individual marker analyses. Without the bin analysis, none of the 8 SNP in the bin on chromosome 11 would be detected. However, the collective effect of the 8 SNP is very significant. This observation clearly demonstrates the power of the bin model.
We used the Lasso method to analyze the bin data. The other competing methods, except the G-BLUP method, can also be used to analyze the bin data. We anticipated that those methods would also improve the predictability if applied to the bin data compared to the analyses with the original SNP marker data.
Figure 3. Mean squared error expressed as a function of bin size for design II.The mean squared errors were obtained from 100 replicated
simulations. The overall proportion of the phenotypic variance contributed by all simulated QTL was calculated usingh2~80:77=(80:77zs2). Each
panel contains the result of five different sample sizes (n). The phenotypic variance of the simulated trait is indicated by the dashed horizontal line in
However, we do not expect these methods to be better than the Lasso method for the bin data based on the results of the SNP marker analysis. It will be an excellent topic for further
Figure 4. Mean squared error expressed as a function of bin size for design III.The mean squared errors were obtained from 100 replicated
simulations. The overall proportion of the phenotypic variance contributed by all simulated QTL was calculated usingh2~81:94=(81:94zs2). Each
panel contains the result of five different sample sizes (n). The phenotypic variance of the simulated trait is indicated by the dashed horizontal line in
each panel (each panel represents one of the four different scenarios). doi:10.1371/journal.pone.0041336.g004
Figure 5. Mean squared error for the simulated data under
design IV plotted against the bin size. Design IV was for
populations with low levels of linkage disequilibrium. The sample size of the simulated population wasn~500. The residual error variance was s2~20, corresponding toh2~0:777. The filled circles indicate the MSE
under the infinitesimal model while the open circles indicate the MSE under the adaptive infinitesimal model. The dashed horizontal line represents the phenotypic variance of the simulated trait (89.71). doi:10.1371/journal.pone.0041336.g005
Figure 6. Mean squared error for the carcass trait of beef cattle
plotted against the bin size.The filled circles indicate the MSE under
the infinitesimal model while the open circles indicate the MSE under the adaptive infinitesimal model. The dashed horizontal line represents the phenotypic variance of the simulated trait (670.36). The solid horizontal line along with the two dotted lines represents the MSE and the standard deviation of the MSE in the situation where the bin size was one (one marker per bin). The sample size wasn~836and the number of SNP markers wasp~40809. The bin size was defined as log10
bp. For example, the largest bin sizelog10bp~8:3means that the bin
size contains2|108base pairs.
investigation to compare all available genomic selection proce-dures under the bin model.
Prior to the genome era, quantitative genetics was dominated by the infinitesimal model [31]. Effects of individual genes were not recognizable and thus the collective effects of genes had to be studied using pedigree information. Genetically related individuals share a proportion of their genetic material and the shared proportion varies as the degrees of relationship varies, which provides the foundation for genetic parameter estimation and breeding value prediction. The best linear unbiased prediction (BLUP) technique [32] marked the peak of the classical quantitative genetics. By the end of 1980’s, the classical quantitative genetics reached its end in terms of methodology development, although it is still the basis for plant and animal breeding and the methods are still effective in modern breeding
programs. The advent of molecular technology provided an opportunity to revise the model and quantitative genetics faced a transition from classical quantitative genetics to modern quanti-tative genetics. This transition was mainly due to the landmark work in QTL mapping by Lander and Botstein [1]. The interval mapping procedure proposed by Lander and Botstein [1] was based on the oligogenic model in which a quantitative trait is controlled by a few major genes plus a collection of many genes with small effects. QTL mapping targets these major genes. Using this QTL mapping technology, people have detected many QTL for many quantitative traits [6,7,8,9]. This means that many quantitative traits are indeed guided by the oligogenic model. For the last two decades, numerous statistical methods have been developed for QTL mapping [33,34,35,36,37,38,39,40,41]. These methods mainly addressed the problem of missing genotypes in places where markers are not available (sparse map). With large sample sizes and the high density SNP markers currently available for many species, median and small sized QTL may be detectable now. The problem faced in interval mapping has been reversed; rather than inserting pseudo markers in an interval flanked by two markers, we now have to selectively delete markers because the marker density is too high to be handled by any advanced statistical methods. In the near future, high density SNP data and whole genome sequence data may be available for many species. Advanced statistical methods alone may not be sufficient to deal with the high density markers. The infinitesimal model proposed here serves as a technical preparation to handle such virtually infinite number of markers. Rather than estimating marker effects, we now try to estimate the collective effect of all markers in each interval (bin) of the genome. This requires a new model (the bin model) using currently available statistical methods, e.g., the Lasso method. This new model can take advantage of all markers in the genome and estimate collective effects of all genes regardless how small each gene effect is.
This study emphasizes genomic value prediction. However, the method also applies to QTL mapping. If a trait is indeed
Figure 7. LOD scores of individual markers and bins of the carcass trait of beef cattle.(a) The top panel shows the LOD scores of
individual marker analysis (simple regression analysis for each marker). (b) The panel at the bottom shows the LOD scores of the bins obtained from the adaptive infinitesimal model analysis with a bin size of 5.9log10bp(the optimal bin size). The number of bins under this optimal size was 3186. doi:10.1371/journal.pone.0041336.g007
Table 1.Mean squared error (MSE) and R-square values obtained from the 10-fold cross validation analysis for the beef carcass trait using five competing models and the proposed bin model.
Model MSE2 R-square
eBayes 648.11 0.0332
G-Blup 632.46 0.0565
BayesB-1 655.59 0.0220
BayesB-21 658.19 0.0182
Lasso 603.75 0.0994
Bin model 447.10 0.3330
1The Pi value for BayesB-2 is set at 0.95.
2The phenotypic variance of the beef carcass trait is 670.36. The magnitude of MSE value smaller than 670.36 indicates the effectiveness of the model predictability.
controlled by a few large effect QTL, we can detect the bins that contain these QTL (see Design I and Figure 1). Further research can be focused on these significant bins. Each of the significant bins may be further divided into many smaller bins and these small bins are subject to the same analysis. The process may be continued for several iterations until the effects are nailed down to particular markers. For example, the analysis of the carcass trait of beef cattle showed that chromosomes 6 and 11 each had a bin with a large LOD score. In the next step analysis, we may divide each of the two bins into several smaller bins. These smaller bins are then included in a single model for further analysis.
An obvious extension of the model is to investigate epistatic effects by including bin by bin interaction effects. The greatest challenge of epistatic analysis is the high dimension of the model [42]. Since the number of bins can be substantially smaller than the number of markers, including the bin by bin interaction effects can be easily implemented. A bin by bin interaction represents the total epistatic effects of all markers from one bin with all markers from another bin. If the first bin haspkmarkers and the second bin haspk0 markers, the bin by bin interaction effect is the sum of
all the pk|pk0 epistatic effects. This requires investigators to
calculate the average of pk|pk0 products of genotype indicator
variables for the two bins. This step of calculation is performed before the actual data analysis and thus will not significantly increase the computational burden.
The adaptive infinitesimal model was developed for populations with low and no linkage disequilibrium. An obvious question is whether it can also be applied to populations with high linkage disequilibrium. The answer is YES but we do not recommend it. We used the adaptive model to analyze simulated data from Design I, an F2population with high linkage disequilibrium. The results were not as good as the original model analyses in terms of predictability, although the predictability remains relatively high (data not shown). The reason was that the weights introduced for the adaptive model also introduced some noise (estimation errors for the weights). The population disequilibrium level should be lower than a certain level before the benefit appears for the adaptive model. Further study is required to find this level of linkage disequilibrium.
As stated in the main text, there are many different ways to choose the weight for the adaptive model. Consider the estimated effect for markerhin bink(denoted by^bbh), we proposed to use the simple regression analysis for each marker. An alternative method
may be the multiple regression analysis for all pk markers simultaneously within each bin. If pk is large, a penalized regression may be used. These alternative methods have not been investigated. Given the ^bbh‘s, how to use them to construct the weightwhis also worth of further investigation. A simple extension of our weight system may be.
wh~ ffiffiffiffiffi pk
p ^bbh
ffiffiffiffiffiffiffiffiffiffiffiffiffiffiffiffiffiffi Ppk
h~1^bb2h
q ð44Þ
One property of this weight isPpkh~1w2h~pk. Other properties of this weight system are unknown. A comparison of this weight with our weight will be an interesting project.
Finally, the continuous genome model presented in equation (4) is numerically integrated with a finite number of bins. Within each bin, the number of markers is assumed to be finite also. When the number of markers really approaches to infinity, the data becomes extremely large. Data storage will become a problem, not even mentioning computation. The solution is to use the actual breaking points (recombination events) of the genome as the data. The super saturated marker data will actually tell the breaking points. In fact, it is the actual breaking points that are informative for genetic analysis. Breaking point mapping is a new concept derived from the infinitesimal model. The idea of bin analysis [43,44] and breaking point mapping will open a new avenue to study unlimited volume of genomic data.
Supporting Information
Table S1 Information of two large effect bins on chromosomes 6 and 11.
(DOC)
Table S2 Information of SNP covered by the two large effect bins on chromosomes 6 and 11.
(DOC)
Author Contributions
Conceived and designed the experiments: SX. Performed the experiments: ZW. Analyzed the data: ZH. Contributed reagents/materials/analysis tools: ZW SX ZH. Wrote the paper: SX.
References
1. Lander ES, Botstein D (1989) Mapping mendelian factors underlying quantitative traits using RFLP linkage maps. Genetics 121: 185–199. 2. Bulmer MG (1971) The effect of selection on genetic variability. The American
Naturalist 105: 201–211.
3. Fisher RA (1918) The correlations between relatives on the supposition of Mendelian inheritance. Philosophical Transactions of the Royal Society of Edinburgh 52: 399–433.
4. Mather K (1941) Variation and selection of polygenic characters. Journal of Genetics 41: 159–193.
5. Falconer DS, Mackay TFC (1996) Introduction to quantitative genetics. New York, NY: Longman. 464 p.
6. Xue W, Xing Y, Weng X, Zhao Y, Tang W, et al. (2008) Natural variation in Ghd7is an important regulator of heading date and yield potential in rice. Nature Genetics 40: 761–767.
7. Van Laere A-S, Nguyen M, Braunschweig M, Nezer C, Collette C, et al. (2003) A regulatory mutation inIGF2causes a major QTL effect on muscle growth in the pig. Nature 425: 832–836.
8. Frary A, Nesbitt TC, Frary A, Grandillo S, Knaap E, et al. (2000) fw2. 2 : a quantitative trait locus key to the evolution of tomato fruit size. Science 289 85– 88.
9. Winter A, Kra¨mer W, Werner FAO, Kollers S, Kata S, et al. (2002) Association of a lysine-232/alanine polymorphism in a bovine gene encoding acyl-CoA:diacylglycerol acyltransferase (DGAT1) with variation at a quantitative
trait locus for milk fat content. Proceedings of the National Academy of Sciences of the United States of America 99: 9300–9305.
10. Morton NE, MacLean CJ (1974) Analysis of family resemblance. III. Complex degregation of quantitative traits. American Journal of Human Genetics 26: 489–503.
11. Meuwissen THE, Hayes BJ, Goddard ME (2001) Prediction of total genetic value using genome-wide dense marker maps. Genetics 157: 1819–1829. 12. Xu S (2003) Estimating polygenic effects using markers of the entire genome.
Genetics 163: 789–801.
13. Xu S, Hu Z (2010) Methods of plant breeding in the genome era. Genetics Research, Cambridge 92: 423–441.
14. Che X, Xu S (2010) Significance test and genome selection in Bayesian shrinkage analysis. International Journal of Plant Genomics 2010: 11 pages. doi: 10.1155/2010/893206.
15. Baye´s M, Gut IG (2011) Overview of genotyping. Molecular analysis and genome discovery: John Wiley & Sons, Ltd. 1–23.
16. Tibshirani R (1996) Regression shrinkage and selection via the Lasso. Journal of the Royal Statistical Society Series B-Methodological 58: 267–288.
17. Friedman J, Hastie T, Tibshirani R (2010) Regularization paths for generalized linear models via coordinate descent. Journal of statistical software 33: 1–22. 18. Wald A (1957) Tests of statistical hypotheses concerning several parameters
when the number of observations is large. Trans Amer Math Soc 54: 426–482. 19. Shao J (1993) Linear model selection by cross-validation. Journal of the
20. Allen DM (1971) Mean square error of prediction as a criterion for selecting variables. Technometrics 13: 469–475.
21. Xu S (2007) An empirical Bayes method for estimating epistatic effects of quantitative trait loci. Biometrics 63: 513–521.
22. Whittaker J, Thompson R, Denham M (2000) Marker-assisted selection using ridge regression. Annals of Human Genetics 63: 366–366.
23. VanRaden PM (2008) Efficient methods to compute genomic predictions. Journal of Dairy Science 91: 4414–4423.
24. Hayes BJ, Visscher PM, Goddard ME (2009) Increased accuracy of artificial selection by using the realized relationship matrix. Genetics Research 91: 47. 25. Habier D, Fernando RL, Kizilkaya K, Garrick DJ (2011) Extension of the
bayesian alphabet for genomic selection. BMC Bioinformatics 12: 186. 26. SAS Institute Inc. (2008) SAS/STATH 9.2 User’s Guide. Cary, NC: SAS
Institute Inc.
27. Nkrumah JD, Li C, Basarab JB, Guercio S, Meng Y, et al. (2004) Association of a single nucleotide polymorphism in the bovine leptin gene with feed intake, feed efficiency, growth, feeding behaviour, carcass quality and body composition. Canadian Journal of Animal Science 84: 211–219.
28. Nkrumah JD, Crews DH Jr, Basarab JA, Price MA, Okine EK, et al. (2007) Genetic and phenotypic relationships of feeding behavior and temperament with performance, feed efficiency, ultrasound, and carcass merit of beef cattle. Journal of Animal Science 85: 2382–2390.
29. Nkrumah JD, Sherman EL, Li C, Marques E, Crews DH Jr, et al. (2007) Primary genome scan to identify putative quantitative trait loci for feedlot growth rate, feed intake, and feed efficiency of beef cattle. Journal of Animal Science 85: 3170–3181.
30. The International HapMap Consortium (2005) A haplotype map of the human genome. Nature 437: 1299–1320.
31. Farrall M (2004) Quantitative genetic variation: a post-modern view. Human Molecular Genetics 13: R1–R7.
32. Henderson CR (1975) Best linear unbiased estimation and prediction under a selection model. Biometrics 31: 423–447.
33. Jansen RC (1993) Interval mapping of multiple quantitative trait loci. Genetics 135: 205–211.
34. Jansen RC, Stam P (1994) High resolution of quantitative traits into multiple loci via interval mapping. Genetics 136: 1447–1455.
35. Zeng ZB (1994) Precision mapping of quantitative trait loci. Genetics 136: 1457– 1468.
36. Satagopan JM, Yandell BS, Newton MA, Osborn TC (1996) A Bayesian approach to detect quantitative trait loci using Markov chain Monte Carlo. Genetics 144: 805–816.
37. Kao CH, Zeng ZB, Teasdale RD (1999) Multiple interval mapping for quantitative trait loci. Genetics 152: 1203–1216.
38. Sillanpa¨a¨ MJ, Arjas E (1998) Bayesian mapping of multiple quantitative trait loci from incomplete inbred line cross data. Genetics 148: 1373–1388.
39. Sen S´, Churchill GA (2001) A statistical framework for quantitative trait mapping. Genetics 159: 371–387.
40. Wang H, Zhang Y, Li X, Masinde GL, Mohan S, et al. (2005) Bayesian shrinkage estimation of quantitative trait loci parameters. Genetics 170: 465– 480.
41. Yi N (2004) A unified Markov Chain Monte Carlo framework for mapping multiple quantitative trait loci. Genetics 167: 967–975.
42. Jiang X, Barmada MM, Visweswaran S (2010) Identifying genetic interactions in genome-wide data using Bayesian networks. Genetic Epidemiology 34: 575–581. 43. Axenovich TI (1996) Prediction of linkage phase by parental phenotypes.
Genetic Epidemiology 13: 271–283.