OSD
6, 557–579, 2009Salinity-induced mixed and barrier layers Atlantic Ocean
M. Araujo et al.
Title Page
Abstract Introduction
Conclusions References
Tables Figures
◭ ◮
◭ ◮
Back Close
Full Screen / Esc
Printer-friendly Version
Interactive Discussion Ocean Sci. Discuss., 6, 557–579, 2009
www.ocean-sci-discuss.net/6/557/2009/
© Author(s) 2009. This work is distributed under the Creative Commons Attribution 3.0 License.
Ocean Science Discussions
Papers published inOcean Science Discussionsare under open-access review for the journalOcean Science
Salinity-induced mixed and barrier layers
in the southwestern tropical Atlantic
Ocean o
ff
the northeast of Brazil
M. Araujo1,*, C. Limongi1,*, J. Servain2,*, M. Silva1,*, and C. A. D. Lentini3,*
1
Departamento de Oceanografia, Universidade Federal de Pernambuco, Recife-PE, Brazil
2
Institut de Recherche pour le D ´eveloppement (IRD), UMR-182, Paris, France. Visiting Scientist at Fundac¸ ˜ao Cearense de Meteorologia e Recursos H´ıdricos (FUNCEME), Fortaleza, CE, Brazil
3
Departamento de F´ısica da Terra e do Meio Ambiente, Universidade Federal da Bahia, Salvador-BA, Brazil
*
GOAT – Grupo de Oceanografia Tropical – http://www.goat.fis.ufba.br
Received: 15 January 2009 – Accepted: 4 February 2009 – Published: 9 March 2009 Correspondence to: M. Araujo (moa@ufpe.br)
OSD
6, 557–579, 2009Salinity-induced mixed and barrier layers Atlantic Ocean
M. Araujo et al.
Title Page
Abstract Introduction
Conclusions References
Tables Figures
◭ ◮
◭ ◮
Back Close
Full Screen / Esc
Printer-friendly Version
Interactive Discussion Abstract
High resolution hydrographic observations of temperature and salinity were used to analyze the formation and distribution of isothermal (ZT), mixed (ZM) and barrier layers (BL) in a section of the southwestern Atlantic (0◦30′N–14◦00′S; 31◦24′–41◦48′W), ad-jacent to the northeastern Brazilian coast. Analyzed data consisted of 279 CTD casts 5
acquired during two cruises under the Brazilian REVIZEE Program, one in late austral winter (August–October 1995) and another in austral summer (January–April 1997). Results indicated that the intrusion of subtropical Salinity Maximum Waters (SMW) brought by the South Equatorial Current (SEC) from the subtropical region into the western tropical Atlantic boundary is the major process contributing to the seasonal 10
BL formation. During late austral winter, BL 5–90 m thickness (BLT) (median=15 m) was observed, butBLT >30 m was restricted to latitudes higher than 8◦S as a result of a combination of deep isothermal layers (ZT≥90 m) and shallow mixed layers, where the latter was created by the intrusion of salty waters between 8–12.3◦S. During aus-tral summer, shallow isothermal and mixed layers prevailed and the BL formation was 15
clearly driven by establishing a salt-induced pycnocline inside an isothermal layer. Ob-served BLT was less variable (5–70 m) and thicker (median=35 m). BLT≥30 m was observed not only in the southernmost part of the study area, as verified during late winter, but in the latitude range 2◦S–14◦S, where near surface salty waters were trans-ported westward by the SEC flow.
20
1 Introduction
The southwestern tropical Atlantic Ocean is an area of prime importance to global cli-mate change where oceanic signals from intra-seasonal to decadal scales must pass through (Dengler et al., 2004; Schott et al., 2005). Moreover, this region is subjected to cyclonic and anticyclonic gyres strongly controlled by surface winds (Stramma and 25
OSD
6, 557–579, 2009Salinity-induced mixed and barrier layers Atlantic Ocean
M. Araujo et al.
Title Page
Abstract Introduction
Conclusions References
Tables Figures
◭ ◮
◭ ◮
Back Close
Full Screen / Esc
Printer-friendly Version
Interactive Discussion southern pathway of the South Equatorial Current (sSEC) (Rodrigues et al., 2007) that
is partially at the birth site of several current systems that flows along the Brazilian coastline. The northern branch of the sSEC termination flows northward forming the North Brazilian Current-North Brazilian Under Current (NBC/NBUC) system. This pow-erful western boundary current contributes by feeding of the northward Guyana Current 5
(Bourl `es et al., 1999; Stramma et al., 2005) and the eastward North Equatorial Counter Current (NECC), as well as its associated complex retroflection system (Goes et al., 2005) and the eastward Equatorial Under Current (EUC). It is believed that NBC ac-counts for approximately one-third of the net warm-water flow transported across the equatorial tropical gyre boundary into the North Atlantic, compensating for the south-10
ward export of North Atlantic Deep Water (NADW) (Dengler et al., 2004; Schott et al., 2005). The southern branch of sSEC forms the Brazil Current (BC) that flows poleward along the Brazilian coast.
Offshore, the upper ocean density stratification is primarily controlled by temperature variations in the thermocline region. However, there is some evidence that salinity vari-15
ations can regulate the mixed layer depth (e.g., Sprintall and Tomczak, 1992). This is the case for the western equatorial Pacific where salinity controls the surface stratifica-tion, which defines the base of the mixed layer (e.g., Delcroix and McPhaden, 2002).
The occurrence of isohaline layer shallower than the isothermal layer in the tropical ocean has been studied since the Meteor research cruises in 1936 (Defant, 1961). The 20
barrier layer (BL), which is a layer between the halocline and the thermocline (Lukas and Lindstr ¨om, 1991), may isolate the upper isohaline layer from the cold thermocline waters, affecting the ocean heat budget and its exchanges with the atmosphere (Swen-son and Hansen, 1999; Pailler et al., 1999). When BL occurs, the energy transferred from the atmosphere to the ocean by the wind and the buoyancy forcing may be trapped 25
into the upper mixed layer limited by the salinity stratification, which is thinner and the-oretically more reactive than the one defined by the temperature mixed layer (Vialard and Delecluse, 1998; Mont ´egut et al., 2007).
OSD
6, 557–579, 2009Salinity-induced mixed and barrier layers Atlantic Ocean
M. Araujo et al.
Title Page
Abstract Introduction
Conclusions References
Tables Figures
◭ ◮
◭ ◮
Back Close
Full Screen / Esc
Printer-friendly Version
Interactive Discussion western equatorial Pacific. According to the theory, heavy precipitation in the western
portion of an ocean basin was initially taken as the main mechanism accounting for BL formation (e.g., Sprintall and Tomczak, 1992; Ando and McPhaden, 1997). Recent works show that the thick climatologically important BL in the western Pacific is due to the eastward fresh jets flowing over subducted salty waters (Vialard and Delecluse, 5
1998). Cronin and McPhaden (2002) analyzed BL responses to westerly wind gusts over the Tropical Atmosphere Ocean (TAO) array in the equatorial Pacific and dis-cussed the main mechanisms by which BL may form and spread. General charts of the seasonal variability of BL thickness (BLT) in tropical oceans were obtained using Levitus climatological data (Levitus, 1982) to determine the extent of the influence of 10
salinity in the depth of the mixed layer (Sprintall and Tomczak, 1992).
Mont ´egut et al. (2007) and Mignot et al. (2007) used instantaneous T/S profiles, including ARGO data, to construct global ocean climatology of monthly mean proper-ties of the BL phenomenon. These charts suggest that subduction of subtropical salty surface waters toward the equator during winter and their advection by the equato-15
rial current system might be the mechanism that forms the BL in the western tropical Atlantic. This hypothesis is partially supported by the presence of subsurface Salin-ity Maximum Waters (SMW) along the western Atlantic boundary (Pailler et al., 1999; Stramma et al., 2005; Silva et al., 2005). These authors argued that this salty water, which is formed in the South Atlantic subtropical gyre, is entrained into the region within 20
the NBUC that flows northwestward along the Brazilian continental slope.
The presence and the formation of salinity-induced barrier layers at the southwest-ern boundary of the tropical Atlantic is investigated here based on the analysis of 279 high resolution CTD vertical profiles obtained under the Brazilian REVIZEE Program. Although differences between the isohaline and isothermal depths have been reported 25
er-OSD
6, 557–579, 2009Salinity-induced mixed and barrier layers Atlantic Ocean
M. Araujo et al.
Title Page
Abstract Introduction
Conclusions References
Tables Figures
◭ ◮
◭ ◮
Back Close
Full Screen / Esc
Printer-friendly Version
Interactive Discussion ences in the southwestern tropical Atlantic offthe northeast of Brazil. In this way, this
paper is outlined as follows. Data and methods are delineated in Sect. 2 where the area of study is presented and the criteria used for determining the isothermal, mixed and barrier layers are described. Results are presented in Sect. 3 followed by summary and conclusions in Sect. 4.
5
2 Data and methodology
2.1 Study area and data collection
The area of study comprised a section of the western tropical Atlantic (0◦30′N– 14◦00′S; 31◦24′–41◦48′W), adjacent to the Brazilian NE coast (Fig. 1a). Hydrographic data were collected onboard the R/V Antares under the REVIZEE Program (Brazilian 10
Program for Assessing the Sustainable Potential of the Live Resources of the Exclusive Economic Zone). The dataset for this work comprised 279 continuous CTD casts, 146 obtained during the late austral winter, (2 August 1995–26 October 1995) and the 133 during the austral summer (20 January 1997–17 April 1997).
2.2 Criteria for determining isothermal, mixed and barrier layers 15
The criteria used for determining isothermal and mixed layers in the ocean requires the deviation of temperatureT (or density,σt) from its surface value to be smaller then a certain fixed valueT value (or density) (Brainerd and Gregg, 1995). Normally consid-ered surface values for evaluatingZT varies from 0.5
◦
C (Monterrey and Levitus, 1997) to 0.8◦C (Kara et al., 2000) depending on the used criteria. ZM is estimated as the 20
depth where density is equal to its sea surface value plus an increment∆σtequivalent to a desired net decrease in temperature. Spall (1991), e.g., uses∆σt=0.125σt(0) for determining the mixed layer depth, while Sprintall and Tomczak (1992) and Ohlmann et al. (1996) adopt ∆σt=0.5◦C (∂σt/∂T), where ∂σt/∂T is the coefficient of thermal expansion.
OSD
6, 557–579, 2009Salinity-induced mixed and barrier layers Atlantic Ocean
M. Araujo et al.
Title Page Abstract Introduction Conclusions References Tables Figures ◭ ◮ ◭ ◮ Back Close
Full Screen / Esc
Printer-friendly Version
Interactive Discussion The criteria used here is the same defined by Sprintall and Tomczak (1992), where
the isothermal and mixed layer depths (ZT andZM) are evaluated in terms of temper-ature and density steps−∆T=0.5◦C and∆σt=0.5◦C (∂σt/∂T) – from the sea surface temperature and density (T(0) andσt(0)) obtained from CTD vertical profiles:
ZT =z(T =T(0)−∆T) ZM =z
σt=σt(0)+∂σt ∂T ∆T
(1) 5
where ∂σt/∂T was calculated as a function of the surface temperature and salinity (Blanck, 1999). Since the SBE911plus CTD has two thermometers with an accuracy of about 0.001◦C, the error in computingZT for a∆T=0.5
◦
C is around 0.2% for a local
ZT. Barrier layer thickness (BLT) is calculated asBLT=ZM−ZT.
When density stratification is exclusively controlled by temperature, the isothermal 10
layer depth becomes equivalent to the mixed layer depth andBLT=0. A particular situ-ation happens when near surface distribution of salinity is anywhere sufficiently strong for inducing a pycnocline inside of the isothermal layer, orZM<ZT. In such case,BLT>0 and surface warm waters may be maintained isolated from cool thermocline waters.
As in Mont ´egut et al. (2007) and Mignot et al. (2007) works, an analysis of individual 15
T/Sprofile combined to a kriging interpolation (within a radius of 400-km with at least 5 grid points) is used to construct isothermal, mixed and BL layers charts.
3 Mixed and barrier layers in the southwestern tropical Atlantic
3.1 South Atlantic (SAW) and Salinity Maximum Waters (SMW)
Wilson et al. (1994) and Bourl `es et al. (1999) identified three different origins for the 20
OSD
6, 557–579, 2009Salinity-induced mixed and barrier layers Atlantic Ocean
M. Araujo et al.
Title Page
Abstract Introduction
Conclusions References
Tables Figures
◭ ◮
◭ ◮
Back Close
Full Screen / Esc
Printer-friendly Version
Interactive Discussion values and low O2 concentrations below the thermocline. The SAW, which exhibits
high salinity values above the thermocline and low salinity values and high oxygen concentrations below it relative to the NAW, is advected to the study region through subduction processes from subtropical areas by the southern branch of the SEC. The EAW reaches the area of interest via the southern edge of the NEC and the central and 5
northern branches of the SEC. This EAW is characterized by the lowest concentrations of oxygen and salinity around the thermocline when compared to the SAW.
The origin of the waters masses entering the area of study is identified usingT/S
diagrams of the easternmost boundary of the hydrographic stations (Fig. 1a). Particular attention is given to those areas where SMW cores are observed between the 24.5 10
and 26.25 isopycnals. Three distinct signatures are found in late winter and summer seasons: (i) EAW at 2◦–4◦S (Fig. 1b); (ii) EAW-SAW transitional zone at 4◦–8◦S (not shown here); and (iii) SAW for latitudes higher than 8◦S (Fig. 1c).
Vertical sections of salinity along this boundary (Fig. 2a, b) indicate a salinity max-imum around 120 m deep, a signature of subtropical underwaters that may be due to 15
the presence of SAW. Salinity maximum cores vary seasonally around the 24.5 isopy-cnal. In late austral winter of 1995 a maximum salinity core (≥36.5) is observed at the thermocline level (Fig. 2a) between the latitudes of 6◦ and 12.3◦S, and around 10◦S at the surface. In austral summer of 1997, a shallow core of maximum salinity (≥36.5) is found at the 7◦–14◦S latitude range, which is combined with persistent high salinity 20
values (≥36.0) in upper ocean layer (down to 80 m depth) at 2◦–10◦S (Fig. 2b). Ex-cepting for a single surface point around 4◦S, low latitude (≤6◦S) salty surface waters is not observed in 1995 late winter.
Salinity cores observed to the south of 6◦S (Fig. 2a, b) can only be due to the signa-ture of the SEC penetrating into the region from the south and transporting westward 25
OSD
6, 557–579, 2009Salinity-induced mixed and barrier layers Atlantic Ocean
M. Araujo et al.
Title Page
Abstract Introduction
Conclusions References
Tables Figures
◭ ◮
◭ ◮
Back Close
Full Screen / Esc
Printer-friendly Version
Interactive Discussion 3.2 Spatial distribution
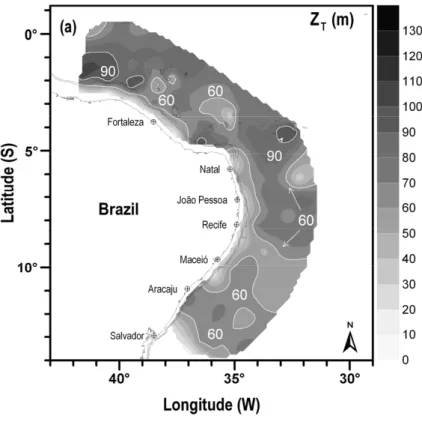
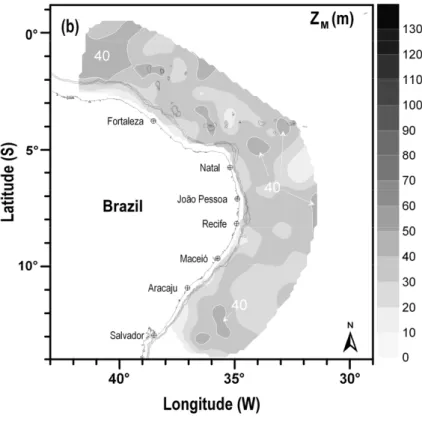
Spatial distribution of isothermal (ZT) and mixed layer (ZM) depths, and BL thickness (BLT) in the southwestern tropical Atlantic at late austral winter (August–October 95) and summer (January–April 97) are presented in Figs. 3 and 4, respectively.
During winter, aBLT of 5–90 m thick (median=15 m) is observed (for BLT≥5 m) at 5
83.5% of the CTD stations. The BL distribution during summer differed from that in late winter, showing a low thickness range of 5–70 m (median=35 m) and the highest frequency occurrence of 91.0% of the CTD stations. Shallow (5–50 m)ZM depths are observed during summer, while ZM depths reached 135 m during winter. Isothermal layers are deeper during winter (15–135 m) than summer (5–105 m).
10
At late winter high ZT values, limited by the 90 m depth isoline, is detected in two offshore subregions in the study domain: (i) at N-NE from 2◦–5◦S, and (ii) at S-SE from 7◦–12.3◦S (Fig. 3a). Still during this period a thick mixed layer (70–80 m) is also seen offshore between 2◦and 10◦S (Fig. 3b), resulting in thin barrier layer widely observed over the study area north of 8◦S (Fig. 3c). However, a thick BL prevails only south 15
of 8◦S, as a result of the combination between deep isothermal layer (Fig. 3a) and salt-induced (Fig. 2a) shallow mixed layer during late winter.
A qualitative similar distribution of isothermal depth can be found during the aus-tral summer (January–April 1997), with highZT values, limited by the 60 m contour, in the N (1◦–3◦S; 37◦–42◦W) – NE (4◦–9◦S; 32◦–35◦W) subareas, and from 9◦ to 14◦S 20
(Fig. 4a). However, what is really different from the late winter period is the computed values of mixed layer depths during summer, withZM not exceeding 50 m. These shal-low mixed layers are due to the near surface intrusion of salty SAW (Fig. 2b), which is transported westward from subtropical region by the intensified SEC flow verified during this period (Rodrigues et al., 2007). Consequently, high BL values during aus-25
OSD
6, 557–579, 2009Salinity-induced mixed and barrier layers Atlantic Ocean
M. Araujo et al.
Title Page
Abstract Introduction
Conclusions References
Tables Figures
◭ ◮
◭ ◮
Back Close
Full Screen / Esc
Printer-friendly Version
Interactive Discussion 4 Summary and conclusion
Climate is strongly linked to the upper tropical Atlantic dynamics and its exchange with the atmosphere. Thus, its prediction tends to improve with the increase on understand-ing the processes that governs the relative distribution of thermodynamic properties of the ocean. This paper focused on the isolation of warm surface waters from cool deep 5
waters by a salinity-induced mixed and barrier layers in the southwestern tropical At-lantic (0◦30′N–14◦00′S; 31◦24′W–41◦48′W). During late austral winter, a thick barrier layer (BL) of∼90 m deep was a common feature in the southernmost offshore portion of the area of study. During the austral summer shallow depths of isothermal, mixed and barrier layers were observed, although aBLT ≥30 m were observed all over the re-10
gion. In both case, the formation of BL seems to be also associated with the advection of salinity maximum waters formed in the region of the subtropical gyre and transported to the study area by the SEC and NBC/NBUC system (Stramma et al., 2005).
These results suggest that the mechanisms contributing to the seasonal variation of the mixed layer and the BL formation along the northeast Brazilian shelf are influenced 15
by the spatial and the seasonal variability of the upper ocean heat budget. It is specu-lated that this variability is mostly driven by ocean-atmosphere exchange and horizontal advection/vertical diffusion terms, and the westward transport of these salty subducted waters by the sSEC. Nonetheless, the above results highlight the importance of includ-ing the effects of salinity stratification when defining the mixed layer depth. Historically, 20
it was thought that the halocline significance in the surface layer was solely meaningful when dealing with higher latitude regions. However, our results suggest that the inclu-sion of salinity dynamics and its variability are also necessary for studying the mixed layer behavior in the southwestern tropical Atlantic. Depth variations in the mixed layer controlled by temperature distribution alone do not truly represent the depth of the 25
convective overturn due to turbulence which physically defines the extent of a mixed layer.
OSD
6, 557–579, 2009Salinity-induced mixed and barrier layers Atlantic Ocean
M. Araujo et al.
Title Page
Abstract Introduction
Conclusions References
Tables Figures
◭ ◮
◭ ◮
Back Close
Full Screen / Esc
Printer-friendly Version
Interactive Discussion assessed and the contribution of each mechanism that controls the thickness of the
BL should be scrutinized. These scientific tasks can only be achieved through the ac-quisition of long-term time series of in situ data (e.g., temperature, salinity and current velocity) derived from mooring arrays and ARGO drifters deployed at some key sites along the western tropical Atlantic combined with numerical modeling efforts.
5
Acknowledgements. We thank the scientific and crew members of the R/V Antares of the Brazilian Navy for their effort and dedication during the REVIZEE Program. This work was carried under the CNPq-IRD Project “Climate of the Tropical Atlantic and Impacts on the North-east” (CATIN), CNPq Process 492690/2004-9. The last author would like to thank the Brazilian National Council of Scientific and Technological Development under the scope of Project
BA-10
CANA (grant 478398/2006-9). Our thanks to F. S. Leite for her help on manuscript edition.
References
Ando, K. and McPhaden, M. J.: Variability of surface layer hydrography in the tropical Pacific Ocean, J. Geophys. Res., 102, 23063–23078, 1997.
Blanck, H. F.: Using TOPEX Satellite El-Ni ˜no altimetry data to introduce thermal expansion and
15
heat capacity concepts in chemistry courses, J. Chem. Educ., 76, 1635–1646, 1999. Bourl `es, B., Gouriou, Y., and Chuchla, R.: On the circulation in the upper layer of the western
equatorial Atlantic, J. Geophys. Res., 104, 21151–21170, 1999.
Brainerd, K. E. and Gregg, M. C.: Surface mixed and mixing layer depths, Deep-Sea Res. I, 42, 1521–1543, 1995.
20
Cronin, M. F. and McPhaden, M. J.: Barrier layer formation during westerly wind bursts, J. Geophys. Res., 107(C12), 2101–2112, 2002.
Defant, A.: Physical Oceanography, vol. 1, 729 pp., Pergamon Press, New York, 1961.
Delcroix, T. and McPhaden, M.: Interannual sea surface salinity and temperature changes in the western Pacific warm pool during 1992–2000, J. Geophys. Res., 107(C12), 8002,
25
doi:10.1029/2001JC000862, 2002.
Dengler, M., Schott, F. A., Eden, C., Brandt, P., Fischer, J., and Zantopp R. J.: Break-up of the Atlantic deep western boundary current into eddies at 8◦
OSD
6, 557–579, 2009Salinity-induced mixed and barrier layers Atlantic Ocean
M. Araujo et al.
Title Page Abstract Introduction Conclusions References Tables Figures ◭ ◮ ◭ ◮ Back Close
Full Screen / Esc
Printer-friendly Version
Interactive Discussion
Goes, M., Molinari, R., da Silveira, I., and Wainer I.: Retroflection of the North Brazil Current during February 2002, Deep-Sea Res., 52, 647–667, 2005.
Kara, A. B., Rochford, P. A., and Hurlburt, H. E.: Mixed layer depth variability and barrier layer formation over the north Pacific ocean, J. Geophys. Res., 105, 16783–16801, 2000.
Levitus, S.: Climatological Atlas of the World Ocean, NOAA Prof. Paper 13, US Govt. Printing
5
Office, 173 pp., 1982.
Lukas, R. and Lindstr ¨om, E.: The mixed layer of the western equatorial Pacific ocean, J. Geo-phys. Res. (Suppl.), 96, 3343–3357, 1991.
Lumpkin, R. and Garzoli, S. L.: Near-surface circulation in the tropical Atlantic ocean, Deep-Sea Res., 52, 495–518, 2005.
10
Mignot, J., Mont ´egut, C. B., Lazar, A., and Cravatte, S.: Control of salinity on the mixed layer depth in the world ocean: 2. Tropical areas, J. Geophys. Res., 112, C06011, doi:10.1029/2006JC003954, 2007.
Mont ´egut, C. B., Mignot, J., Lazar, A., and Cravatte, S.: Control of salinity on the mixed layer depth in the world ocean: 1. General description, J. Geophys. Res., 112, C06011,
15
doi:10.1029/2006JC003953, 2007.
Monterrey, G. and Levitus, S.: Seasonal variability of mixed layer depth for the world ocean, NOAA Atlas NESDIS 14, 96 pp., US Department of Commerce, Washington, D. C., 1997. Ohlmann, J. C., Siegel, D. A., and Gautier, C.: Ocean mixed layer depth heating and solar
penetration: A global analysis, J. Climate, 9, 2265–2280, 1996.
20
Pailler, K., Bourl `es, B., and Gouriou, Y.: The barrier layer in the western Atlantic ocean, Geo-phys. Res. Lett., 26, 2069–2072, 1999.
Rodrigues, R. R., Rothstein, L. M., and Wimbush, M.: Seasonal variability of the South Equa-torial Current bifurcation in the Atlantic ocean: A numerical study, J. Phys. Oceanogr., 37, 16–30, 2007.
25
Schott, F. A., Dengler, M., Zantropp, R., Stramma, L., Fischer, J., and Brandt, P.: The shallow and deep western boundary circulation of the South Atlantic at 5◦–11◦S, J. Phys. Oceanogr., 35, 2031–2053, 2005.
Silva, A. C., Araujo, M., Medeiros, C., Silva, M., and Bourl `es, B.: Seasonal changes in the mixed and barrier layers in the western equatorial Atlantic, Braz. J. Oceanogr., 53(3/4), 83–
30
98, 2005.
OSD
6, 557–579, 2009Salinity-induced mixed and barrier layers Atlantic Ocean
M. Araujo et al.
Title Page
Abstract Introduction
Conclusions References
Tables Figures
◭ ◮
◭ ◮
Back Close
Full Screen / Esc
Printer-friendly Version
Interactive Discussion
Sprintall, J. and Tomczak, M.: Evidences of the barrier layer in the surface layer of the tropics. J. Geophys. Res., 97, 7305–7316, 1992.
Stramma, L. and Schott, F.: The mean flow field of the tropical Atlantic ocean, Deep-Sea Res., 46B, 279–303, 1999.
Stramma, L., Rhein, M., Brandt, P., Dengler, Boning, C., and Walter. M.: Upper ocean
circu-5
lation in the western tropical Atlantic in boreal fall 2000, Deep-Sea Res. I, 52, 221–240, 2005.
Swenson, M. S. and Hansen. D. V.: Tropical Pacific ocean mixed layer heat budget: The Pacific cold tongue, J. Phys. Oceanogr., 29, 69–81, 1999.
Vialard, J. and Delecluse, P.: An OGCM study for TOGA decade. Part 2: Barrier layer formation
10
and variability, J. Phys. Oceanogr., 28, 1089–1106, 1998.
OSD
6, 557–579, 2009Salinity-induced mixed and barrier layers Atlantic Ocean
M. Araujo et al.
Title Page
Abstract Introduction
Conclusions References
Tables Figures
◭ ◮
◭ ◮
Back Close
Full Screen / Esc
Printer-friendly Version
Interactive Discussion
OSD
6, 557–579, 2009Salinity-induced mixed and barrier layers Atlantic Ocean
M. Araujo et al.
Title Page
Abstract Introduction
Conclusions References
Tables Figures
◭ ◮
◭ ◮
Back Close
Full Screen / Esc
Printer-friendly Version
Interactive Discussion
Fig. 1b.TypicalT/Sdiagram for the easternmost REVIZEE stations located between 2◦
S and 4◦
OSD
6, 557–579, 2009Salinity-induced mixed and barrier layers Atlantic Ocean
M. Araujo et al.
Title Page
Abstract Introduction
Conclusions References
Tables Figures
◭ ◮
◭ ◮
Back Close
Full Screen / Esc
Printer-friendly Version
Interactive Discussion
OSD
6, 557–579, 2009Salinity-induced mixed and barrier layers Atlantic Ocean
M. Araujo et al.
Title Page
Abstract Introduction
Conclusions References
Tables Figures
◭ ◮
◭ ◮
Back Close
Full Screen / Esc
Printer-friendly Version
Interactive Discussion
OSD
6, 557–579, 2009Salinity-induced mixed and barrier layers Atlantic Ocean
M. Araujo et al.
Title Page
Abstract Introduction
Conclusions References
Tables Figures
◭ ◮
◭ ◮
Back Close
Full Screen / Esc
Printer-friendly Version
Interactive Discussion
OSD
6, 557–579, 2009Salinity-induced mixed and barrier layers Atlantic Ocean
M. Araujo et al.
Title Page
Abstract Introduction
Conclusions References
Tables Figures
◭ ◮
◭ ◮
Back Close
Full Screen / Esc
Printer-friendly Version
Interactive Discussion
OSD
6, 557–579, 2009Salinity-induced mixed and barrier layers Atlantic Ocean
M. Araujo et al.
Title Page
Abstract Introduction
Conclusions References
Tables Figures
◭ ◮
◭ ◮
Back Close
Full Screen / Esc
Printer-friendly Version
Interactive Discussion
OSD
6, 557–579, 2009Salinity-induced mixed and barrier layers Atlantic Ocean
M. Araujo et al.
Title Page
Abstract Introduction
Conclusions References
Tables Figures
◭ ◮
◭ ◮
Back Close
Full Screen / Esc
Printer-friendly Version
Interactive Discussion
OSD
6, 557–579, 2009Salinity-induced mixed and barrier layers Atlantic Ocean
M. Araujo et al.
Title Page
Abstract Introduction
Conclusions References
Tables Figures
◭ ◮
◭ ◮
Back Close
Full Screen / Esc
Printer-friendly Version
Interactive Discussion
OSD
6, 557–579, 2009Salinity-induced mixed and barrier layers Atlantic Ocean
M. Araujo et al.
Title Page
Abstract Introduction
Conclusions References
Tables Figures
◭ ◮
◭ ◮
Back Close
Full Screen / Esc
Printer-friendly Version
Interactive Discussion
OSD
6, 557–579, 2009Salinity-induced mixed and barrier layers Atlantic Ocean
M. Araujo et al.
Title Page
Abstract Introduction
Conclusions References
Tables Figures
◭ ◮
◭ ◮
Back Close
Full Screen / Esc
Printer-friendly Version
Interactive Discussion