ACPD
11, 21363–21427, 2011Complex refractive indices of Saharan
dust samples
R. Wagner et al.
Title Page
Abstract Introduction
Conclusions References
Tables Figures
◭ ◮
◭ ◮
Back Close
Full Screen / Esc
Printer-friendly Version Interactive Discussion
Discussion
P
a
per
|
Dis
cussion
P
a
per
|
Discussion
P
a
per
|
Discussio
n
P
a
per
|
Atmos. Chem. Phys. Discuss., 11, 21363–21427, 2011 www.atmos-chem-phys-discuss.net/11/21363/2011/ doi:10.5194/acpd-11-21363-2011
© Author(s) 2011. CC Attribution 3.0 License.
Atmospheric Chemistry and Physics Discussions
This discussion paper is/has been under review for the journal Atmospheric Chemistry and Physics (ACP). Please refer to the corresponding final paper in ACP if available.
Complex refractive indices of Saharan
dust samples at visible and near UV
wavelengths: a laboratory study
R. Wagner1, T. Ajtai2, K. Kandler3, K. Lieke3, C. Linke1, T. M ¨uller4, M. Schnaiter1, and M. Vragel1
1
Karlsruhe Institute of Technology, Institute for Meteorology and Climate Research, P.O. Box 3640, 76021 Karlsruhe, Germany
2
University of Szeged, Department of Optics and Quantum Electronics, D ´om t ´er 9, 6720 Szeged, Hungary
3
Darmstadt University of Technology, Institute of Applied Geosciences, Schnittspahnstr. 9, 64287 Darmstadt, Germany
4
Leibniz Institute for Tropospheric Research, Permoserstr. 15, 04318 Leipzig, Germany
Received: 26 May 2011 – Accepted: 23 July 2011 – Published: 28 July 2011
Correspondence to: R. Wagner ([email protected])
ACPD
11, 21363–21427, 2011Complex refractive indices of Saharan
dust samples
R. Wagner et al.
Title Page
Abstract Introduction
Conclusions References
Tables Figures
◭ ◮
◭ ◮
Back Close
Full Screen / Esc
Printer-friendly Version Interactive Discussion
Discussion
P
a
per
|
Dis
cussion
P
a
per
|
Discussion
P
a
per
|
Discussio
n
P
a
per
Abstract
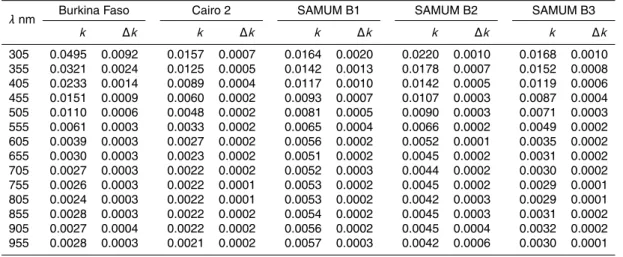
We have retrieved the wavelength-dependent imaginary parts of the complex refractive index for five different Saharan dust aerosol particles of variable mineralogical compo-sition at wavelengths between 305 and 955 nm. The dust particles were generated by re-dispersing soil samples into a laboratory aerosol chamber, typically yielding
par-5
ticle sizes with mean diameters ranging from 0.3 to 0.4 µm and maximum diameters from 2 to 4 µm. The extinction and absorption coefficients as well as the number size distribution of the dust particles were simultaneously measured by various established techniques. An inversion scheme based on a spheroidal dust model was employed to deduce the refractive indices. The retrieved imaginary parts of the complex refractive
10
index were in the range from 0.003 to 0.005, 0.005 to 0.011, and 0.016 to 0.050 at the wavelengths 955, 505, and 305 nm. The hematite content of the dust particles was determined by electron-microscopical single particle analysis. Hematite volume frac-tions in the range from 1.1 to 2.7 % were found for the different dusts, a range typical for atmospheric mineral dust. We have performed a sensitivity study to assess how
15
accurately the retrieved imaginary refractive indices could be reproduced by calcula-tions with mixing rule approximacalcula-tions using the experimentally determined hematite contents as input.
1 Introduction
This contribution builds on our previous aerosol chamber study on the optical properties
20
and mineralogical composition of different Saharan mineral dust samples (Linke et al., 2006). In the recent work, we have determined wavelength-dependent mass specific extinction, scattering, and absorption cross sections in the UV/VIS spectral region for airborne Saharan dust samples from different geographic locations and have related the deduced single scattering albedos to the iron oxide content of the samples. Such
25
ACPD
11, 21363–21427, 2011Complex refractive indices of Saharan
dust samples
R. Wagner et al.
Title Page
Abstract Introduction
Conclusions References
Tables Figures
◭ ◮
◭ ◮
Back Close
Full Screen / Esc
Printer-friendly Version Interactive Discussion
Discussion
P
a
per
|
Dis
cussion
P
a
per
|
Discussion
P
a
per
|
Discussio
n
P
a
per
|
The focus on iron oxides like hematite and goethite is related to their large absorption potential at visible and near UV wavelengths (Alfaro et al., 2004; Balkanski et al., 2007; Kandler et al., 2009; Lafon et al., 2004, 2006; Sokolik and Toon, 1999).
For the analysis of our present aerosol chamber experiments on the optical prop-erties of re-suspended mineral dust samples, we have extended our data evaluation
5
procedure in order to deduce the complex refractive indices of the dust aerosol parti-cles from our optical measurements. The most recent effort to derive these basic input parameters for the calculation of the single scattering properties of dust aerosols was in the context of the Saharan Mineral Dust Experiments (SAMUM-1 and SAMUM-2) (M ¨uller et al., 2010, 2011). Whereas the SAMUM-1 experiment took place in a source
10
region of mineral dust in southern Morocco, the dust aerosol probed during SAMUM-2 was transported over long distances to the Cape Verde Islands. For a particular mea-surement day of SAMUM-1, M ¨uller et al. (2010) have compared different techniques to derive the complex refractive indices of the observed dust plume. Firstly, a spheroidal dust model was used to deduce the complex refractive indices from Sun photometer
15
observations with AERONET (Aerosol Robotic Network) (Dubovik et al., 2002b, 2006). Secondly, the results from airborne in situ measurements of the particle size distri-butions and the aerosol absorption coefficients by a three-wavelength Particle Soot Absorption Photometer (PSAP) were introduced into a Mie theory based data anal-ysis scheme to infer the optical constants of the dust aerosol (Petzold et al., 2009).
20
Thirdly, the imaginary part of the complex refractive index was obtained from another inversion scheme based on Mie scattering calculations using ground-based record-ings of the particle number size distributions and the aerosol absorption coefficients by the Spectral Optical Absorption Photometer (SOAP) in the wavelength range from 300 to 800 nm as input data (M ¨uller et al., 2009). Finally, the chemical composition of
25
ACPD
11, 21363–21427, 2011Complex refractive indices of Saharan
dust samples
R. Wagner et al.
Title Page
Abstract Introduction
Conclusions References
Tables Figures
◭ ◮
◭ ◮
Back Close
Full Screen / Esc
Printer-friendly Version Interactive Discussion
Discussion
P
a
per
|
Dis
cussion
P
a
per
|
Discussion
P
a
per
|
Discussio
n
P
a
per
rule using tabulated refractive indices of the model substances (Kandler et al., 2009 and references therein).
In Fig. 5 of M ¨uller et al. (2010), the results for the real and imaginary part of the complex refractive index derived from the different techniques are compared. Although partly showing a reasonable agreement, as e.g. the spectra of the imaginary part
de-5
rived from AERONET, PSAP, and SOAP, there still remain striking differences such as the entirely different wavelength dependence of the spectrum of the imaginary part retrieved from the single particle mineralogical analysis. M ¨uller et al. (2010) have speculated that this might be due to the fact that the latter technique is unable to resolve potential amounts of soot and therefore only represents the pure dust
con-10
tribution whereas the other measurements are sensitive to the total particle mixture. After applying a soot correction to the SOAP recordings (M ¨uller et al., 2009), these data indeed show better agreement with the results from the mineralogical single parti-cle analysis but are also associated with large uncertainty bars. Notwithstanding these recent advances from field measurements, we still consider it an urgent need to provide
15
additional reliable data sets of complex refractive indices for dust aerosols of varying mineralogical composition, as also recently emphasised by Otto et al. (2009). Specif-ically addressing the absorption potential of mineral dust, we have selected for our present study dust samples with variable iron oxide content. Thereby, we want to bet-ter assess the variability of the spectrum of the imaginary part of the complex refractive
20
index for hematite and/or goethite contents that are typical of desert dust aerosol par-ticles. The well-characterised and controlled conditions of our laboratory experiments will help to minimise the uncertainties that are associated with the retrieved data sets.
As a guide for the reader, we briefly summarise our basic experimental approach. Five different Saharan dust aerosol particles were generated and added to a
labo-25
ACPD
11, 21363–21427, 2011Complex refractive indices of Saharan
dust samples
R. Wagner et al.
Title Page
Abstract Introduction
Conclusions References
Tables Figures
◭ ◮
◭ ◮
Back Close
Full Screen / Esc
Printer-friendly Version Interactive Discussion
Discussion
P
a
per
|
Dis
cussion
P
a
per
|
Discussion
P
a
per
|
Discussio
n
P
a
per
|
inversion scheme based on a spheroidal dust model was then used to retrieve the com-plex refractive indices from the optical measurements with the simultaneously recorded aerosol number size distributions as the required input data. Initially, we aimed at in-dependently retrieving both the real and imaginary part of the complex refractive index from the extinction and absorption measurements. Our analysis, however, has shown
5
that unique retrieval results for both quantities could not be obtained over the entire wavelength range. We will demonstrate that towards the UV spectral range, the value for the real part of the complex refractive index is not constrained by simultaneous ex-tinction and absorption measurements for the particle size range covered in our experi-ments. We have therefore prescribed the value of the real part of the complex refractive
10
index. The recorded extinction spectrum was then redundant in the actual retrieval but proved to be useful for adjusting the measured aerosol number size distribution, i.e., the latter was optimised until obtaining best agreement between the measured and the computed extinction spectrum. The modified aerosol number size distribution was then used as input to derive the spectrum of the imaginary part of the complex refractive
in-15
dex from the wavelength-resolved absorption measurements.
Our findings are presented in the following manner. In Sect. 2, we describe the set-up of our aerosol chamber experiments, including generation and characterisation of the dust aerosol particles with respect to their number concentration, size, and optical properties. Details of the employed desert dust samples are summarised in Sect. 3,
20
including their origin, elemental and mineralogical composition from bulk analyses us-ing X-ray Fluorescence and X-ray Diffraction, as well as selected results from single particle analyses with scanning and transmission electron microscopy. In Sect. 4, we address the concept of the inversion scheme to retrieve the complex refractive indices from the optical measurements. The retrieved data sets for the five investigated probes
25
ACPD
11, 21363–21427, 2011Complex refractive indices of Saharan
dust samples
R. Wagner et al.
Title Page
Abstract Introduction
Conclusions References
Tables Figures
◭ ◮
◭ ◮
Back Close
Full Screen / Esc
Printer-friendly Version Interactive Discussion
Discussion
P
a
per
|
Dis
cussion
P
a
per
|
Discussion
P
a
per
|
Discussio
n
P
a
per
2 Experimental
2.1 Set-up of the aerosol chamber experiments, aerosol generation and
characterisation
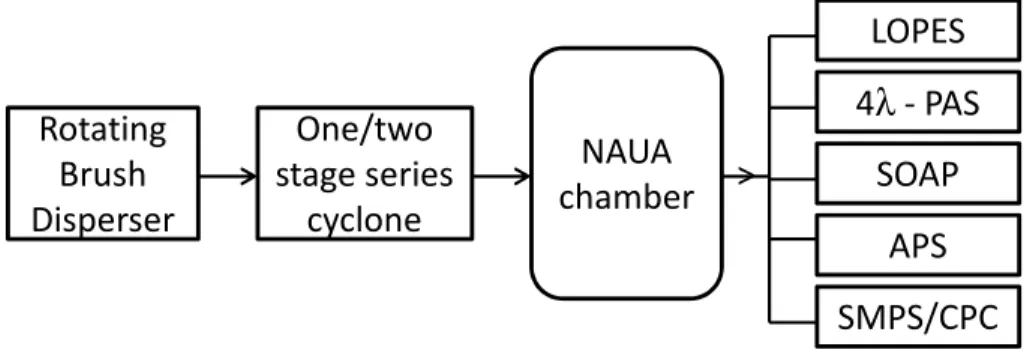
The set-up of the aerosol chamber experiments, as schematically shown in Fig. 1, is only slightly modified compared to our preceding work (Linke et al., 2006). The
exper-5
iments were conducted in the 3.7 m3 sized NAUA chamber, a stainless steel aerosol vessel that is part of the AIDA (Aerosol Interactions and Dynamics in the Atmosphere) facility of the Karlsruhe Institute of Technology. All experiments took place at ambient temperature (typically 296 K) and pressure. Since the employed aerosol and optical instruments sampled ex situ from the chamber volume, a constant flow of particle-free
10
synthetic air of about 2 m3h−1 was added to the vessel to balance for the sampling flows and to maintain ambient pressure conditions, thereby ensuring a well-defined dilution rate of the aerosol during an experiment. A mixing fan was continuously op-erating throughout the experiments for achieving homogeneous conditions in terms of temperature and aerosol particle number concentration inside the aerosol vessel. In
15
the preparation of each experiment, the chamber was evacuated with a vacuum pump to a final pressure of about 0.5 hPa, followed by a series of flushing cycles with particle-free synthetic air to reduce the background level of aerosol particles. The background particle number concentration was usually less than 2 cm−3.
The employed Saharan soil samples (see Sect. 3.1) were sieved to grain size
frac-20
tions of less than 20 µm, 20 to 75 µm, and greater than 75 µm. For our experiments, we have used the 20–75 µm size fraction and have disregarded the other fractions. Mineral dust aerosol particles were then generated and added to the NAUA chamber by dispersing the 20–75 µm sieved fraction of the dry dust samples in a rotating brush disperser (Palas, RGB 1000), de-agglomerating the finest particles in an aerosol
dis-25
ACPD
11, 21363–21427, 2011Complex refractive indices of Saharan
dust samples
R. Wagner et al.
Title Page
Abstract Introduction
Conclusions References
Tables Figures
◭ ◮
◭ ◮
Back Close
Full Screen / Esc
Printer-friendly Version Interactive Discussion
Discussion
P
a
per
|
Dis
cussion
P
a
per
|
Discussion
P
a
per
|
Discussio
n
P
a
per
|
particle-free synthetic air. The dispersion pressure of the nozzle was 1.5 bar. The ini-tial particle number concentrations, as measured with a condensation particle counter (CPC3022A, TSI), were in the range from 860 to 6500 cm−3. After aerosol injection, the NAUA chamber acted as a reservoir for the sampling instruments. During each experiment with a given dust sample, three to four synchronised measurements of the
5
number size distribution as well as the extinction and absorption spectrum were con-ducted at a time interval of about 20 min in order to be able to average the results for the retrieved refractive indices from multiple measurements. No significant and sys-tematic change in the optical properties of the dust particles could be detected on the time scale of the experiments (Linke et al., 2006). For all dust samples, experiments
10
with two impaction stages of the cyclone system were conducted, yielding a cut-off
d(50) of 1.2 µm (aerodynamic diameter). This was done to minimise particle losses by sedimentation in the horizontal sampling lines and in the long horizontal flow tube of the long-path extinction spectrometer LOPES (see Sect. 2.2). The systematic error in the deduced extinction coefficients was estimated to be less than 5 % (Linke et al., 2006).
15
For two dust probes (Burkina Faso and SAMUM B3, see Sect. 3.1), additional exper-iments with only one impaction stage of the cyclone system were performed, yielding
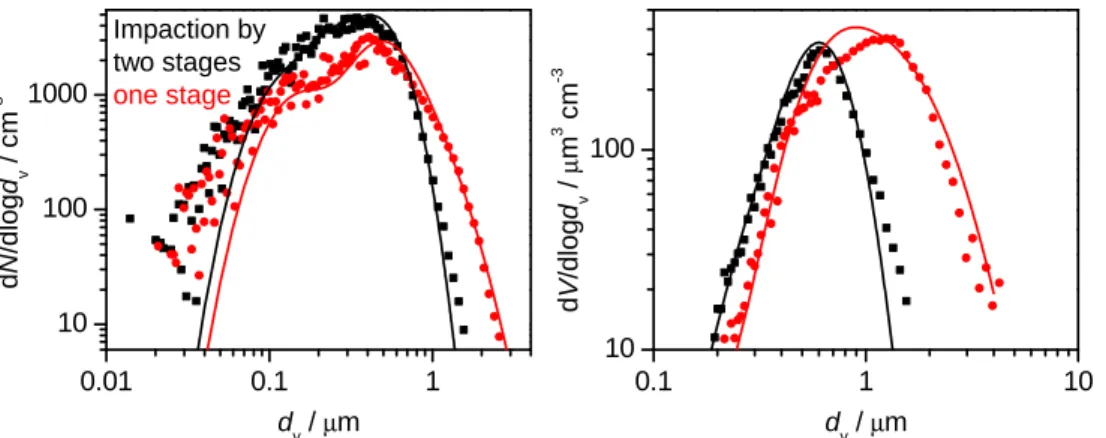
d(50) of 1.5–1.7 µm. Thereby, a significant volume fraction of the dust loading was in a size range above the threshold that contributed to extinction and absorption in the two-stage impaction experiments. Figure 2 exemplarily shows the measured number and
20
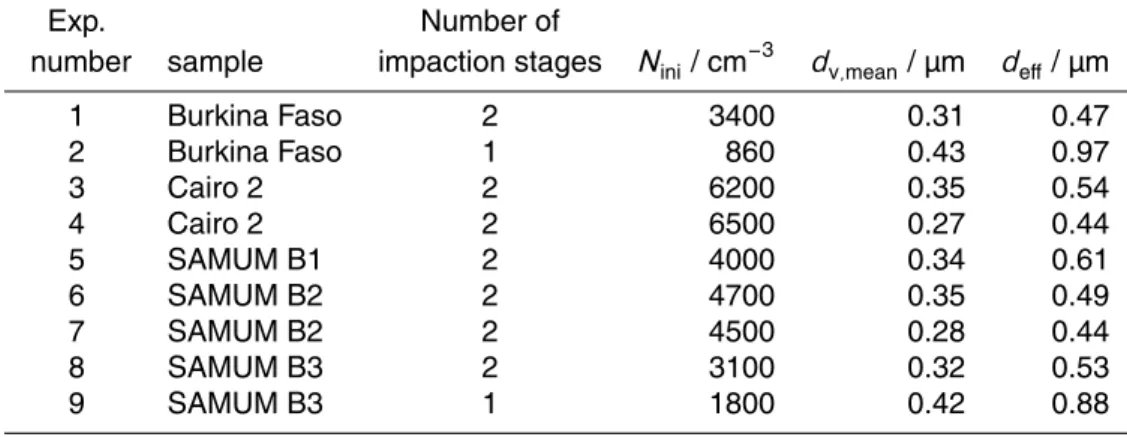
volume size distribution of the re-dispersed SAMUM B3 dust sample for experiments with one and two impaction stages to underline the different cut-off d(50) diameters between both procedures. When using two stages of the impaction system, particles withdv<1 µm contribute to 91 % of the total dust volume concentration whereas with one impaction stage, this fraction is only 47 %. Accepting a higher uncertainty due to
25
potential sedimentation losses, these experiments might therefore shed some light on the size dependence of the deduced complex refractive indices.
ACPD
11, 21363–21427, 2011Complex refractive indices of Saharan
dust samples
R. Wagner et al.
Title Page
Abstract Introduction
Conclusions References
Tables Figures
◭ ◮
◭ ◮
Back Close
Full Screen / Esc
Printer-friendly Version Interactive Discussion
Discussion
P
a
per
|
Dis
cussion
P
a
per
|
Discussion
P
a
per
|
Discussio
n
P
a
per
an Aerodynamic Particle Sizer (APS, TSI, aerodynamic diameter range from 0.523 to 19.81 µm). The mobility equivalent diameter dm from the SMPS measurement is re-lated to the volume equivalent sphere diameterdv of the non-spherical dust particles bydv=dm/χ, withχ denoting the dynamic shape factor (Hinds, 1999). From the aero-dynamic diameterdae measured by the APS instrument, dv is calculated usingχ and
5
the particle densityρPaccording to:
dv=
s
χ
ρPdae. (1)
The APS instrument detects the decreasing tail of the number size distribution towards large particle diameters which significantly contributes to the total volume concentration of the dust loading and thus to its absorption spectrum. In contrast, the mean
diam-10
eter (arithmetic average) of the number size distribution of the various dust particles falls into the size regime of the SMPS measurement and is between 0.27 and 0.43 µm (Table 1). To combine the SMPS and APS measurements, the particle densityρPwas set to 2.6 g cm−3, as estimated from the mineralogical composition of the dust samples
(Sect. 3) using tabulated densities for the pure minerals (Kandler et al., 2009). χ was
15
individually adjusted for each dust type to match the SMPS and APS recordings in their overlapping size regime, yielding values between 1.17 and 1.35. Similar results forχ
were recently obtained by Schladitz et al. (2009). Note that any uncertainties inχ and
ρP have a huge impact on the accuracy of the derived imaginary part of the complex refractive index of the dust samples. The error in dv calculated by Eq. (1) is
propa-20
gated to the third power into the uncertainty of the volume concentration of the dust particles. Since light absorption by the dust particles is governed by their volume con-centration, this error is directly transferred to the retrieved imaginary part (absorption index) of the complex refractive index (Bohren and Huffman, 1983). For this reason, as already indicated in the introduction and elaborated in more detail in Sect. 4.4, we
25
ACPD
11, 21363–21427, 2011Complex refractive indices of Saharan
dust samples
R. Wagner et al.
Title Page
Abstract Introduction
Conclusions References
Tables Figures
◭ ◮
◭ ◮
Back Close
Full Screen / Esc
Printer-friendly Version Interactive Discussion
Discussion
P
a
per
|
Dis
cussion
P
a
per
|
Discussion
P
a
per
|
Discussio
n
P
a
per
|
example shown in Fig. 2, further number size distributions for all dust types are shown in Sect. 4.4. Table 1 summarises the initial number concentrations as well as mean and effective diameters (Hansen and Travis, 1974) for all experiments with the different dust types. Note that two identical experiment series (i.e. employing the same number of impaction stages) were conducted with the Cairo 2 and SAMUM B2 soil samples.
5
2.2 Optical instrumentation
UV-VIS extinction coefficients of the dust particles were measured with a flow tube ex-tinction spectrometer (LOPES, Long-Path Exex-tinction Spectrometer) (Linke et al., 2006; Schnaiter et al., 2005; Wagner et al., 2009). The horizontally mounted stainless steel flow tube of 3 m length is equipped with a retro reflector for optical path folding to obtain
10
an overall optical path length of 6 m. The extinction spectra were recorded from 230 to 1000 nm with a spectral resolution of 2.5 nm, using a deuterium/halogen lamp combi-nation (Mikropack, model DH2000-FHS-DUV) as the light source. The light is coupled in and out of the flow tubes by specially designed two-fibre optical systems in combi-nation with a 90◦o
ff-axis parabola mirror (Schnaiter et al., 2005). The transmitted light
15
is analysed by a 2-channel UV-VIS diode array spectrometer (tec5, MCS UV-NIR) with 15 bit resolution. Taking all systematic errors into account, the measurement yields the accuracy in terms of the extinction coefficients of 40 Mm−1 (Schnaiter et al., 2005;
Wagner et al., 2009).
The absorption coefficients,σabs, of the dust particles were deduced from
measure-20
ments with the Spectral Optical Absorption Spectrometer SOAP that has already suc-cessfully been applied during the SAMUM-1 and SAMUM-2 field experiments (M ¨uller et al., 2009, 2011). A description of the SOAP and a characterisation with the focus on absorption by mineral dust can be found in M ¨uller et al. (2011). A few main fea-tures of the SOAP are given in the following. The dust particles are deposited onto
25
ACPD
11, 21363–21427, 2011Complex refractive indices of Saharan
dust samples
R. Wagner et al.
Title Page
Abstract Introduction
Conclusions References
Tables Figures
◭ ◮
◭ ◮
Back Close
Full Screen / Esc
Printer-friendly Version Interactive Discussion
Discussion
P
a
per
|
Dis
cussion
P
a
per
|
Discussion
P
a
per
|
Discussio
n
P
a
per
Inc., CDI2DMPP-UV-VIS) at wavelengths between 200 to 960 nm with an optical reso-lution of 25 nm. The pixel resoreso-lution of the spectrometers is 1.5 nm pixel−1and raw data are smoothed to yield a resolution of 10 nm. Signals at wavelengths smaller 300 nm are too noisy and were not used. Data are given between 305 and 955 nm in steps of 10 nm. With an inversion scheme based on radiative transfer calculations of particle
5
laden filters, particle absorption coefficients are calculated. A well known issue of fil-ter based absorption measurements is the cross sensitivity to particle scatfil-tering. The effect of particle scattering is compensated for by measuring both the transmitted and reflected intensities. The uncertainties of SOAP are given by∆σabs=±(0.15 σabs +
0.02σsca) (M ¨uller et al., 2011). This implies that the uncertainty is a function of the
10
single scattering albedo.
The absorption coefficients measured by SOAP were used in our inversion scheme to deduce the imaginary parts of the complex refractive index because they are con-tinuously available over the entire wavelength range from 305 to 955 nm. The onset of dust absorption due to potential contributions of iron oxides can thus be accurately
15
localised. Since we have used a photo acoustic system in our previous work to mea-sure dust absorption (Linke et al., 2006), we want to briefly note that in the present study absorption measurements were additionally performed with a novel four wave-length photo acoustic spectrometer (4λ – PAS) that was developed at the University of Szeged, Hungary (Ajtai et al., 2010). Photo acoustic signals are obtained at the
20
fundamental (λ=1064 nm), the doubled (λ=532 nm), the tripled (λ=355 nm), and the quadrupled (λ=266 nm) emission of a Nd:YAG laser. We will show a comparison of the records from the two instruments in Sect. 5.1.
2.3 Single particle analyses by electron microscopy
Dust aerosol particles were collected with a miniature cascade impactor on carbon
25
ACPD
11, 21363–21427, 2011Complex refractive indices of Saharan
dust samples
R. Wagner et al.
Title Page
Abstract Introduction
Conclusions References
Tables Figures
◭ ◮
◭ ◮
Back Close
Full Screen / Esc
Printer-friendly Version Interactive Discussion
Discussion
P
a
per
|
Dis
cussion
P
a
per
|
Discussion
P
a
per
|
Discussio
n
P
a
per
|
Quanta 200 FEG equipped with an EDAX analysing system for single particle appli-cations and a FEI TEM CM200. Both instruments were equipped with an energy-dispersive X-ray detector to assess the elemental composition of the single particles. Five components (quartz, an “average” silicate, hematite, calcite, and sulphate) were assumed to be representative of the aerosol composition. The relative contribution of
5
these compounds was determined from the quantification of the tracer elements (Si, Si+Al, Fe, Ca, S, respectively) for each single particle. For more details on the tech-nique, refer to Kandler et al. (2009).
The size of the particles used for their classification into intervals was calculated as
de=pπ−14B (2)
10
with B denoting the area covered by the particle. The shape of the particles was determined as the axis ratio, AR, of an equal area ellipse for each particle, calculated as
AR=πL
2
4B (3)
withLdenoting the longest projection of the particle outline.
15
3 Desert dust samples
3.1 Origin of the employed Saharan soil samples
Amongst the five dust samples listed in Table 1, the Cairo 2 sample has already been investigated in our previous study (Linke et al., 2006). This soil sample was collected from the Northern Sahara about 70 km northeast of Cairo city from a depth of 0.5 m
20
ACPD
11, 21363–21427, 2011Complex refractive indices of Saharan
dust samples
R. Wagner et al.
Title Page
Abstract Introduction
Conclusions References
Tables Figures
◭ ◮
◭ ◮
Back Close
Full Screen / Esc
Printer-friendly Version Interactive Discussion
Discussion
P
a
per
|
Dis
cussion
P
a
per
|
Discussion
P
a
per
|
Discussio
n
P
a
per
5◦45.686′W), the SAMUM B2 sample from a Hamada close to the Oued el Atach (29◦50.974′N 6◦0.905′W), and the SAMUM B3 sample in a dry river bed close to the
border of the dry salt/silt plain of Lac Iriqui and to the sand dune fields (29◦51.721′N 6◦9.406′W). In contrast to these comparatively light-coloured soil samples, the fifth sample, Burkina Faso, has a much darker appearance and is coloured reddish brown.
5
The Burkina Faso soil sample consists of wind-blown material and was collected in West Africa during the AMMA (African Monsoon Multidisciplinary Analysis) dust exper-iment near Dano (11◦9.75′N 3◦4.57′W) from the bank of an artificial lake which was
bare of vegetation and not contaminated by sediments of the lake.
3.2 Bulk analyses of the chemical and mineralogical composition of the soil
10
samples
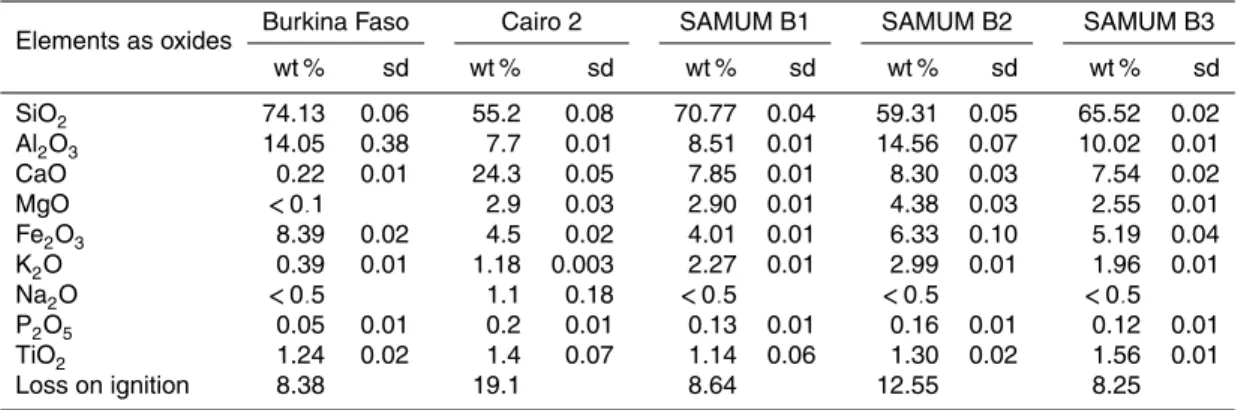
The elemental composition of each soil sample was determined for the 20–75 µm size fraction by X-ray Fluorescence Analysis (XRF, Bruker AXS, SRS 303AS). Prior to the analysis, each soil sample was ignited at 1000◦C for 1 h and its loss on ignition was determined. A sample mass of 200 mg was used for the analysis. Table 2 summarises
15
the weight percentages of oxides that were calculated from the measured elements. The total iron content (expressed by the method as Fe2O3) varies between 4.0 and
8.4 weight percent (wt %) and, as expected, is highest for the reddish brown coloured Burkina Faso soil sample. For assessing the absorption potential of the soil samples, however, the total iron content must be divided into two classes. Structural iron is
20
incorporated into the crystal structure of silicates and alumino-silicates and does not considerably influence the optical properties at visible wavelengths (Karickhoffand Bai-ley, 1973; Lafon et al., 2004). Only Fe(III) in the form of oxides and hydroxides (Fe2O3,
hematite; FeOOH, goethite), i.e. so-called free iron, controls absorption of light in soil samples (Lafon et al., 2004). The free-to-total iron ratio in natural soil samples can be
25
ACPD
11, 21363–21427, 2011Complex refractive indices of Saharan
dust samples
R. Wagner et al.
Title Page
Abstract Introduction
Conclusions References
Tables Figures
◭ ◮
◭ ◮
Back Close
Full Screen / Esc
Printer-friendly Version Interactive Discussion
Discussion
P
a
per
|
Dis
cussion
P
a
per
|
Discussion
P
a
per
|
Discussio
n
P
a
per
|
from the literature, Kandler et al. (2009) have assumed that only 20 % of the total iron content is hematite. It is therefore necessary to obtain independent information on the mineralogical composition of the soil samples by X-ray Diffraction Analysis (XRD).
The mineralogy of the 20–75 µm sieved fraction of the Burkina Faso, SAMUM B1, B2, and B3 soil samples was identified and quantified by X-ray Diffraction using the method
5
of reference intensity ratios (RIR) (Chung, 1974). The standard-less RIR method uses the intensities of the main reflections of the mineral phases to calculate the relative min-eral abundances, relying on RIR values of the minmin-erals that are provided by the ICDD database (ICDD, 2002). Note that only identified minerals are summed up to 100 %. Special care has to be taken to quantify clay minerals because they usually exhibit
10
no or only weak reflections in randomly oriented powder samples due to their small particle size and their crystal structure (Moore and Reynolds, 1997). As described in Kandler et al. (2009), we have therefore additionally created textured samples to obtain a preferential horizontal orientation of the predominantly plate-like clay mineral parti-cles. This induces an enhancement of their X-ray peak intensities, thereby facilitating
15
mineral identification. To calculate the total weight fraction of clay minerals, we define a threshold size of 2 µm and assign all particles below this size to the clay fraction. The two size fractions<2 µm and>2 µm were separated by gravimetrical methods and then independently weighed to evaluate the clay content (Kandler et al., 2009). In the final analysis step, a randomly oriented sample of the<2 µm clay fraction was prepared to
20
quantify the clay minerals afore identified in the textured specimens.
Table 3 summarises the results from the XRD bulk analyses of the four soil samples. The three SAMUM soil samples have a similar composition, with a quartz content of 31–49 wt % and 29–37 wt % fractions of the feldspars albite and microcline. The lower quartz content of the SAMUM B2 sample is compensated by a higher amount of the
25
ACPD
11, 21363–21427, 2011Complex refractive indices of Saharan
dust samples
R. Wagner et al.
Title Page
Abstract Introduction
Conclusions References
Tables Figures
◭ ◮
◭ ◮
Back Close
Full Screen / Esc
Printer-friendly Version Interactive Discussion
Discussion
P
a
per
|
Dis
cussion
P
a
per
|
Discussion
P
a
per
|
Discussio
n
P
a
per
as the clay minerals kaolinite and illite (19 and 6 wt %, respectively). Compared to the total iron contents determined by the XRF analyses which only vary by a factor of about two between the Burkina Faso and the three SAMUM soil samples, the XRD bulk analyses suggest that the absorption potential of the re-dispersed Burkina Faso soil sample should be at least one order of magnitude larger than that of the other soil
5
probes. In the next section, we will investigate whether this large variation in the iron oxide content of the bulk soil samples is also evident in the actual aerosol composition of the re-dispersed dust particles, as inferred from electron-microscopic single particle analysis.
3.3 Single-particle analyses of the chemical and mineralogical composition of
10
the airborne, re-dispersed dust particles
The automated analysis by scanning electron microscopy yields a backscatter electron image and an average elemental composition for each single particle. According to this elemental composition, particles are classified into major compositional groups following a set of criteria used successfully for mineral dust (e.g. Kandler et al., 2007,
15
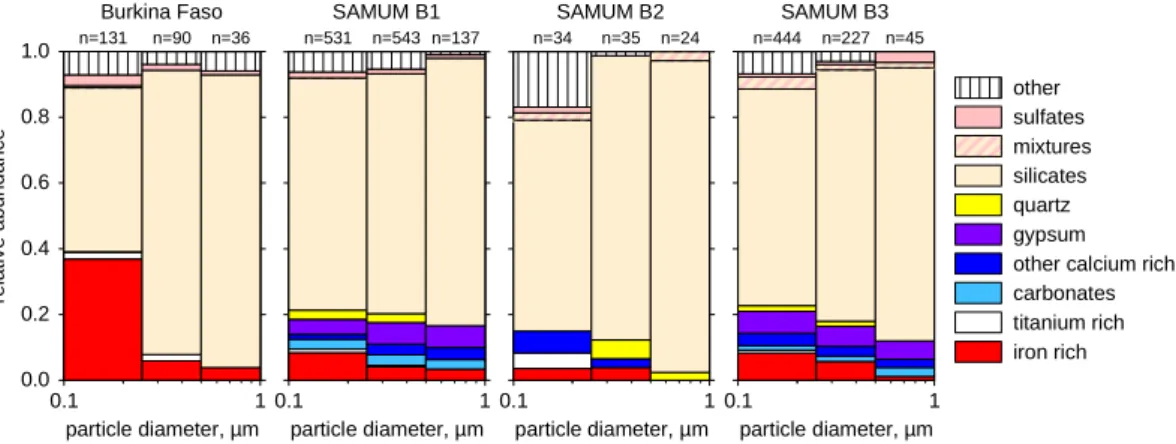
2009). Figure 3 shows the size-resolved composition of the Burkina Faso and the SAMUM B1, B2, and B3 samples. In contrast to the bulk samples that were dominated by quartz (silicon dioxide), all aerosol samples are dominated by the silicate particle group (clay minerals and/or feldspars, indicated by the elements Si and Al, with minor contents of Na, Ca, K, and/or Fe). As expected from other investigations (e.g. Kandler
20
et al., 2009), the obviously larger quartz particles from the parent soils were not present any more in the re-dispersed aerosol. A common feature for all samples is the increase in the abundance of iron-rich particles with decreasing particle size. In the Burkina Faso sample, this abundance of iron-rich particles is significantly higher than in the SAMUM samples, but the difference is much lower than the difference between the parent soil
25
ACPD
11, 21363–21427, 2011Complex refractive indices of Saharan
dust samples
R. Wagner et al.
Title Page
Abstract Introduction
Conclusions References
Tables Figures
◭ ◮
◭ ◮
Back Close
Full Screen / Esc
Printer-friendly Version Interactive Discussion
Discussion
P
a
per
|
Dis
cussion
P
a
per
|
Discussion
P
a
per
|
Discussio
n
P
a
per
|
total hematite volume contribution to the aerosol, as calculated by the five component mixing model, is 2.7 vol % for the Burkina Faso sample and only 1.1 to 1.6 vol % for the SAMUM samples (Table 4). As in Kandler et al. (2009), 20 % of the total iron content were attributed to hematite. Another visible difference between the Burkina Faso sample and the SAMUM samples lies in the presence of calcium-rich particles,
5
which are absent in the Burkina Faso sample, but contribute with up to 9.2 vol % to the SAMUM samples. This difference is in accordance with the parent topsoil composition of the source regions (Claquin et al., 1999). In Sect. 5.2, we employ the deduced aerosol composition from Table 4 as input to compute the imaginary parts of complex refractive index of the dust particles with various mixing rule approaches.
10
The particles were classified into compositional groups to enable the calculation of volume contributions; however, even though this complexity cannot currently be re-garded by our model, it should not be concealed that each single particle can possess a unique composition and structure. Figure 4 shows a scatter plot of iron index versus silicon index. The element index is defined as the atomic ratio of the concentration of
15
the element considered and the sum of the concentrations of the elements Na, Na, Mg, Al, Si, P, S, Cl, K, Ca, Ti, Cr, Mn, and Fe. It becomes instantaneously visible that a) the average iron index of the silicate particles is larger in Burkina Faso (cluster around silicon index 0.45), and that b) there exists a group of small particles rich in iron (cluster at silicon index 0.1 and iron index 0.5), which is more abundant in the Burkina
20
Faso than in the SAMUM B3 sample. Apart from these clusters, particles with variable compositions exist. For this reason, the five component mixing model described above was calculated on a single particle basis rather than based on the identified particle groups.
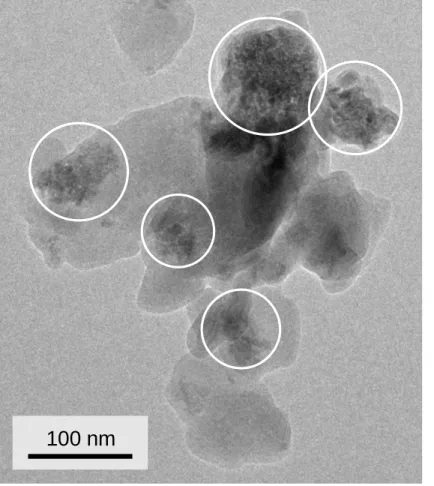
To illustrate the complex structure of even single particles, Fig. 5 shows an
exam-25
ACPD
11, 21363–21427, 2011Complex refractive indices of Saharan
dust samples
R. Wagner et al.
Title Page
Abstract Introduction
Conclusions References
Tables Figures
◭ ◮
◭ ◮
Back Close
Full Screen / Esc
Printer-friendly Version Interactive Discussion
Discussion
P
a
per
|
Dis
cussion
P
a
per
|
Discussion
P
a
per
|
Discussio
n
P
a
per
hematite by selected area diffraction (SAED) in the TEM. Lattice spacings measured in the SAED patterns did match with hematite, but neither with magnetite nor goethite. High resolution TEM images of those iron enriched locations on the particles revealed primary crystallite grains of five to some tens of nanometres size. Additional elemental mappings (not shown) revealed that iron-rich and also titanium-rich crystallites on and
5
attached to particles are a common feature of the investigated dust, which was also reported for atmospheric desert aerosol (e.g. Scheuvens et al., 2011). The complexity of the internal particle structure must be kept in mind when comparatively simple mix-ing rule approaches are applied to compute the complex refractive index of the dust particles (Sect. 5.2).
10
The shape of the dust particles was assessed by means of an axis ratio of an equal-area ellipse for all analysed particles (Sect. 2.3). This information is important to cover the appropriate regime of particle aspect ratios in the computation of the optical cross sections whose methodology is described in the next section. In Fig. 6, the density dis-tribution of the axis ratios (AR) is shown as normalised values per size interval as well
15
as a parameterised curve (for parameterisation refer to Kandler et al., 2007). While there is no considerable difference between the SAMUM B1 and B3 samples (median AR for B1/B2/B3:1.85/1.93/1.78; particle number of B2 was not sufficient for param-eterisation), the Burkina Faso sample shows slightly lower axis ratio values (median 1.69), i.e. less elongated particles. Overall, the AR values found in this laboratory
ex-20
periment are slightly higher than those encountered in ambient dust aerosol, featuring median values of 1.6 to 1.7 west of Africa with similar parent soils (Kandler et al., 2007, 2009, 2011). This might be related to the aerosol generation mechanism because the re-dispersion of the soil samples including one or two impaction stages is, of course, just a surrogate for the natural particle production.
ACPD
11, 21363–21427, 2011Complex refractive indices of Saharan
dust samples
R. Wagner et al.
Title Page
Abstract Introduction
Conclusions References
Tables Figures
◭ ◮
◭ ◮
Back Close
Full Screen / Esc
Printer-friendly Version Interactive Discussion
Discussion
P
a
per
|
Dis
cussion
P
a
per
|
Discussion
P
a
per
|
Discussio
n
P
a
per
|
4 Inversion scheme
In this chapter, we explain the details of our inversion scheme to deduce the wave-length dependent imaginary part of the complex refractive index of the airborne dust particles from their optical spectra and their simultaneously recorded number size dis-tributions. In Sect. 4.1, we describe the computation of a scattering database on a
four-5
dimensional parameter space which serves as a look-up table in the retrieval procedure and thus limits the computational burden of our analysis. The database contains the extinction and absorption cross sections of randomly-oriented spheroidal particles as a function of their size parameter, aspect ratio, and the real and imaginary parts of the complex refractive index. Selected computational results on the shape dependency
10
of the optical cross sections are summarised in Sect. 4.2. In Sect. 4.3, we outline our initial approach aiming at the retrieval of both the real and the imaginary part of the complex refractive index from the extinction and the absorption spectrum. Our modified approach where the extinction spectrum is used for optimising the measured number size distribution of the dust particles which then is used as input to derive the
imagi-15
nary part of the complex refractive index from the absorption spectrum is described in Sect. 4.4.
4.1 Computational methods: a database of optical cross sections for randomly
oriented spheroidal particles
As in similar computational studies on the optical properties of mineral dust, we have
20
employed a spheroidal model to compute the shape dependent extinction and absorp-tion cross secabsorp-tions of the irregularly shaped dust particles (Dubovik et al., 2006; Meng et al., 2010; Merikallio et al., 1997, 2011; Otto et al., 2009; Wiegner et al., 2009; Yang et al., 2007). A random orientation of the particles was assumed. The aspect ratioε
of a spheroid was defined as the ratio of its horizontal to rotational axis (Mishchenko
25
ACPD
11, 21363–21427, 2011Complex refractive indices of Saharan
dust samples
R. Wagner et al.
Title Page
Abstract Introduction
Conclusions References
Tables Figures
◭ ◮
◭ ◮
Back Close
Full Screen / Esc
Printer-friendly Version Interactive Discussion
Discussion
P
a
per
|
Dis
cussion
P
a
per
|
Discussion
P
a
per
|
Discussio
n
P
a
per
SEM single particle analyses (Fig. 6), a maximum asphericity ofε=4 andε=0.25 was assumed for oblate and prolate particle shapes, respectively. Altogether, 29 logarithmi-cally equidistant aspect ratios between 0.25 and 4 were considered. For each aspect ratio, the optical cross sections were computed for 88 logarithmically spaced equal-volume sphere size parametersxv (x=πdv/λ) between 0.02 and 50, 11 equidistantly
5
spaced real parts of the complex refractive index between 1.3 and 1.7, and 15 logarith-mically spaced values between 0.0001 and 0.1 for the imaginary part of the complex refractive index, summing up to 14 520 individual calculations. The optical cross sec-tions for intermediate values of xv and the complex refractive index are obtained by spline interpolation from the pre-computed data.
10
We have calculated the extinction and absorption cross sections of the spheroids with the extended precision FORTRAN T-matrix code for randomly oriented particles by Mishchenko and Travis (1998) up to size parameters where stable performance was guaranteed. For large deviations from the spherical shape, the T-matrix computations became non-convergent before the largest considered size parameter ofxv=50 was
15
reached. Besideε, this convergence limit also depends on the magnitude of the real and imaginary part of the complex refractive index (Mishchenko and Travis, 1998). Above the convergence point of the T-matrix calculations, we have continued our com-putations with a ray-tracing model including diffraction of light incident on the particles’ projected area (Macke et al., 1996). In the framework of the geometric optics
approxi-20
mation with the allowance for diffraction, the extinction efficiencyQext(extinction cross section,Cext, divided through the average cross-sectional area of the particles) is equal to 2 and the value for the absorption efficiency,Qabs, does not exceed unity. In reality, however, the limit Qext=2 is only reached for size parameters well above our con-sidered size range and absorption resonances might occur withQabs>1 (Baran et al.,
25
2001). The differences between the true extinction and absorption efficienciesQextand
ACPD
11, 21363–21427, 2011Complex refractive indices of Saharan
dust samples
R. Wagner et al.
Title Page
Abstract Introduction
Conclusions References
Tables Figures
◭ ◮
◭ ◮
Back Close
Full Screen / Esc
Printer-friendly Version Interactive Discussion
Discussion
P
a
per
|
Dis
cussion
P
a
per
|
Discussion
P
a
per
|
Discussio
n
P
a
per
|
The edge contribution to the extinction efficiency for randomly oriented spheroids was calculated according to the approximations by Fournier and Evans (1991). Similar to Yang et al. (2007), the edge contribution to the absorption efficiency of a spheroid of diameterdv was in the first step approximated to be equal to that of an equal-volume sphere. The latter quantity was calculated as the difference between the true
absorp-5
tion efficiency calculated with Mie theory and the geometric optics result.
Two examples of the applied edge corrections are displayed in Fig. 7. In the left panel, we show an example where the T-matrix computations were convergent over the complete range of size parameters (oblate spheroids withε=2, complex refractive index=1.5+0.1 i) in order to assess the accuracy of the edge correction. Whereas the
10
pure geometric optics results for the extinction and absorption efficiencies reveal clear deviations from the T-matrix values for the reasons outlined in the preceding paragraph, the addition of the edge contribution leads to a very good agreement with the T-matrix result for size parameters larger than about 15. In the second example shown in the right panel, we have increasedεto 2.97. The convergence limit of the T-matrix
com-15
putations is at aboutxv=31. For the extinction efficiency, an accurate extension of the truncated T-matrix results is obtained by including the edge contribution. The absorp-tion efficiency at the threshold size parameter ofxv=31, however, is slightly overesti-mated when adding the edge contribution of an equal-volume sphere to the geometric optics result (dashed blue line). A better extension of theQabs curve is obtained when
20
equalling the edge contribution to that of an equal-volume spheroid of ε=2 (dashed red line, obtained as difference from the true Qabs calculated by the T-matrix method and the geometric optics result). In the second step, we have therefore computed the edge contribution toQabs for prolate and oblate spheroids with the largest asphericity for which stable T-matrix results could be obtained over the complete range of size
pa-25
rameters. These values were then used to improve the geometric optics results ofQabs
ACPD
11, 21363–21427, 2011Complex refractive indices of Saharan
dust samples
R. Wagner et al.
Title Page
Abstract Introduction
Conclusions References
Tables Figures
◭ ◮
◭ ◮
Back Close
Full Screen / Esc
Printer-friendly Version Interactive Discussion
Discussion
P
a
per
|
Dis
cussion
P
a
per
|
Discussion
P
a
per
|
Discussio
n
P
a
per
4.2 Shape dependency of the computed extinction and absorption cross
sections
In Fig. 8, we have compiled selected computational results from the database to un-derline the shape dependency of the optical cross sections of the randomly oriented spheroids. The left panel shows the extinction cross sections as a function of the
parti-5
cles’ equal-volume sphere diameter at a wavelength of 500 nm for a complex refractive index of 1.5+0.014 i. A set of curves for all considered aspect ratios is shown, with selected shapes highlighted by coloured lines. Up to adv of about 0.7 µm, the spread of the individual traces is low. As evident from the insert, an increasing degree of particle asphericity leads to a slight decrease in the extinction cross sections. As an
10
example,Cext for 0.5 µm sized spheroids of aspect ratioε=0.25 (red line) is lowered by about 10 % compared to spheres (green line). Larger deviations from the results for spheres in this size regime are only expected for particles with extreme aspect ratios, e.g. needle- and plate-like particles (Zakharova and Mishchenko, 2000).
Above 0.7 µm, the results for the extinction cross sections of the various spheroidal
15
particle shapes start to diverge because we enter the size range where extinction is governed by the interference structure, i.e. series of extinction minima and maxima caused by interference of incident and forward-scattered light (Bohren and Huffman, 1983). The interference structure can be better seen when plotting the extinction effi -ciencies as a function ofdv, as shown in the right panel of Fig. 8. For slightly aspherical
20
spheroids (e.g.ε=1.64, yellow line), the regular series of extinction minima and max-ima observed for spheres (green line) is still conserved. A higher degree of asphericity, however, induces a strong distortion of these regular oscillations. Oblate spheroids of aspect ratioε=4 (brown line), for example, show a first extinction efficiency maximum atdv=1.2 µm whereas for spheres this particle size corresponds to the first extinction
25
ACPD
11, 21363–21427, 2011Complex refractive indices of Saharan
dust samples
R. Wagner et al.
Title Page
Abstract Introduction
Conclusions References
Tables Figures
◭ ◮
◭ ◮
Back Close
Full Screen / Esc
Printer-friendly Version Interactive Discussion
Discussion
P
a
per
|
Dis
cussion
P
a
per
|
Discussion
P
a
per
|
Discussio
n
P
a
per
|
variations in Cext will again be addressed in the discussion of our modified retrieval approach in Sect. 4.4 because, depending on the wavelength, a significant part of the dust particle number size distributions may extend into the size range that is dominated by the interference structure.
In addition to the spheroid computations, we have performed a single test calculation
5
ofCextandCabs for an aggregate-like particle that might be a better representation for the habit of irregularly formed natural dust grains. The aggregate particle was modelled as two touching spheroids with individual aspect ratios of 1.07 and 1.20. The two spheroids have a volume ratio of 1.12 and an angle between their individual rotational axes of 45◦. The optical cross sections of the aggregate particle in random orientation
10
were computed with the discrete dipole approximation (DDA), using the DDSCAT 6.0 FORTRAN software package (Draine and Flatau, 1994). The trace forCextof the two touching ellipsoids, shown as blue line in the left panel, is up to adv of about 1.1 µm very similar to that of the most elongated spheroid (ε=0.25, red line), a finding that will also again be discussed in Sect. 4.4.
15
The bottom panel of Fig. 8 displays the shape dependent absorption cross sections for the 29 considered spheroidal particle shapes as well as for the aggregate-like par-ticle. For equal-volume sphere diameters up to about 1.5 µm, the individual traces coincide, meaning thatCabs is proportional to the particle volume and does not show any variations with increasing asphericity as long asdv is kept constant. For all dust
20
experiments where two impaction stages were used during aerosol generation, almost the entire particle volume concentration is governed by particles ofdvless than 1.5 µm (Fig. 2). Hence, shape effects can be neglected when retrieving the imaginary part of the complex refractive index from the absorption spectra. Above 1.5 µm, the in-dividual traces forCabs start to diverge slightly, with up to 10% higher values for the
25
ACPD
11, 21363–21427, 2011Complex refractive indices of Saharan
dust samples
R. Wagner et al.
Title Page
Abstract Introduction
Conclusions References
Tables Figures
◭ ◮
◭ ◮
Back Close
Full Screen / Esc
Printer-friendly Version Interactive Discussion
Discussion
P
a
per
|
Dis
cussion
P
a
per
|
Discussion
P
a
per
|
Discussio
n
P
a
per
spheroids because the surface area of spheroids with a given dv increases with in-creasing asphericity. This effect may introduce a small uncertainty to the retrieval results for the imaginary part of the complex refractive index for those experiments where only a single impaction stage was used. Here, particles ofdvlarger than 1.5 µm significantly contribute to the total dust volume concentration.
5
4.3 Initial approach: retrieval of both the real and imaginary part of the complex
refractive index
Four quantities were independently measured for each desert dust sample in our exper-iments: the wavelength resolved extinction and absorption coefficients, σext and σabs, the number size distribution, and the frequency distribution of aspect ratios. Our
ini-10
tial scheme to retrieve the wavelength dependent complex refractive index of the dust aerosols at each wavelength was as follows. Based on an initial guess for the real,
nini, and imaginary part,kini, of the complex refractive index at a given wavelength, the size- and shape averaged extinction and absorption coefficients of the aerosol particles could be calculated from the database using the measured number size distribution and
15
frequency distribution of aspect ratios as input, yielding the quantitiesσext,calc(nini,kini) andσabs,calc(nini,kini). Then, the combined root mean square (rms) deviations between the measured quantities from LOPES and SOAP,σext,meas(n,k) andσabs,meas(n,k), and the computed values could be calculated (Eq. 4).
rmsabs+ext(n,k)=
σ
abs,meas(n,k)−σabs,calc(nini,kini)
σabs,calc(nini,kini)
2
| {z }
rmsabs
+
σ
ext,meas(n,k)−σext,calc(nini,kini)
σext,calc(nini,kini)
2
| {z }
rmsext
(4)
20
Equation 4 holds for each wavelength step of the extinction and absorption measure-ments. Then, the added rmsabs+extvalue for extinction plus absorption could be
min-imised by optimising the initial guess values nini and kini, yielding the true values for
ACPD
11, 21363–21427, 2011Complex refractive indices of Saharan
dust samples
R. Wagner et al.
Title Page
Abstract Introduction
Conclusions References
Tables Figures
◭ ◮
◭ ◮
Back Close
Full Screen / Esc
Printer-friendly Version Interactive Discussion
Discussion
P
a
per
|
Dis
cussion
P
a
per
|
Discussion
P
a
per
|
Discussio
n
P
a
per
|
mainly governed by the magnitude ofn, the minimisation of the combined rmsabs+ext
value should yield a unique retrieval result for bothnand k. To check this hypothesis we have performed the following test calculations.
Using the measured number size distribution of re-dispersed dust particles from Exp. 1 (Burkina Faso dust sample) as input, we have calculated the extinction and
5
absorption coefficients for two wavelengths (λ=0.8 and 0.3 µm) at each point of a two-dimensional grid spanned by the real and the imaginary part of the complex refractive index, varying n between 1.3 and 1.7 and k between 0.0001 and 0.1. The compu-tations were done for an aspect ratio of 2. We have then defined the extinction and absorption coefficients calculated for n=1.5 and k=0.05 as σext,meas and σabs,meas,
10
thereby simulating a measurement of these quantities. Afterwards we have calculated according to Eq. (4) for all other grid points the root mean square deviations rmsabs+ext,
rmsabs, and rmsext ofσext and σabs in relation to these simulated measurements. By
plotting the computed rms values as contour lines in thenandk space (Fig. 9), we can analyse whether other combinations ofnand k yield the same extinction and
absorp-15
tion coefficients as obtained for n=1.5 and k=0.05, meaning that no unambiguous retrieval result for the complex refractive index can be obtained. On the contrary, a distinct global minimum in the contour plot of rmsabs+extatn=1.5 andk=0.05 would
indicate that only calculations with this particular complex refractive index as input are able to simultaneously reproduce the simulated measurements of both σext,meas and
20
σabs,meas.
The set of three panels in top left part of Fig. 9 shows the rms values for the compu-tations atλ=0.8 µm. The contour plot for rmsext(left chart, blue lines) displays a long valley that extends over the complete range ofk values whereasnonly varies between about 1.525 and 1.475 along the valley floor. This means that the extinction spectrum
25
is indeed governed by the magnitude of n and its value is fairly constrained by the extinction measurement. The opposite behaviour holds for rmsabs (middle chart, red
ACPD
11, 21363–21427, 2011Complex refractive indices of Saharan
dust samples
R. Wagner et al.
Title Page
Abstract Introduction
Conclusions References
Tables Figures
◭ ◮
◭ ◮
Back Close
Full Screen / Esc
Printer-friendly Version Interactive Discussion
Discussion
P
a
per
|
Dis
cussion
P
a
per
|
Discussion
P
a
per
|
Discussio
n
P
a
per
constrains the magnitude of the imaginary part of the complex refractive index. Adding the rmsextand rmsabsvalues (right chart, black lines) then leads to a well defined global minimum atn=1.5 andk=0.05, i.e. simultaneously fitting the measured extinction and absorption coefficients atλ=0.8 µm leads to a unique retrieval result for the complex refractive index.
5
A different behaviour is observed for the computations atλ=0.3 µm which are shown in the set of three panels in the top right part of Fig. 9. Whereas the contour plot for rmsabs is similar to that atλ=0.8 µm, the contour plot for rmsext displays an extremely shallow, curved valley. Note that the outmost grid lines in the rmsextplot correspond to
a value of only 0.001 which is one order of magnitude smaller than that of the outmost
10
grid lines shown in the contour plot of rmsabs. The added rmsext+abs contour plot is therefore dominated by the absorption contribution and reveals the characteristic long valley extending over the complete range ofnvalues. For that reason, the magnitude ofnis not constrained by simultaneous extinction and absorption measurements atλ=
0.3 µm. In order to understand this modified behaviour, we have plotted in the bottom
15
panel of Fig. 9 the extinction efficiencies, Qext, as a function of the size parameter, x, for a series of complex refractive indices along the valley floor of the rmsextcontour plot (denoted by the coloured points). In addition, the volume size distribution of the Burkina Faso dust particles that was employed in the calculations is also shown, having been transformed to the size parameter scale for the λ=0.8 µm (circles) and λ=0.3 µm
20
(squares) wavelengths. At λ=0.8 µm, almost the entire volume size distribution is located in the size regime before the first interference maximum in the various Qext
traces is reached. For these particle sizes,Qextsystemically decreases with decreasing
n, meaning that the magnitude ofncontrols the value for the size averaged extinction coefficient. Similar values for σext are thus only obtained within a small range of n
25
ACPD
11, 21363–21427, 2011Complex refractive indices of Saharan
dust samples
R. Wagner et al.
Title Page
Abstract Introduction
Conclusions References
Tables Figures
◭ ◮
◭ ◮
Back Close
Full Screen / Esc
Printer-friendly Version Interactive Discussion
Discussion
P
a
per
|
Dis
cussion
P
a
per
|
Discussion
P
a
per
|
Discussio
n
P
a
per
|
combinations of the real and the imaginary part of the complex refractive index may accidentally yield the same size averaged value forσext. When analysing e.g. the black and red traces in the bottom panel of Fig. 9, the first interference maximum is shifted to a largerxfor the computation withn=1.41 andk=0.01 compared to that withn=1.69 andk=0.058. Both traces first intersect at aboutx=4.5 which roughly corresponds to
5
the centre of the volume size distribution of the dust particles. One part of the particle volume is therefore located in a size range corresponding to the extinction maximum of the black trace, and the other half is located in a size range that features the extinction maximum of the red trace, thus overall leading to the same size averaged extinction coefficient for both complex refractive indices.
10
The test calculations shown in Fig. 9 were done for an aerosol number size distribu-tion typically generated when using two impacdistribu-tion stages of the cyclone system. The pronounced global minimum in the rmsabs+ext contour plot (right chart in the top left
part) is conserved down to a wavelength of about 500 nm. Unique retrieval results for bothnandk should therefore be obtained at visible wavelengths but not towards the
15
UV spectral region. The situation is worse for the experiments with just a single im-paction stage. Here, a larger fraction of the dust volume concentration is located in the size regime of the first interference maximum already at λ=0.5 µm, thereby not enabling a unique retrieval of bothnand k. We have therefore devised an alternative retrieval approach as outlined in the following section.
20
4.4 Modified retrieval approach: optimising the measured number size
distributions of the dust particles
In contrast to the imaginary part of the complex refractive index, the real part of the min-eral dust refractive index usually shows less variation with the wavelength in the visible spectral regime. Petzold et al. (2009), for example, have derived almost constant n
25
values between 1.55 and 1.56 from the analysis of the PSAP data during SAMUM-1. Kandler et al. (2009) report a slight increase of n towards UV wavelengths, yielding
ACPD
11, 21363–21427, 2011Complex refractive indices of Saharan
dust samples
R. Wagner et al.
Title Page
Abstract Introduction
Conclusions References
Tables Figures
◭ ◮
◭ ◮
Back Close
Full Screen / Esc
Printer-friendly Version Interactive Discussion
Discussion
P
a
per
|
Dis
cussion
P
a
per
|
Discussion
P
a
per
|
Discussio
n
P
a
per
literature, M ¨uller et al. (2009) have assumed the real part of the complex refractive in-dex to be 1.53, independent of the wavelength, in order to correct the SOAP absorption measurements for scattering. AERONET retrievals for different desert dust sites have yielded n values ranging from 1.48 to 1.56 (Dubovik et al., 2002a). Addressing our retrieval problem described in the previous section, we might therefore prescribe the
5
nvalue at shorter wavelengths to that deduced at longer wavelengths where a unique retrieval result for bothnand k could still be obtained. At shorter wavelengths, only the imaginary part of the complex refractive index would then be retrieved from the absorption spectrum using the measured number size distribution as input.
When deducing then and k values for the different desert dust samples at longer
10
wavelengths, however, we have observed a significant spread in the averagednvalues that were computed from the set of three to four individual measurements performed during each experiment listed in Table 1. Even for the three samples SAMUM B1, B2, and B3 which have a similar mineralogical composition, the deduced averagedn
values were in the range from 1.35 to 1.65. Since this variation is much larger than
15
that expected from previous literature studies and the mineralogical composition as described above, we attribute it to uncertainties in the size distribution measurements, induced e.g. by inaccurate choices forχ andρPfrom Eq. (1) to combine the SMPS and APS data. These inherent uncertainties associated with the sizing of the dust particles, which are also well-documented in the literature (Reid et al., 2003), would then directly
20
affect the accuracy of the retrievals for the imaginary partk of the complex refractive index. We have addressed this problem as follows.
We chose to prescribe the real part of the complex refractive index to a constant value for all wavelengths in the UV-VIS spectral region. Thereby, the measurement of the extinction spectrum with LOPES became obsolete in the retrieval because only the
25