GERARDO JOSE ZARATE MARTINEZ
MODELING ENVIRONMENTAL NICHES AND POTENTIAL GEOGRAPHIC DISTRIBUTIONS USING A FORMALISM FOR GEOSPATIAL DATABASE
DESIGN
Dissertação apresentada à Universidade Federal de Viçosa, como parte das exigências do Programa de Pós-Graduação em Ciência da Computação, para obtenção do título de Magister Scientiae.
VIÇOSA
Ficha catalográfica preparada pela Biblioteca Central da Universidade Federal de Viçosa - Câmpus Viçosa
T
ZARATE MARTINEZ, GERARDO JOSE, 1988-Z36m
2014
Modeling Environmental Niches and Potential Geographic Distributions Using a Formalism for Geospatial Database Design / GERARDO JOSE ZARATE MARTINEZ. – Viçosa, MG, 2014.
vii, 58f. : il. (algumas color.) ; 29 cm.
Inclui apêndices.
Orientador: Jugurta Lisboa Filho.
Dissertação (mestrado) - Universidade Federal de Viçosa. Referências bibliográficas: f.53-58.
1. Banco de dados - Modelagem conceitual. 2. Ecologia. 3. Distribuição geográfica. I. Universidade Federal de Viçosa. Departamento de Informática. Programa de Pós-graduação em Ciência da Computação. II. Título.
ii
ACKNOWLEDGMENTS
iii CONTENTS
1
LIST OF FIGURES ... iv
LIST OF ABBREVIATIONS ... v
RESUMO ... vi
ABSTRACT ... vii
1 INTRODUCTION ... 1
1.1. Hypothesis ... 2
1.2. Objectives ... 2
1.3. Thesis Structure ... 3
2 PAPERS ... 5
2.1. Paper I: Conceptual modeling for environmental niches and potential geographic distributions using UML GeoProfile ... 6
2.2. Paper II: Modeling and Implementation of a Geospatial Database for Environmental Niches and Potential Geographic Distributions ... 21
2.3. Paper III: Development of a Geospatial Database for Environmental Niches and Potential Geographic Distributions ... 30
3 OVERALL CONCLUSIONS ... 46
APPENDIX A ... 48
APPENDIX B ... 51
iv
LIST OF FIGURES
Paper I
Figure 1 - BAM Diagram for representing the fundamental niche (SOBERÓN, 2005). 11
Figure 2 - Pictograms used in UML GeoProfile (LISBOA FILHO et al., 2013). ... 14
Figure 3 - Representations of occurrence data of a species (a), occupied area (b) and multiple representations of temperature (c). ... 15
Figure 4 - Representation of environmental niches ... 17
Figure 5 - Possible environmental variables of an n-dimensional hypervolume. Multiple representations allow the use of different types of data sources. ... 18
Figure 6 - Potential Geographic Distribution. The evaluated region is modeled as polygon and the distribution as a grid of cells. ... 19
Paper II Figure 1 - MDA CIM level for Environmental Niches and Potential Distributions ... 24
Figure 2 - MDA PIM level. ... 25
Figure 3 - MDA PSM level using PostgreSQL and PostGIS... 26
Figure 4 - A possible potential geographic distribution of M. urundeuva. ... 28
Figure 5 - Usage of the tool raster2pgsql. ... 28
Paper III Figure 1 - Pictograms used in UML GeoProfile (LISBOA-FILHO et al., 2013). ... 35
Figure 2 - MDA CIM level for Environmental Niches and Potential Distributions. ... 37
Figure 3 - MDA PIM level for Environmental Niches and Potential Distributions. ... 39
Figure 4 - MDA PSM level using PostgreSQL and PostGIS... 40
Figure 5 - Usage of shp2pgsql (a) and raster2pgsql (b) ... 41
Figure 6 - Users interfaces to insert occurrence data (a) and raster files (b) ... 42
v
LIST OF ABBREVIATIONS
API Application Programming Interface ATL Atlas Transformation Language
CASE Computer Aided Software Engineering CIM Computation Independent Model DBMS Database Management System ER Entity-Relationship
GARP Genetic Algorithm for Rule Set Production GBIF Global Biodiversity Information Facility
GeoOOA Object-Oriented Analysis for Geographic Information Systems GIS Geographic Information System
ISO International Organization for Standardization
MADS Modeling of Application Data with Spatio-temporal features MDA Model-Driven Architecture
OGC Open Geospatial Consortium OMT Object-Modeling Technique
OMT-G Object-Oriented Data Model for Geographic Applications OOA Object-Oriented Analysis
vi RESUMO
ZARATE MARTINEZ, Gerardo José, M.Sc., Universidade Federal de Viçosa, Maio 2014. Modelando nichos ambientais e distribuição geográfica potencial utilizando um formalismo para projeto de bancos de dados geoespaciais. Orientador: Jugurta Lisboa Filho. Coorientador: Carlos Frankl Sperber.
Pesquisas referentes a nichos ecológicos e distribuições geográficas potenciais têm aumentado nos últimos anos. A definição do nicho ecológico de uma espécie auxilia no processo de predição de regiões com distribuição geográfica potencial, as quais podem ser usadas para extrapolar possíveis distribuições desta espécie, auxiliando estudos sobre mudanças climáticas, mapeamento de espécies invasoras, dentre outros. A distribuição geográfica potencial de uma espécie é calculada por meio de algoritmos computacionais que têm como entrada os dados sobre ocorrências desta espécie, da definição de seu nicho ecológico e dados sobre camadas de cobertura ambiental. O objetivo desta pesquisa é elaborar um esquema conceitual de dados capaz de modelar as entidades envolvidas em nichos ecológicos e distribuições geográficas potenciais, para posteriormente ser transformado em um esquema de implementação em um banco de dados. Para a construção do esquema conceitual, é necessária a utilização de um formalismo dedicado a modelagem de bancos de dados geográficos. Esta dissertação propõe um esquema conceitual de dados para nichos ecológicos e distribuições geográficas potenciais usando o formalismo UML GeoProfile. O esquema conceitual de dados foi transformado em código de aplicação usando a abordagem Model Driven
Architecture. O esquema foi finalmente implementado em um Sistema de
vii ABSTRACT
ZARATE MARTINEZ, Gerardo José, M.Sc., Universidade Federal de Viçosa, May 2014. Modeling Environmental Niches and Potential Geographic Distributions using a formalism for Geospatial Databases Design. Adviser: Jugurta Lisboa Filho. Co-Adviser: Carlos Frankl Sperber
1
1
INTRODUCTION
Ecological niche and potential geographic distributions are fields of study in Ecology that have been of major research interest in the last years (PETERSON and SOBERON, 2012). Ecological niches are defined by an array of biotic interactions (e.g. competition for food or water) and abiotic conditions (e.g. temperature) in which a species can survive and reproduce (POLECHOVÁ and STORCH, 2008). An environmental niche is constructed only by abiotic conditions (SOBERON, 2007). On the other hand, potential geographic distributions refer to areas or regions that have the appropriate set of conditions for a species to live and reproduce. Potential geographic distributions are usually calculated by mathematical algorithms. These algorithms use environment data and occurrences of a species to make predictions (BLACKBURN, 2010).
Geographic Information Systems (GIS) come in handy for a variety of ecological niche and geographic distribution research topics including climate change projections, species invasion projection, among others (ROURA-PASCUAL et al., 2004; WARD, 2007; PETERSON, 2003; PETERSON and SOBERON, 2012). The benefits of using GIS include spatial data analysis, representation with maps or statistics and management through relational databases (BLACKBURN, 2010). There exist many researches involving ecological niches and potential geographic distributions. However, few of them take into consideration the construction of dedicated databases (KEET, 2006).
2
As mentioned before, there are many researches and projects related to study ecological niches and potential geographic distributions. However, most of them focus on defining the ecological niche or projecting geographic distributions of species. These definitions and projections can be carried out with computation applications using geospatial data, which are usually stored in different files. The purpose of this research is to model the entities, relationships and spatial phenomena of environmental niches and potential geographic distributions using a conceptual model for geospatial databases. Modeling and implementing a data schema for ecological niches and potential geographic distributions will provide a unified repository that can assist professionals in Ecology and Computer Science, not only in modeling databases but also in other tasks related to ecological niches, as data becomes more useful when modeled with guidelines and standards.
1.1. Hypothesis
Conceptual models for geospatial databases have the necessary characteristics to construct data schemas for environmental niches and potential geographic distribution of species. These conceptual data schemas can be transformed in implementation code using MDA.
1.2. Objectives
Provide an abstract representation of environmental niches and potential geographic distributions in order to develop geospatial databases that contain information used and generated by geographic distribution predictive algorithms.
Specifically, this thesis intends to:
a) Identify entities and relationships of the environmental niche, specifying which ones have geospatial characteristics;
b) Represent environmental niches and potential geographic distributions using a conceptual model for geospatial databases;
3
d) Prepare a study case that shows the modeling process and implementation with real data.
1.3. Thesis Structure
This thesis is presented in the form of a collection of scientific papers produced over the master degree’s length. The thesis contains three scientific papers, all of them written as a part of the master degree’s research project. Two papers were accepted in international conferences, the last one will be submitted to a journal.
The thesis document is structured as follows: Chapter 1 presents an introduction to the content, describing the purpose and objectives of the research. Chapter 2 contains three scientific papers. The first paper describes the proposed conceptual data schema for ecological niches and potential geographic distributions using UML GeoProfile. The second paper contains the development of a Model-Driven Architecture approach of the conceptual data schema of the first paper; it also contains a study case that uses real data and the data schema. Finally, the third paper is an extended version of the first and second papers, presenting an implementation of the data schema in a Database Management System among other additions. Chapter 3 presents some final considerations and conclusions of thesis. This document also contains two Appendices, the first consists of the full implementation code of the data schema and the second contains an overview of the technologies and tools used in the project.
The complete references of the papers contained in this thesis are:
ZÁRATE, G. J.; LISBOA FILHO, J.; SPERBER, C. F. Conceptual modeling for environmental niches and potential geographic distributions using UML GeoProfile. In: INTERNATIONAL CONFERENCE ON ADVANCED GEOGRAPHIC INFORMATION SYSTEMS, APPLICATIONS, AND SERVICES (GEOProcessing), 6., 2014, Barcelona. Proceedings... Nice: IARIA XPS Press, 2014. p. 31-37. ISBN: 978-1-61208-326-1
4
5
2
PAPERS
This chapter contains the three papers written as part of the thesis project. The first paper “Conceptual modeling for environmental niches and potential geographic distributions using UML GeoProfile” presents a review of the most important concepts of Ecological Niche and Potential Geographic Distributions; and presents a Conceptual Data Schema using the formalism UML GeoProfile.
The Second paper “Modeling and Implementation of a Geospatial Database for Environmental Niches and Potential Geographic Distributions” contains the stages of a Model-Driven Architecture (MDA) of the conceptual data schema proposed in the first paper. It also presents a study case in which real data are used to produce a niche model and a geographic distribution, which are later, stored in geospatial database implemented in a Database Management System (DBMS).
6
2.1. Paper I: Conceptual modeling for environmental niches and potential geographic distributions using UML GeoProfile
Gerardo José Zárate, Jugurta Lisboa-Filho and Carlos Frankl Sperber
In: INTERNATIONAL CONFERENCE ON ADVANCED GEOGRAPHIC
INFORMATION SYSTEMS, APPLICATIONS, AND SERVICES (GEOProcessing), 6., 2014, Barcelona. Proceedings... Nice: IARIA XPS Press, 2014. p. 31-37. ISBN: 978-1-61208-326-1
ABSTRACT
An ecological niche is defined by an array of biotic and abiotic requirements that allow organisms to survive and reproduce in a geographic area. Environmental data from a region can be used to predict the potential distribution of a species in a different region. Many formalisms for modeling geospatial information have been developed over the years. The most notable benefit of these formalisms is their focus on a high-level abstraction of reality, leaving unnecessary details behind. This paper presents a conceptual data schema for niches and potential geographic distributions using the UML GeoProfile formalism. The proposed data schema considers the geographic entities and environmental variables involved in the prediction of potential geographic distributions made with ecological niche data.
Keywords: Geospatial database modeling, Ecological Niches, Potential Geographic Distributions.
1 INTRODUCTION
Conceptual models are formalisms that illustrate entities and relationships between them in a diagram representation. These representations are abstractions of the objects and associations of the real world, leaving unnecessary details out. Database design greatly benefits from conceptual modeling as it focuses on a high-level representation without taking into account implementation details (PINET, 2012; LISBOA FILHO et al., 2013)
7
FILHO et al., 2013). These approaches help designers to model databases for almost every human activity.
As Computer Science and technology evolve, there is a necessity to model complex situations in which databases are essential. Databases for Geographic Information Systems (GIS) are a prime example of this. The work of Bédard and Paquette (BÉDARD; PAQUETTE, 1989) was the first to attempt to include geospatial information in database modeling. They proposed an extension of the ER formalism for modeling spatial data. Since then, many researchers have proposed new formalisms for geospatial data (PINET, 2012; MIRALLES et al., 2010).
Those formalisms are capable of representing, at the abstract level, geographic features such as roads, buildings or rivers. Moreover, they are also able to represent environmental variables such as temperature or vegetation. The representation and abstraction of geospatial data benefits professionals and scientists in areas, such as Civil Engineering, Agriculture and Ecology, among others.
The ecological niche and potential geographic distributions are fields of study in Ecology that have been of major research interest in the last years (PETERSON; SOBERÓN, 2012). Ecological niches are defined by an array of biotic interactions and abiotic conditions in which a species can survive and reproduce (POLECHOVÁ; STORCH, 2008). An environmental niche is constructed only by abiotic conditions (SOBERÓN, 2007). On the other hand, potential geographic distributions refer to areas or regions that have the appropriate set of conditions for a species to live and reproduce. Potential geographic distributions are usually calculated by mathematical algorithms. These algorithms use environment data and occurrences of a species to make predictions (BLACKBURN, 2010).
The aim of this paper is to model the entities, relationships and spatial phenomena of environmental niches and potential geographic distributions using a conceptual model for geospatial databases, providing a baseline for the design and implementation of repositories containing ecological niches and potential distribution data.
8
Section V presents a conceptual data schema for environmental niches and potential geographic distributions and briefly discusses an implementation of the data schema. Finally, Section VI provides some final considerations.
2 RELATED WORK
GIS applications work with geographical features (roads, rivers, buildings) as well as with environmental variables (temperature, humidity, soil). As mentioned in Section I, the aim of this paper is to model niche-based geographic distributions using a formalism for modeling geospatial databases. Previous works have attempted to provide means to model niche and geographic distribution information (BLACKBURN, 2010; McINTOSH et al., 2007; SEMWAYO; BERMAN, 2004; KEET, 2006]. This section summarizes prior efforts found in the literature.
Although it does not involve conceptual modeling of geospatial databases, the work in (BLACKBURN, 2010) emphasizes the importance of databases in GIS applications stressing their storage capabilities. Moreover, it provides a six-step guide for using ecological niche to predict potential geographic distributions. Finally, it describes how environmental variables are handled in GIS applications, highlighting the selection of the appropriate GIS data types.
McIntosh et al. (2007) developed a tool that helps ecologists design databases. The focus of their research is to simplify the design process for ecologists with no experience in database theory. They provided previously created templates that help overcome common errors in defining relationships between entities. Models created in their tool can later be exported to a Database Management System (DBMS) like MySQL. The major drawback is the lack of support for geospatial capabilities. Entities cannot be labeled as points, lines, polygons or fields; contrary to conceptual models like those mentioned in Section IV. Even if not directly related to ecological niches or potential distributions, the work in (McINTOSH et al., 2007) is a valuable effort because it recognizes the importance of databases for ecologists.
9
no reference to ecological niche theory, the focus of their study is modeling the relationships between humans and their environment. Again, there is no support for geospatial capabilities.
Finally, Keet (2006) provides an overview of the principal concepts related to ecological niches and presents an Object-Role Modeling (ORM) diagram of the ecological niche. The proposed ORM diagram includes entities, such as species, fundamental niche, realized niche, hyper-volumes and conditions. The work in (KEET, 2006) is an attempt to model ecological niches based on the concepts first introduced by Grinnell (1917) and Hutchinson (1957) from a database conceptual standpoint.
Contrary to the described prior work, the data schema proposed in this paper is constructed around data used in niche-based geographic distributions, using a conceptual model with geographic and environmental capabilities. Ultimately, an implementation of the data schema in a DBMS would be capable of storing the necessary geographic and environmental data of ecological niches and potential geographic distributions. Before introducing the proposed schema, it is important to have basic concepts regarding ecological niches, potential geographic distributions and conceptual model for geographic data, which are discussed in Section III and Section IV.
3 ECOLOGICAL NICHE THEORY
According to (CHASE; LEIBOLD, 2003), the term ecological niche was first introduced by Joseph Grinnell. Grinnell suggested that a species' niche is defined by its habitat requirements (GRINNELL, 1917). This means that a niche is determined by all the environmental variables that enable the survival and reproduction of a species.
A similar definition was given by Hutchinson, who introduced the concept of fundamental niche and defined it as an n-dimensional hypervolume determined by species requirements (POLECHOVÁ; STORCH, 2008; BLACKBURN, 2010; HUTCHINSON, 1957). Hutchinson's definition is a quantitative approach that gives more clarity to the concept and leaves an open door for the development of mathematical techniques (CHASE; LEIBOLD, 2003).
10
Dimensions such as temperature and soil characteristics can be easy to collect, while other variables like the diet of an organism are, in some cases, not accessible. Additionally, certain dimensions can be irrelevant to determine the fundamental niche (POLECHOVÁ; STORCH, 2008; HUTCHINSON, 1957).
The dimensions of the hypervolume can be classified as conditions and resources. Resources are consumed or used, which might lead to competition between organisms of the same or different species. Differently, conditions are environmental (abiotic) variables, such as temperature, precipitation and terrain aspect, among others (SOBERÓN, 2007).
Depending on the dimensions considered, ecological niches can be classified as Grinnellian or Eltonian. Grinnellian niches (also referred as environmental niches) consider only environmental variables, which are, in most cases, considered scenopoetic, i.e., not affected by organisms. On the other hand, Eltonian niches focus on resources and relationships between organisms. The concept of n-dimensional hypervolume can be applied to both Grinnellian and Eltonian niches (SOBERÓN, 2007). This paper, considers only environmental niches, as their data sets are becoming more available and data sets for Eltonian niches are still difficult to obtain (SOBERÓN, 2007). Furthermore, data from environmental niches are more related to predictions of geographic distributions, which are also in the scope of this paper (BLACKBURN, 2010).
11
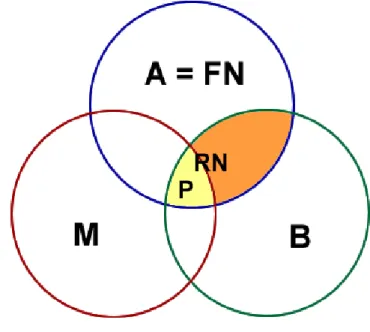
expression of the fundamental niche). The circle B is the area with suitable combination of interacting species. The intersection of A and B denotes the geographical extent of the realized niche. Circle M holds the regions accessible to the species. Finally, the overlapping region of A, B and M represents the geographic distribution.
Figure 1 - BAM Diagram for representing the fundamental niche (SOBERÓN, 2005).
Additionally to the actual geographic distribution, potential geographic distributions are regions with suitable conditions for species to survive, i.e., the geographical extent of the fundamental niche (BLACKBURN, 2010; WARD, 2007). Usually, data from species distribution (occurrences and environmental variables) are used in mathematical algorithms to predict potential geographic distributions (BLACKBURN, 2010; WARD, 2007; DE MEYER et al., 2010; PETERSON, 2003). The inputs for these algorithms are a set of occurrence data and environmental variables for both occupied and evaluated area. Outputs, on the other hand, are either regions with suitable conditions in which species are present (the intersection P of the three regions of the BAM diagram), or regions with suitable conditions where organisms are not present (areas representing the fundamental niche A minus P in the BAM diagram) (SOBERÓN, 2005).
12
significantly. There are several uses for niche related concepts in the literature including climate change projections, potential geographic distributions, species invasion projections, niche characterization, niche diversification, niche construction and habitat-suitability, among others (PETERSON; SOBERÓN, 2012; SOBERÓN, 2007; PETERSON, 2003; LALAND; BOOGERT, 2010; JIMÉNEZ-VALVERDE et al., 2011; HIRZEL et al., 2002].
4 CONCEPTUAL MODELS FOR GEOSPATIAL DATABASES
Over time, computational systems have become more robust and sophisticated; hence, there is a necessity to handle complex data such as geospatial information. One of the major elements of a GIS is a database in which information is stored. Modern DBMS software, such as Oracle and PostgreSQL, have capabilities to manage geospatial data and provide additional benefits like security, redundancy or user control access.
Database designing has three basic stages (ELMASRI; NAVATHE, 2010): conceptual, logical and physical. The conceptual stage produces data schemas that represent a high-level abstraction of entities and relationships between them. The major benefit of using conceptual models is their independence of implementation details, which is the reason of their usage in Computer Science fields such as Databases. Notable conceptual models used in database modeling are the ER Model, OOA, OMT and the UML (LISBOA FILHO et al., 2010; CHEN, 1976).
The work in (BÉDARD; PAQUETTE, 1989) was the first attempt to create a conceptual model (formalism) dedicated to model geospatial databases from a conceptual standpoint. Bédard and Paquette proposed a geospatial extension of the ER formalism. Thenceforth, many researchers and professionals have proposed new methods or extended previous ones. Conceptual models for geospatial databases assist in the process of modeling geographical features as they are modeled as perceived by humans (BORGES et al., 2001). Moreover, the studies in (PARENT et al., 1998) and (BÉDARD et al., 1996) state that geospatial formalisms allow reduction in the number of entities and relationships without losing semantics.
13
Pinet (2012), there are seven major goals shared by formalisms dedicated to model geospatial data:
Representing basic geospatial objects such as points, lines, polygons, multiple points, multiple lines or multiple surfaces.
Modeling geospatial relationships between objects. Examples of relationships are adjacency, overlap and disjoint.
Description of the evolution of objects over time.
Modeling objects that might have multiple representations depending on the geographical scale.
Description of objects with uncertain boundaries or positions, for instance floods or areas of pollution.
Representation of continuous geospatial data that can be measured in any location of the study area.
Modeling structured networks.
Usually, formalisms use pictograms to improve readability and to simplify the model (MIRALLES et al., 2010). A pictogram is a graphic symbol that resembles the real object that is being modeled. Fig. 2 shows the pictograms used in UML GeoProfile (LISBOA FILHO et al., 2013). Notice that the pictograms cover most of the goals proposed in (PINET, 2012).
Comparing the various formalisms specialized in geospatial data is not in the scope of this paper. For a comparison and overview of different formalisms, refer to (PINET, 2012; LISBOA FILHO et al., 2010; MIRALLES et al., 2010).
4.1 UML GeoProfile Overview
14
Additionally, UML GeoProfile can be implemented in any Computer Aided Software Engineering (CASE) tool with UML profiles support.
Figure 2 - Pictograms used in UML GeoProfile (LISBOA FILHO et al., 2013).
The principal motivation behind UML GeoProfile was the standardization of previous models. To accomplish this, UML GeoProfile took the best offerings from different models and brought them together. As other formalisms, UML GeoProfile takes advantage of pictograms to simplify the model. In UML GeoProfile, pictograms are modeled as stereotypes. A UML stereotype allows designers to extend the terminology of UML in order to create new constructors (LISBOA FILHO et al., 2010; LISBOA FILHO et al., 2013). Furthermore, UML GeoProfile takes advantage of UML packages to divide schemas in geospatial themes, e.g., vegetation, relief or hydrography. This characterizes related entities and provides better organization.
15
5 REPRESENTING ENVIRONMENTAL NICHES AND POTENTIAL
DISTRIBUTIONS USING UML GEOPROFILE
This section describes how to model environmental niches and potential geographic distributions using UML GeoProfile as an MDA's Computational Independent Model (CIM). First, we illustrate the representation of individual entities, and, then, we propose an approach to represent environmental niches and potential geographic distributions in three packages that form a single database schema.
5.1 Basic representations
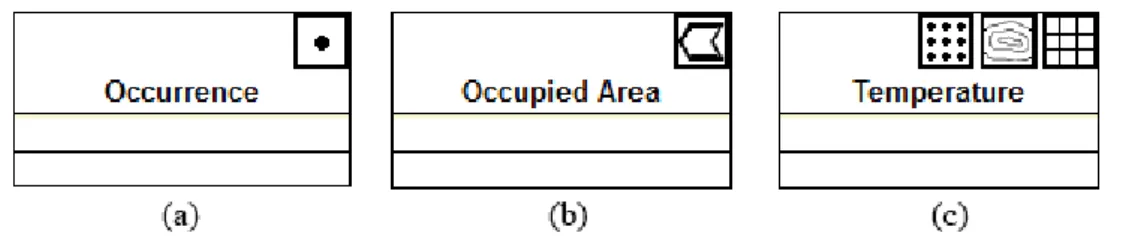
As stated in Section IV, UML GeoProfile uses stereotypes to represent geospatial entities (classes in UML). For instance, the Point stereotype is used to represent trees or occurrence data while the Polygon stereotype represents geographic areas such as cities or forests. Moreover, UML GeoProfile provides stereotypes to represent continuous data such as humidity and temperature. Fig. 3 exhibits a representation of occurrence data of species (a), the occupied area in which organisms live (b) and temperature (c) employing UML GeoProfile.
Figure 3 - Representations of occurrence data of a species (a), occupied area (b) and multiple representations of temperature (c).
16 5.2 Modeling Environmental Niches
Predictive algorithms such as the Genetic Algorithm for Rule-Set Prediction (GARP) (STOCKWELL, 1999) work with a set of occurrence data and an array of environmental variables of a given area to predict geographic distributions. A range is defined for each variable (minimum and maximum values) to construct an n-dimensional hypervolume that restricts the conditions in which organisms can survive.
Being a generic modeling approach, it is necessary to build a schema that supports data from different species and multiple regions occupied by organisms of the same species. Each region has its own hypervolume defined by an array of environmental variables. Furthermore, the amount of variables can also vary from region to region.
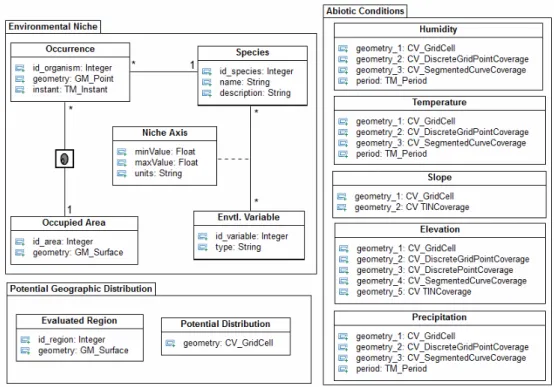
Fig. 4 presents the proposed conceptual data schema for environmental niche data. Notice that the entities and their relationships are based on the literature for ecological niches and potential geographic distributions referenced in Section III. An occupied area (modeled with the Polygon stereotype) has one or multiple occurrences of a species. The relationship between the Occupied Area and Occurrence classes is modeled as a spatial relationship In, indicating that a species occurrence is inside a region. The term “occurrence” is preferred over “organism” because the schema does not consider particular characteristics of organisms such as weight or age. The organism's location (covered by the Point stereotype) is the most important piece of information. In addition, the schema does not take into consideration organisms’ movement. For that reason, an occurrence is related to not more than one occupied area. However, an organism can be identified in two or more areas over a period of time. Although an occurrence can represent the same organism, it is still related to at most one region in a particular moment. To solve the relationship's lack of congruence, the Temporal Object stereotype is also assigned to the Occurrence class. This allows an organism to be related to other regions in a different moment in time.
17
An association class is defined for each association between the two classes, indicating the units (ratio, degrees, inches) and the minimum and maximum values of a particular variable. This approach presents a limitation: it is incapable of modeling relationships between dimensions of the hypervolume, e.g., if the temperature is higher than 30◦C, then the humidity must be between 90% and 99% (GRINNELL, 1917). These relationships depend entirely on the environmental variables and their variation. Consequently, it is difficult to predict and model them. Analytical tools or algorithms handle the relationships as rule sets used to predict geographic distributions (BLACKBURN, 2010; PETERSON, 2003).
Notice that in Fig. 4, a GeoField stereotype is not assigned to the Environmental Variable class as it was previously suggested. The reason behind this is that GeoObject classes (points, lines, polygons) and GeoField classes belong to different views of the reality and usually there are not topological relationships between classes of two different views (LISBOA FILHO et al., 2013). That said, the lack of stereotype for the class is a non-issue. In order to construct a hypervolume it is only necessary to know the variable type and its range. Nevertheless, it is also important to provide a manner of including in the model the field from which the hypervolume data were extracted.
18
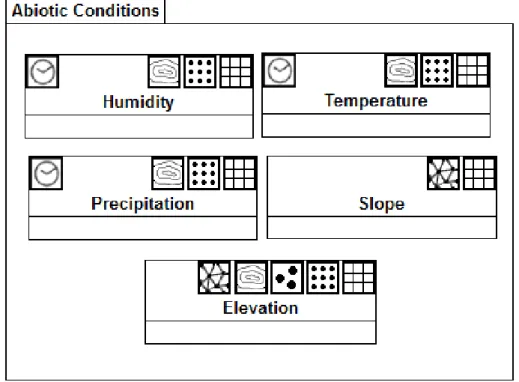
Figure 5 - Possible environmental variables of an n-dimensional hypervolume. Multiple representations allow the use of different types of data sources.
As mentioned before, the amount of dimensions in a hypervolume is potentially infinite. Hence, the final model strictly depends on the study case. Fig. 5 provides an example of the possible representation of the environmental dimensions (abiotic conditions) of a hypervolume. Notice the presence of the Temporal Object stereotype in some classes, meaning that certain abiotic conditions can vary over time, e.g., the monthly average temperature of a region.
5.3 Representing Potential Geographic Distributions
Predictive algorithms and tools operate with occurrence data and environmental variables to produce potential geographic distributions of a species (regions where organisms can live or survive) usually in the form of a grid of cells (BLACKBURN, 2010; WARD, 2007). Fig. 6 shows the classes related to the potential distribution.
19
distributions for Mexico (evaluated region); similar researchers are found in (WARD, 2007) and (PETERSON, 2003). Evidently, environmental data from the evaluated region are also needed. These data are modeled in the same manner as the environmental dimensions of the niche hypervolume (refer to Fig. 5).
Figure 6 - Potential Geographic Distribution. The evaluated region is modeled as polygon and the distribution as a grid of cells.
Notice that the Evaluated Region and Potential Distribution classes are not associated because they belong to different views. Additionally, there is no relationship between a species (or its organisms) and the evaluated regions. Even if organisms occupy the latter, there is no evidence of a topological relationship.
Finally, it is inevitable to acknowledge the necessity to link the field view classes (both abiotic conditions and Potential Distribution classes) to their corresponding region. This can be done through metadata that describes details such as coverage area or how and when data were obtained.
5.4 Implementation of the data schema
20
The results generated by one of the algorithms included in openModeller were later stored in the data schema using basic SQL statements and tools designed to load geospatial information into a PostgreSQL database. QuantumGIS and other GIS software with geographic analytical capabilities can be used to retrieve the information stored in the database (information can be filtered by species, area of interest, among others). This provides the benefit of having data for multiple species stored in a single place instead of different files. Furthermore, our approach can exploit all the advantages of a DBMS.
6 CONCLUDING REMARKS
This paper presented a conceptual data schema for environmental niches and potential geographic distribution of species. The complete schema consists of the components exhibited in Figures 4, 5 and 6. The major limitations of this approach are the lack of support for relationships between dimensions of the niche's hypervolume and the inability to model classification values such as vegetation type. Both limitations are handled by predictive algorithms in a form of rule sets generated from the abiotic layers.
The geospatial and temporal phenomena of the schema are modeled using UML GeoProfile stereotypes. UML GeoProfile was preferred over other formalisms for its capacity to model both object and field phenomena, as well as for the implementation of international standards, and MDA adoption. The proposed conceptual data schema represents no more than the CIM stage of the MDA. Future work includes implementation of the remaining MDA stages and development of a study case with real data.
ACKNOWLEDGEMENTS
21
2.2. Paper II: Modeling and Implementation of a Geospatial Database for Environmental Niches and Potential Geographic Distributions
Gerardo José Zárate, Jugurta Lisboa-Filho, Carlos Frankl Sperber, Flavia Maria da Silva Carmo
In: INTERNATIONAL CONGRESS ON ENVIRONMENTAL MODELLING AND SOFTWARE (IEMSS), 7, 2014, San Diego, California, USA. Proceedings… 2014. To Appear.
ABSTRACT
The ecological niche of a species is defined by an array of biotic and abiotic requirements that allow organisms to live and reproduce in a geographic region. Abiotic data from the ecological niche in combination with occurrence data can be used to predict the potential geographic distribution of a species in different regions. Potential geographic distributions are useful in predicting the extent of invasive species, predict distributions as preparation for climate change and find appropriate regions for endangered species, among others. Geographic entities and environmental variables can be represented with a high-level abstraction in diagrams using formalism dedicated to model geospatial databases. The schemas produced by these formalisms can later be transformed into implementation code using software design approaches such as the Model-Driven Architecture (MDA). This work describes the stages of MDA to generate geospatial databases for ecological niches and potential geographic distributions data. The paper also presents a study case, estimating the potential distribution of the tree
Myracrodruon urundeuva, to show how professionals and researches can use the
proposed schema to implement a repository for ecological niche and potential distributions data.
Keywords: Environmental niche, Potential Geographic Distributions, Model-Driven Architecture, Conceptual Modelling, Myracrodruon urundeuva.
1 INTRODUCTION
22
Over the past few years, scientists and researchers have been modeling ecological niches in order to predict distributional areas (also known as Potential Geographic Distributions) of certain species (SOBERÓN, 2007). Potential Geographic Distributions are useful to predict scenarios of climate change projection, outbreak of diseases, and invasion of species, among others (BLACKBURN, 2010; PETERSON; VIEGLAIS, 2001).
Mathematical tools, such as BioMaper and the Genetic Algorithm for Rule-Set Production (GARP), use occurrence data of a species and a set of environmental layers as inputs to model the ecological niche and project possible distributions of the species (ORTEGA-HUERTA; PETERSON, 2008). Both inputs and outputs can be imported into a Geographic Information System (GIS), such as QuantumGIS, to display the data or to perform further analysis. Unfortunately, tools, like the mentioned before, work with separate files and do not provide a unified repository.
The final aim of our work is to implement a unified repository for ecological niches (represented by an n-dimensional hypervolume) and potential geographic distribution of species in a Database Management System (DBMS) with geospatial capabilities, i.e., with means to handle geographic information. To accomplish this, first we need a conceptual data schema capable of representing environmental and geographic data, that capability is the major advantage over other attempts to model niches and distribution data from a conceptual standpoint. To construct the data schema we used UML GeoProfile, a formalism dedicated to model geospatial databases from a conceptual standpoint, and its support to the Model Driven Architecture (MDA) approach (LISBOA-FILHO et al., 2013). An implementation of the proposed data schema would be capable of storing the inputs and outputs of mathematical algorithms, such as GARP.
The rest of this paper is structured as follow. Section 2 reviews related works. Section 3 describes the stages of the MDA approach to implement a geospatial database. Section 4 presents a study case, in which we use available data for the
Myracrodruon urundeuva species and environmental layers to estimate an ecological
23 2 RELATED WORK
Previous studies have attempted to provide means to model niche and geographic distribution information from a conceptual standpoint. This section summarizes prior efforts found in the literature regarding databases as well as other works related to projections of potential geographic distributions.
Blackburn (2010) emphasizes the importance of databases in GIS applications stressing their storage capabilities. Moreover, Blackburn (2010) provides a six-step guide for using ecological niche data to predict potential geographic distributions using the GARP algorithm. The Canopy Database Project (MCINTOSH et al., 2007) is a tool developed to help ecologists to design databases. The focus of this work is to simplify the design process for ecologists with no experience in database theory. Models created in this tool can later be exported to a DBMS. OntoCrucible was developed as a framework to provide guidelines for representing ecological niches in a conceptual model (SEMWAYO; BERMAN, 2004). The authors propose an ontological engineering approach to model ecological data; the focus of their study is modeling the relationships between humans and their environment. Keet (2006) presents an Object-Role Modeling (ORM) diagram of the ecological niche. The proposed ORM diagram includes entities such as species, conditions, hyper-volumes, fundamental niche and realized niche.
24
3 DATA SCHEMA FOR ENVIRONMENTAL NICHES AND POTENTIAL GEOGRAPHIC DISTRIBUTIONS USING MDA
Zárate et al., (2014) proposed a conceptual data schema for environmental niches and potential geographic distributions using the formalism UML GeoProfile (Lisboa-Filho et al., 2013). Being an extension of the Unified Modeling Language (UML), UML GeoProfile uses classes, associations (relationships) and other UML features. UML GeoProfile was preferred over other formalisms for its capacity to model both object and field phenomena, as well as for the implementation of international standards. Other characteristic of UML GeoProfile is its support of the MDA approach. MDA is a design technique that emphasizes the use of models in the software development process (MELLOR et al., 2002). In MDA, software is first modeled in a Computation Independent Model (CIM); CIM models are later transformed to a Platform Independent Model (PIM). The third stage of the process is the Platform Specific Model (PSM), which is later converted to implementation code. Details of UML GeoProfile and other formalisms for geospatial databases can be found in Lisboa-Filho et al. (2013) and Pinet (2012).
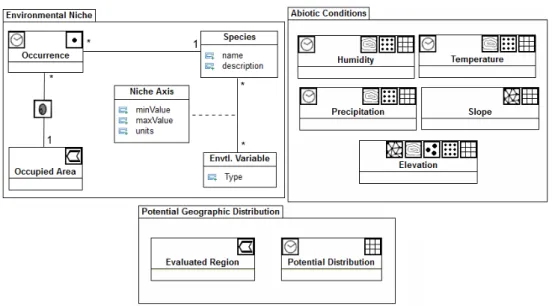
Figure 1 shows the CIM stage of the conceptual data schema modeled using UML GeoProfile. Some classes are marked with a pictogram (stereotypes in UML GeoProfile), which indicates a class being geospatial (polygon, point, field objects) or affected by time (temporal objects).
25
Occurrences of a species are modeled as geospatial points that are inside a specific area. It is possible to spot the same organism in two or more areas in a different time; this is solved by assigning the Temporal Object stereotype to the Occurrence class, this indicates the instant in which the organism was spotted. Dimensions of the hypervolume are represented with the class Niche Axis, which is dependent of the relationship between the Species and the Environmental Variable classes. Multiple instances of the
Niche Axis class form the n-dimensional hypervolume of a species.
Environmental data in the form of GIS coverage types are shown in the package
Abiotic Conditions. These conditions can be stored in a variety of GIS types, such as
TIN, Grid of Points and Grid of Cells, among others. Those types are specified with the UML stereotypes (pictograms). Notice that there is not relationship between geographic areas and coverage layers, the reason behind this is that they belong to different conceptual views (Geographic Objects and Fields) and there is no topological relationship between them. Finally, the Evaluated Region and Potential Distribution classes (i.e. the potential distribution of the evaluated region of interest) are modeled as Polygon and Grid of Cells respectively. Further explanation of the CIM stage is presented in Zárate et al. (2014).
26
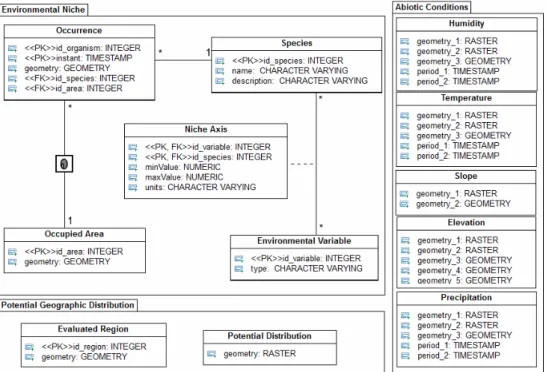
The next level of abstraction is the PIM level, which is still independent of any implementation technologies. The transformation process from CIM to PIM consists in the inclusion of identifiers that differentiate the instances of a class and the use of standard ISO types. UML GeoProfile stereotypes change to ISO data types, e.g., the Polygon stereotype is transformed to a GM_Surface attribute (LISBOA-FILHO et al., 2013). Figure 2 exhibits the PIM level of MDA.
Finally, for a PSM model it is necessary to use a technology capable of storing geospatial phenomena. Some wide known technologies are Oracle Spatial and PostgreSQL (with the PostGIS geospatial extension), both able to store and manage geospatial data. Figure 3 exhibits the PSM level of the proposed schema using PostgreSQL and PostGIS. The PSM level presents implementation details like the use of Primary and Foreign Keys. Notice the use PostgreSQL specific basic data type such as NUMERIC or CHARACTER VARYING. ISO standard geospatial types are transformed to PostGIS implementations, e.g., the GM_Surface ISO type is transformed to the generic GEOMETRY type. The PSM stage can later be implemented in PostgreSQL using basic SQL statements.
27 4 STUDY CASE AND IMPLEMENTATION
As mentioned before, one of the applications of the potential geographic distributions is the projection of the geographic extent of invasive species.
Myracrodruon urundeuva is a native Brazilian tree that grows in the northeast,
southeast and central-west regions of Brazil. M. urundeuva has both economic and medical importance: it is a high-quality hardwood that can be used in constructions and its tannins are useful in pharmacology (CARMELLO-GUERREIRO; PAOLI, 1999). Furthermore, M. urundeuva has shown potential in therapeutic treatments of neurological disease patients (SOUZA et al., 2007).
Up to the year 2008, M. urundeuva was on the Official List of Endangered Brazilian Flora, which prevents the exploitation of the species. However, in some regions of Brazil there is a notable monodominance (a tree species occupies more than 50% of the forest area), which causes soil erosion, preventing the growth of other species. Furthermore, the monodominance leads to environmental, economic and social damage (MURTA et al., 2012). Therefore, we consider of utmost importance to know which regions have the appropriate environment for M. urundeuva for two reasons. Because it is listed as an endangered species in Brazil; and, contrastingly, because it can potentially be an invasive species if it presents monodominance in the region. We attempt to propagate the usage of potential geographic distribution techniques, combined with the data schema presented in this paper, for professional and researchers interested in the species.
DesktopGarp and OpenModeller are two well-known free tools for ecological niche modeling and geographic distribution predictions. While DesktopGarp is an implementation of the GARP algorithm, OpenModeller offers a wide selection of algorithms, including GARP. For the test presented in this paper, we used OpenModeller as an arbitrary choice. Notice that comparing both tools is out of the scope of this paper.
28
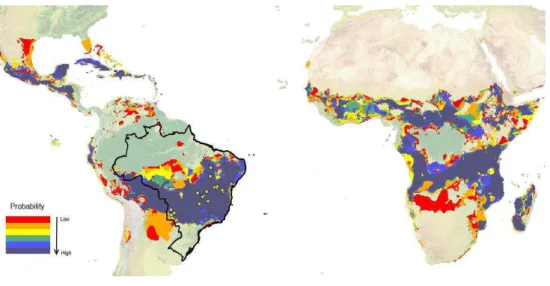
(http://www.worldclim. org/bioclim). WorldClim offers global environmental layers that are commonly used to construct ecological niche models and potential geographic distributions. Figure 4 exhibits the potential geographic distribution obtained with an instance of the GARP algorithm included in OpenModeller. The prediction was made using occurrences within Brazil and global environmental conditions. For illustration purposes, the background shows a relief map instead of a world map.
Figure 4 - A possible potential geographic distribution of M. urundeuva.
Based on some occurrences registered in Brazil, GARP produced an ecological niche model and a potential geographic distribution for the rest of the World. Both inputs and outputs were stored in a data schema, created in PostgreSQL, using basic SQL statements for non-geospatial data and the tools raster2pgsql and shp2pgsql for geospatial data. Figure 5 shows an example of the usage of the tool raster2pgsql via command in a computer console. A detailed reference of PostGIS is available at http://postgis.net/docs/.
Figure 5 - Usage of the tool raster2pgsql.
29
5 CONCLUDING REMARKS
This paper presented the MDA stages of a database design for Ecological Niches and Potential Geographic Distributions of species. The use of MDA provides models with different levels of detail that can be transformed to a variety of lower-end implementations. In this work, we use UML GeProfile for the CIM level and the PSM level was implemented with the data types offered by PostgreSQL and PostGIS, a variation of the PSM level can be implemented with Oracle Spatial. A database implementation provides the benefit of having data for multiple species stored in a single place instead of different files. Furthermore, our approach can exploit all the advantages of a DBMS. We also presented a study case for the ecological niche and potential geographic distribution of M. urundeuva, an important tree species in Brazil that is both an invasive and endangered species. Occurrence data of the species and environmental layers were used as inputs for a predictive algorithm and both inputs and outputs were stored in the proposed data schema. The storage process is carried out with SQL statements and commands in the console of the computer. QuantunGIS or similar software can be used to retrieve the stored data from the database in the form of maps. The models presented in this paper could serve as a starting point for research related to ecological niches and geographic distributions in the Computer Science field. On the other hand, professionals in the field of Ecology may found in this work a suitable introduction to database and GIS technologies. Future work includes the development of software that facilities the storage process for professional and researches that are not familiar with database technologies.
ACKNOWLEDGMENT
30
2.3. Paper III: Development of a Geospatial Database for Environmental Niches and Potential Geographic Distributions
Gerardo José Zárate, Jugurta Lisboa-Filho, Carlos Frankl Sperber, Flavia Maria da Silva Carmo
To be submitted to the journal Environmental Modelling & Software.
ABSTRACT
The ecological niche of a species is defined by an array of biotic and abiotic requirements that allow organisms to live and reproduce in a geographic region. Environmental data in combination with occurrence data of a region can be used to model the ecological niche and to predict the potential geographic distribution of a species. Potential geographic distributions are useful in predicting the extent of invasive species, predict distributions as preparation for climate change and find appropriate regions for endangered species, among others. Geographic entities and environmental variables can be represented with a high-level abstraction in diagrams using formalisms dedicated to model geospatial databases. The schemas produced by these formalisms can later be transformed into implementation code using software-design approaches such as the Model-Driven Architecture (MDA). This work presents a data schema for ecological niches and potential geographic distributions developed with the MDA approach to generate a geospatial database. The data schema was implemented in a Database Management System (DBMS) and then populated with data of the Brazilian tree Myracrodruon urundeuva. A prototype software was developed to facilitate the usage of the data schema to professionals and researches with little knowledge of databases technologies.
Keywords: Environmental niche; Potential Geographic Distributions; Model-Driven Architecture; Conceptual Modelling; Myracrodruon urundeuva.
1 INTRODUCTION
31
and resources. Organisms consume or use resources; which might lead to competition between organisms of the same or different species, e.g., organisms competing for water supply. Differently, conditions are environmental (abiotic) variables such as temperature, precipitation and terrain aspect, among others. Dimensions such as temperature and soil characteristics can be easy to collect, while other variables like the diet of an organism are, in some cases, not accessible. Additionally, certain dimensions can be irrelevant to determine the ecological niche (POLECHOVÁ; STORCH, 2008; KEET, 2006). Depending on the dimensions considered, ecological niches can be classified as Grinnellian or Eltonian. Grinnellian niches (also referred as environmental niches) consider only environmental variables. On the other hand, Eltonian niches focus on resources and relationships between organisms. The concept of n-dimensional hypervolume can be applied to both Grinnellian and Eltonian niches (SOBERÓN, 2007).
Over the past few years, scientists and researchers have been modeling ecological niches in order to predict possible distributional areas (also known as Potential Geographic Distributions) of certain species (SOBERÓN, 2007). Potential Geographic Distributions are useful to predict scenarios of climate change projection, outbreak of diseases, and invasion of species, among others (BLACKBURN, 2010; PETERSON; VIEGLAIS, 2001). Mathematical tools, such as BioMaper and the Genetic Algorithm for Rule-Set Production (GARP), use occurrence data (GIS vector points, i.e., longitude–latitude coordinates) of a species and a set of environmental variables (GIS coverage layers) as inputs to model the ecological niche and project possible distributions of the species (ORTEGA-HUERTA; PETERSON, 2008). Both inputs and outputs can be imported into a Geographic Information System (GIS), such as Quantum GIS, to display the data or to perform further analysis. Unfortunately, tools, like the mentioned before, work with separate files and do not provide a unified repository.
32
data from a conceptual standpoint. To construct the data schema we used UML GeoProfile, a formalism dedicated to model geospatial databases from a conceptual standpoint, and its support to the Model Driven Architecture (MDA) approach (LISBOA-FILHO et al., 2013). An implementation of the proposed data schema would be capable of storing the inputs and outputs of mathematical algorithms, such as GARP. The remainder of this paper is structured as follow. Section 2 reviews related works. Section 3 offers a summary of geospatial database formalisms. Section 4 describes the stages of the MDA approach to implement a geospatial database. Section 5 summarizes the implementation of the data schema and a prototype software to store information in the schema. Section 6 presents a study case, in which we use available data for the Myracrodruon urundeuva species and environmental layers to estimate an ecological niche model and to produce a potential geographic distribution. Finally, Section 7 provides some final considerations.
2 RELATED WORK
Previous studies have attempted to provide means to model niche and geographic distribution information from a conceptual standpoint. This section summarizes prior efforts found in the literature regarding databases as well as other works related to projections of potential geographic distributions.
33
includes entities such as species, conditions, hyper-volumes, fundamental niche and realized niche.
Regarding previous work related to projection of potential geographic distributions, there are several studies that can be taken into account, here we mention only a few of them. Ward (2007) used occurrences and environmental data to predict the geographic extent of invasive ants in New Zealand. Roura-Pascual, et al., (2004) took advantage of the GARP algorithm to predict the potential geographic distribution of Argentine ants in the face of global climate change. Similarly, Blackburn (2010) used the GARP algorithm to project the potential geographic distribution of the Anthrax Agent (Bacillus Anthracis). Finally, Ortega-Huerta and Peterson (2008) compared the results of six algorithms regarding the prediction of the potential geographic distribution of ten Mexican birds.
3 FORMALISMS FOR GEOSPATIAL DATABASES
One of the major elements of a GIS is the database in which information is stored (BLACKBURN, 2010). Modern DBMS, such as Oracle and PostgreSQL, offer capabilities to manage geospatial data and provide additional benefits like security, redundancy or user control access.
Database designing has three basic stages: conceptual, logical and physical (LISBOA-FILHO et al., 2010). The conceptual stage produces conceptual data schemas that represent a high-level abstraction of entities and the relationships between them. The major benefit of using conceptual models is their independence of implementation details. Notable conceptual models used in database modeling are the Entity Relationship Diagrams (ER), Object-Oriented Analysis (OOA), Object-Modeling Technique (OMT) and the Unified Modeling Language (UML) (LISBOA-FILHO et al., 2010).
34
formalisms allows reduction in the number of entities and relationships without losing semantics (BÉDARD et al., 1996).
Bédard et al. (2004) and Lisboa-Filho et al. (2013) highlighted the following formalisms for modeling geospatial information: OMT-G, MADS, GeoOOA, UML-Geoframe, PVL, and UML GeoProfile. Notice that each formalism has its own characteristics and representations. According to Pinet (2012) there are seven major goals shared by almost every formalism dedicated to model geospatial data:
Representation of the basic geospatial objects: points, lines, polygons, multiple points, multiple lines or multiple surfaces. These representations model most geographical features such as streets, buildings, parks and lakes, among others.
Modeling geospatial relationships between objects. Example of relationships are: adjacency, overlap and disjoint.
Description of the evolution of objects over time. Some geospatial features might change over time, for instance, it could be of interest to model the evolution of a city over a certain period.
Modeling objects that might have multiple representations depending on the geographical scale, for instance, a lake represented as a point in a high-level scale and as a polygon in a more detailed scale.
Describing objects with uncertain boundaries or position, for instance, floods or areas of pollution.
Representation of continuous geospatial data (geospatial fields) measured in every location of the study area. Examples of fields are: temperature, soil and elevation, among others.
Modeling structured networks.
35
used in UML GeoProfile (LISBOA-FILHO et al., 2013). Notice that the pictograms cover most of the goals proposed by Pinet (2012).
Figure 1 - Pictograms used in UML GeoProfile (LISBOA-FILHO et al., 2013).
There is no consensus in which formalism is better than the rest. Each formalism has its benefits and disadvantages. For instance, PVL offers more options when it comes to multiple representations, contrary, it is not handy to model continuous fields. On the other hand, UML GeoProfile has a variety of options to represent continuous fields, yet it falls short in representing tridimensional features (PINET, 2012; LISBOA-FILHO et al., 2013). Comparing the various formalisms specialized in geospatial data is not in the scope of this paper. For a comparison and overview of different formalisms, refer to the studies made by Miralles et al. (2010), Pinet (2012), and Lisboa-Filho et al. (2013).
3.1 UML GeoProfile
UML GeoProfile is an UML profile specifically designed as formalism for modeling geospatial databases. UML GeoProfile allows the use of classes, associations, packages and constraints, among other UML features (LISBOA-FILHO et al., 2010). Additionally, any Computer Aided Software Engineering (CASE) tool with support for UML profiles is able to implement UML GeoProfile. The principal motivation behind the development of UML GeoProfile was the standardization of features offered in previous models. To accomplish this, UML GeoProfile took the best offerings from different models and brought them together. Lisboa-Filho et al. (2010) presented a comparison between formalisms and their contributions to UML GeoProfile.
36
geographic distributions. This does not imply that UML GeoProfile is better than other formalism. The characteristics for which UML GeoProfile was chosen over other formalisms are (LISBOA-FILHO et al., 2010; LISBOA-FILHO et al., 2013):
Representation of continuous fields, particularly important for the environmental variables of the ecological niche hypervolume;
Implementation of UML packages to divide schemas in geospatial themes, e.g., vegetation, relief or hydrography. This characterizes related entities (classes) and provides better organization;
Incorporation of pictograms modeled as UML stereotypes. An UML stereotype allows designers to extend the terminology of UML in order to create new constructors;
Implementation of international standards: Geographic Information of the International Organization for Standardization (ISO) and the Open Geospatial Consortium (OGC);
Adoption of a Model-Driven Architecture (MDA) approach to develop databases schemas in separate stages (MELLOR et al., 2002).
4 DATA SCHEMA FOR ENVIRONMENTAL NICHES AND POTENTIAL GEOGRAPHIC DISTRIBUTIONS USING MDA
37 4.1 CIM Level
Zárate et al. (2014) proposed a conceptual data schema for environmental niches and potential geographic distributions using UML GeoProfile. Conceptual data schemas created using UML GeoProfile are equivalent to CIM levels in MDA (LISBOA-FILHO et al., 2013). The three packages presented in Figure 2 represents the CIM level of MDA.
Figure 2 - MDA CIM level for Environmental Niches and Potential Distributions.
The Environmental Niche package covers the classes and associations of an environmental niche. The Occupied Area class is related to various instances of the
Occurrence class, which represents organisms of a species. Notice the topological
relationship between the two classes marked with the Inside stereotype, i.e., an organism must be inside an area. In some cases an organism can be spotted in two or more areas in a different time, this is solved by assigning the Temporal Object stereotype to the Occurrence class. The niche’s hypervolume is represented by multiple instances of the Niche Axis association class (dimension), which cannot exist without the association between the Species and Environmental Variable classes.
38
temperature of a region. Finally, the Potential Geographic Distribution package shows the classes related to distribution projections. The Evaluated Region class represents the boundaries of the area in which the distribution is projected. The Evaluated Region and
Potential Distribution classes are not associated because they belong to different views
(ZÁRATE et al., 2014).
4.2 PIM level
The CIM level was modeled using IMB Rational Software Modeler, a CASE tool that supports the MDA approach. The transformation process from CIM to PIM consists in the inclusion of identifiers that differentiate the instances of a class and the use of standard ISO types (BRODEUR; BADARD, 2008; LISBOA-FILHO et al., 2013). UML GeoProfile stereotypes change to ISO data types, e.g., the Polygon stereotype is transformed to a GM_Surface attribute. Transformation were carried out with ATL, Code 1 shows a transformation rule used to transform the CIM level into PIM. Figure 3 shows the PIM abstraction level of the proposed schema. Notice that classes with multiple representations in the CIM level now contain a geometry attribute for each representation. Additionally, for exhibition purposes, some of the attribute names were changed to ease the reading of the PIM level.
39
Figure 3 - MDA PIM level for Environmental Niches and Potential Distributions.
4.3 PSM level
40
Figure 4 - MDA PSM level using PostgreSQL and PostGIS
5 IMPLEMENTATION
We implemented the PSM level of MDA in PostgreSQL; tables in the schema can be created and used in a straightforward manner, i.e., using basic SQL statements. Code 2 and Code 3 show the create statements to define the Occupied Area and Occurrence tables. Notice that additional fields were included in the table for Occupied Area to store a name and a description.
Tables with geospatial information require the usage of special tools to insert information in them. These tools are shp2pgsql, which is capable of transforming Shapefiles to the GEOMETRY type, and raster2pgsql to convert raster images to the RASTER type. Both shp2pgsql and raster2pgsql can be used via command in a computer console, or as a part of an external application in conjunction with a programming language. Figure 5 shows an example of the usage of the tools shp2pgsql (a) and raster2pgsql (b) via command in a computer console.