Modelization of the Current and Future
Habitat Suitability of
Rhododendron
ferrugineum
Using Potential Snow
Accumulation
Benjamin Komac1*, Pere Esteban2, Laura Trapero1, Roger Caritg1
1Centre d’Estudis de la Neu i la Muntanya d’Andorra, Institut d'Estudis Andorrans (CENMA - IEA), Avinguda Rocafort 21–23, AD600 Sant Juliàde Lòria, Principality of Andorra,2Departament de Geografia Física i Anàlisi Geogràfica Regional, Facultat de Geografia i Història, Universitat de Barcelona, Carrer de Montalegre 6–8, 08001 Barcelona, Spain
*[email protected];[email protected]
Abstract
Mountain areas are particularly sensitive to climate change. Species distribution models predict important extinctions in these areas whose magnitude will depend on a number of different factors. Here we examine the possible impact of climate change on the Rhododen-dron ferrugineum(alpenrose) niche in Andorra (Pyrenees). This species currently occupies 14.6 km2of this country and relies on the protection afforded by snow cover in winter. We used high-resolution climatic data, potential snow accumulation and a combined forecasting method to obtain the realized niche model of this species. Subsequently, we used data from the high-resolution Scampei project climate change projection for the A2, A1B and B1 sce-narios to model its future realized niche model. The modelization performed well when pre-dicting the species’s distribution, which improved when we considered the potential snow accumulation, the most important variable influencing its distribution. We thus obtained a potential extent of about 70.7 km2or 15.1% of the country. We observed an elevation lag
distribution between the current and potential distribution of the species, probably due to its slow colonization rate and the small-scale survey of seedlings. Under the three climatic sce-narios, the realized niche model of the species will be reduced by 37.9–70.1 km2by the end
of the century and it will become confined to what are today screes and rocky hillside habi-tats. The particular effects of climate change on seedling establishment, as well as on the species’plasticity and sensitivity in the event of a reduction of the snow cover, could worsen these predictions.
Introduction
Mountainous regions are biodiversity-rich areas [1], principally due to the pronounced topo-graphical and climatic gradients that exist over short distances [2]. Their endemic diversity is OPEN ACCESS
Citation:Komac B, Esteban P, Trapero L, Caritg R (2016) Modelization of the Current and Future Habitat Suitability ofRhododendron ferrugineumUsing Potential Snow Accumulation. PLoS ONE 11(1): e0147324. doi:10.1371/journal.pone.0147324
Editor:Han Y.H. Chen, Lakehead University, CANADA
Received:April 1, 2015
Accepted:December 31, 2015
Published:January 29, 2016
Copyright:© 2016 Komac et al. This is an open access article distributed under the terms of the
Creative Commons Attribution License, which permits unrestricted use, distribution, and reproduction in any medium, provided the original author and source are credited.
Data Availability Statement:Climatic data used in the manuscript are free third-party data and they can be found here:http://opengis.uab.es/wms/ACDA/ index.htm.
Funding:The authors received no specific funding for this work.
highly vulnerable to climate change [3] since small changes can have serious consequences [4]. Thus, the conservation of their biodiversity has become an important challenge in these regions [5]. Species distribution models (SDMs) [6] based on the evaluation of species’bioclimatic niches are often used to explore plant and animal distributions because they can be applied to conservation tasks in mountain areas where climatic gradients are particularly appropriate for assessing species’responses to climate [7,8].
The recent use of SDMs in climate change analyses has shown that there is an important risk of species extinction throughout the planet; the impact of climate change on species suit-ability, and on abundance and extinctions rates will determine the magnitude of future change [9,10]. Although an increase in species diversity is to be expected in alpine and subnival vege-tation belts as a consequence of upward shifts by vegevege-tation (see [11]; and reference therein), climate change still represents an important extinction risk for species and will lead to the loss of suitable habitats and the reduction of dispersal opportunities [12,13]. In the Pyrenees, for example, the predicted responses to climate change in mountain areas include the upward migration ofPinus uncinata, the most abundant conifer in this cordillera [14], an upstream colonization by the freshwater fishBarbus barbus[15], an important decline in climatically suitable habitat for the lycaenid butterflyLycaena helle[16] and a little or no shrinkage in the distribution of the at-risk endemic Pyrenean desmanGalemys pyrenaicus[17]. These differing predicted responses by animal and plant species to climate change are directly related to each species’sensitivity to climate change and so a general consideration of species-specific ecologi-cal niches is liable to reveal useful trends [18].
In this work, we examine the possible impact of climate change on the habitat suitability of the shrubRhododendron ferrugineum, the alpenrose, in Andorra (Eastern Pyrenees). This spe-cies’particularity is its dependence on snow in winter and spring [19,20]. Snow cover is imper-ative for the winter survival of many subalpine species because it allays extreme temperatures that may exceed plant frost tolerance, helps avoid plant desiccation and protects evergreen plants from excessive irradiation (see [20,2]; and references therein). In the case ofR. ferrugi-neum, winter snow cover prevents plant species leaves, buds and roots from freezing, but also permits more efficient photosynthesis, as plant recovery is greater when freezing does not occur [20]. For example, important frost damage is observed in the leaves and flowers of aR.
ferrugineumpopulation when frosts occur during spring—and even in mid-July—and affect, above all, the plant’s flowers (A. Pornoncom.pers.). The conservation of the alpenrose habitat is important as a contribution to the stabilization of insecure eroded mountain soils that har-bour characteristic vascular plants and alpine fungi. This is also a key habitat for the threatened black grouse (Tetrao tetrix) [21] and is one of the heathland habitat types included in the Alpine and Boreal heaths of the European Habitats Directive [22]. In certain French mountain areas, an important decline in snow cover duration is expected to occur by the end of the pres-ent cpres-entury due to climate change [23], which could have negative consequences for the sur-vival of this habitat.
One of the most interesting aspects of SDMs for this study is their ability to assess the effect of climate change on a species realized niche that is mainly dependent on snow cover. Never-theless, the attention paid to date to snow cover in SDMs is relatively poor and models tend to focus on the consequences of changes in the duration of the plant-growing season [24] or of the snowpack [25]. Here, we use the high resolution of the Climatological Atlas of Andorra [26] to compute the potential snow accumulation [27] in order to obtain a more accurate model of the distribution ofR.ferrugineumin Andorra and a more realistic framework for cli-mate change scenario modelling.
disagreements or diverse points of view [28]. This is why, following [28], we use the term‘ real-ized niche model’in this study to determine the habitat suitability map forR.ferrugineumin Andorra. The species realized niche obtained using topographic and climatic variables reveals certain tendencies regarding a species’sensitivity to climate change [29]. Thus, we use potential snow accumulation here to obtain highly accurate models of the bioclimatic suitability ofR. fer-rugineumin Andorra and to acquire useful and important knowledge regarding the responses of this snow-sensitive species to future climate change. In addition, the specific objectives of this study were (1) to confirm the positive effect of the potential snow accumulation on the accuracy of the modelling process; (2) to define the realized niche model ofR.ferrugineumin Andorra in order (3) to determine the habitat suitability ofR.ferrugineumunder different cli-mate change scenarios.
Materials and Methods
Study area
The study was carried out in the Principality of Andorra (eastern Pyrenees), a mountainous country with an altitudinal range from 848 to 2,942 m a.s.l. that extends from 42°25’to 42°39’
N and 1°24’to 1°47’E. The main climate type in Andorra is sub-continental with Mediterra-nean tendencies, although elevated areas of the territory enjoy a cold sub-oceanic climate [30]. Its singular and complex orography and its continentality modify the precipitation regimes in the Mediterranean area and the warm season is also the rainiest season of the year, as shown by the Climatological Atlas of Andorra [26]. Another particularity of the Andorran climate is the penetration of Atlantic air masses from the French side of the Pyrenees, which affect above all the high-altitude areas in the northern half of the Principality and guarantee a six-month snow season (November–April) on the country’s highest peaks [31].
These climatic particularities and its rugged topography guarantee great habitat diversity in the 468 km2of the Principality, of which 248 km2correspond to habitats of Community Inter-est [32] with a predominance of forests (181 km2), subalpine and alpine grasslands (143 km2), screes and rocky outcrops (74 km2) and shrublands (43 km2).
Study species
Rhododendron ferrugineumL. (Ericaceae) is an evergreen shrub with well-branched trailing stems that grows to a height of 70 cm in silica-rich soils. Its leaves have been described as being possibly toxic [33], which would explain the lack of mechanical damage caused by livestock to this species.
R.ferrugineumis one of the most abundant shrubs in the Pyrenees and the European Alps where it has a large geographical range, above all in subalpine and alpine stages at 1500–2500 m a.s.l. [34]. It usually establishes itself on west- and northwest-facing slopes where it finds the most favourable environmental conditions, and tends to colonize extensively grazed mountain areas by outcompeting other species [35]. Its particular facility to colonize is principally due to its ability to reproduce by selfing, outcrossing or large-scale downslope vegetative spread. Thus, this shrub tends to naturally dominate in many subalpine and alpine grasslands in the Pyrenees.
distribution limits in Andorra, of which 100 were where the species was present and 100 where it was absent from the map. Finally, the overall accuracy was calculated using Cohen's kappa coefficient of agreement [38,39], which gave a value ofχ= 0.955, very close to the value for perfect agreement (χ= 1).
Finally, to determine the realized niche model ofR.ferrugineumin Andorra we used a data-set with 2000 randomly distributed presence/absence points (262 presence points, 1738 absence points, at least 200 m apart). Due to Andorra’s small size, and the wide distribution of
R.ferrugineumwithin the country, 80% of the absence points are located less than 2.5 km from aR.ferrugineumpresence point (1400 points), and almost all absence points less than 5 km from a presence point, which gives a more reliable representation of the species habitat suitabil-ity map, as suggested by [40].
Climate data
The meteorological data for the modelling of the realized niche model ofR.ferrugineumwere obtained from the Climatological Atlas of Andorra [26],http://opengis.uab.es/wms/ACDA/ index.htm), which provides high-resolution climate data for Andorra (90 x 90 m grid). High-resolution climate inputs are essential when SDMs are applied to mountain regions as complex topography can lead to uncertainties in the accuracy of species’distribution [41]. We consid-ered the annual mean minimal (Tmin) and maximal (Tmax) temperatures and the annual pre-cipitation (Pann) according to the Atlas for the SDMs; the winter (December, January and February) minimum and maximum temperatures and the winter precipitation data were only used to compute the potential snow accumulation (Psnow) following [27] (Psnow map avail-able in Appendix 1). We used Psnow to estimate snow cover duration since this variavail-able can be implemented into climate change scenario modelling, and because physically based snow dis-tribution models generate quite similar results to remote sensing data (i.e. the snow cover data obtained with SPOT images; [42]).
fact that the research is centred on Andorra, downscaled projections surrounding the Principal-ity (four points) were adopted and averaged for precipitation (snow plus rain) and temperature (maximum and minimum) for the winter period and for the whole year for the reference peri-ods 2021–2050 and 2071–2100. The derived values are shown in Appendix 2.
Climatic and environmental data selection
In addition to the three available climatic variables (Tmin, Tmax and Pann) and the potential snow accumulation, four topographic variables were also considered in the modelization: ele-vation, slope, topographic aspect (cosine transformed) and solar radiation (obtained from the Andorra 10-m spatial resolution DEM).
Multicolinearity is frequent between environmental variables and can cause adverse effects, especially explication or estimation, which can lead to erroneous estimations of model predic-tions [48,49]. The variables explaining over 60% of colinearity (rpairwise0.6) were removed
from the analyses to give a more parsimonious model without collinear predictor variables [50]. Next, the multicolinearity between all the remaining explicative variables was tested with the variance inflation factor (VIF), [51,48] in which the explicative variables with a value over 3 are removed from the analyses [52]. After checking for multicolinearity, only slope, topo-graphic aspect, solar radiation and Psnow were retained.
Spatial autocorrelation
Spatial autocorrelation due to the spatial structure of ecosystems, which cause special relation-ships between the elements that compose them [53], remains an important issue in the spatial prediction of species distribution [54] and can negatively affect the significance of correlation or regression coefficients between explicative and response variables [55,56]. Our sampling meth-ods did not overcome this problem [57] and by using Moran’s test [58] to check for spatial auto-correlation in our dataset we detected significant spatial autoauto-correlation (Moran’s I observed: 0.2449; Moran’s I expected: -0.0005;P<0.001). In addition, we applied Spatial Eigenvector Map-ping (SEVM) to add a new variable to the analysis. SEVM is one of the best methods for resolving the problem of spatial autocorrelation in species distribution models [59]. It is based on the extraction of eigenvectors from a connectivity matrix among spatial patterns, where the eigenvec-tors capture the spatial arrangement of the data points. Given that, each eigenvector represents a particular spatial patterning, the overall eigenvectors describe well the variation in space of the spatial autocorrelation. Eigenvectors permit the spatial arrangement of the data points to be translated into explanatory variables and to be used as predictors of the response variables. They also enable the spatial autocorrelation to be reduced notably [60,59]. We obtained 13 eigenvec-tors from the SEVM computation, which were incorporated into the modelling process.
Modelling framework
Andorra we used five model algorithms available in the Biomod2 library (3.1–25, [65] in R 3.0.2, R Development Core Team, 2013): (1) the generalized additive model (GAM), a regres-sion method [66]; (2) the multivariate adaptive regression splines (MARS), a mix of regression and classification methods [67]; (3) the classification tree analysis (CTA), a classification method [68]; (4) the boosted regression tree (BRT), a boosting algorithm [69] and (5) artificial neural networks (ANN), a machine-learning method [70]. GAM and MARS models are both generalized multiple regressions: GAM permits both linear and complex additive response pat-terns, as well as the combination of the two within the same model as smooth functions, while MARS uses linear regression, a mathematical construction of splines and binary recursive par-titioning (rather than the smoother functions used in GAM) to perform a model with either linear or non-linear relationships between response and predictors [71and reference therein]. The interest of these two methods is that they allow for the modelling of complex relationships between a response variable and its predictors [72]. For the classification and regression tree, the CTA involves rule-based methods that permit the capture of non-additive or complex interactions [71] and reference therein]. The BRT approach combines regression trees with gradient boosting, whereby an initial regression tree is fitted and iteratively improved (boosted) by minimising the variation in the response not explained by the model at each iteration [73]. Classification and regression trees are powerful tools for describing and predicting patterns of complex species distribution with environmental, physical and climatic variables and, more-over, provide coherent and interpretable results [74]. Finally, the ANN machine learning was used because it represents a robust method for modelling bioclimatic envelops that have non-linear responses to predictors [71] and reference therein]. Despite their respective advantages and disadvantages, these modelling approaches are highly useful and precise in the case of bio-climatic models of species distribution, in which the BRT, GAM and ANN methods provide particularly accurate models [73,75].
For each modelling process, four cross-validation repetitions were performed and the data set was randomly split into the training set (70% of the initial data used for model calibration) and into the testing set (the remaining 30% used for model evaluation) to avoid underestimat-ing the model’s accuracy [76]. Then, models were evaluated using the true skill statistic (TSS; [77]) and the area under the receiver operating characteristic curve (AUC; [78]). The AUC is a highly effective measure of the performance of ordinal score models and a threshold-indepen-dent measure of accuracy [29], while the TSS, a threshold-dependent measure of accuracy, has all of the advantages of Cohen's kappa statistic [79] but is not sensitive to prevalence [77]. The jackknife procedure that uses a‘leave-one-out’approach, commonly used in similar studies, was not implemented in this study because this method can generate over-optimistic estimates of predictive power with larger sample sizes [80]. TSS values ranged from–1 to + 1, with–1 corresponding to systematically wrong predictions and +1 to systematically correct predic-tions; TSS values>0.6 are considered to be useful to excellent. AUC scores ranged from 0 to 1, with 0 for systematically wrong model predictions and 1 for systematically perfect model pre-dictions; AUC values>0.8 are considered to be good to excellent. Of the twenty models obtained, we only selected the models that exceeded the thresholds of TSS>0.6 and
AUC>0.8 to compute the global model. Finally, the global model of the distribution ofR.
fer-rugineumin Andorra was computed with the best performing models obtained and the BIO-MOD_Projectionfunction that allows for modelling under future climatic conditions.
Decision threshold
information given in terms of presence/absence will be more practical than if presented as a probability. There are many subjective and objective approaches for determining the thresh-olds when defining‘suitable’and‘unsuitable’areas for the species [81]. While subjective approaches use highly arbitrary criteria, objective approaches are numerous and thresholds are chosen to maximize the agreement between observed and predicted distributions. The com-monly used kappa maximization approach [81,82] is not as good as the prevalence, average-predicted or sensitivity-specificity-combined approaches [81]. Following [81] and [83], we also used the mean of the threshold values to obtain two sensitivity-specificity-combined
approaches: the sensitivity-specificity sum maximization approach [84,83] and the sensitivity-specificity equality approach [84].
The contribution of Psnow in the prediction of
R
.
ferrugineum
distribution
For the global realized niche model ofR.ferrugineum, the importance of the four explanatory variables were calculated using the correlation between the global prediction and the prediction made with a randomized variable, where the importance of the variance was calculated as 1–
the correlation between models. The importance of variance was rescaled to between 0 and 1, where a high correlation between models was indicated by low influence and vice versa [85]. Finally, in order to assess the improvement when the potential snow accumulation was included in the prediction of the realized niche model, we also computed the modelling frame-work using Tmin, Tmax and Pann as climatic variables. The TSS and AUC scores of the mod-els were used to compare the modelling processes with the TSS and AUC scores obtained considering the potential snow accumulation variable.
Results
Current habitat suitability map of
R
.
ferrugineum
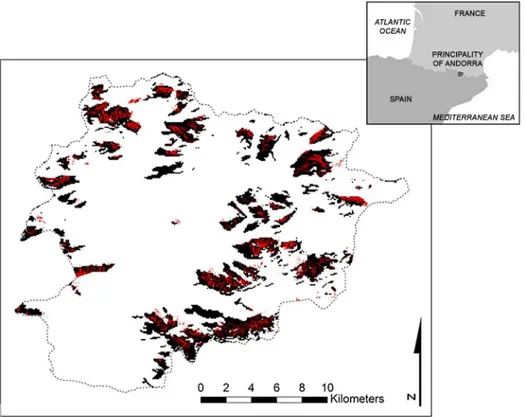
Currently,R.ferrugineumcovers about 14.66 km2or 3.1% of the surface area of Andorra, above all (13.2 km2) between 2100 and 2500 m a.s.l (Fig 1). All five model algorithms used to predict its presence performed well. TSS values obtained were between 0.70 and 0.80 and AUC scores between 0.92 and 0.96 for the modelling process with the Psnow variable, while invari-ably lower TSS and AUC scores were obtained for the modelling process without other climatic variables (Table 1). These results provide a more than satisfactory prediction of a realized niche model ofR.ferrugineumwith the Psnow variable and so henceforth only this model will be considered for model projections under different climate change scenarios. In terms of the influence of the variables on species distribution in Andorra, Psnow is the most important vari-able (0.623); solar radiation too had a substantial impact (0.563), while the topographic aspect and slope had the least influence (0.077 and 0.068, respectively).
The final model (obtained from 20 models and using 0.515 as the mean of the threshold val-ues) yields a habitat suitability map for the species of 70.7 km2or 15.1% of the surface area of Andorra. These 70.7 km2of suitable area mainly correspond today to grassland and resinous forest habitats (17.7 and 20.1 km2of the suitable area forR.ferrugineum, respectively) and, to a lesser extent, to shrubland habitats (15 km2). Finally, screes and rocky hillside habitats, proba-bly the most difficult terrain on which to become established, represent 14.4 km2or 20.3% of the suitable area.
Future habitat suitability maps of
R
.
ferrugineum
under climate change
scenarios
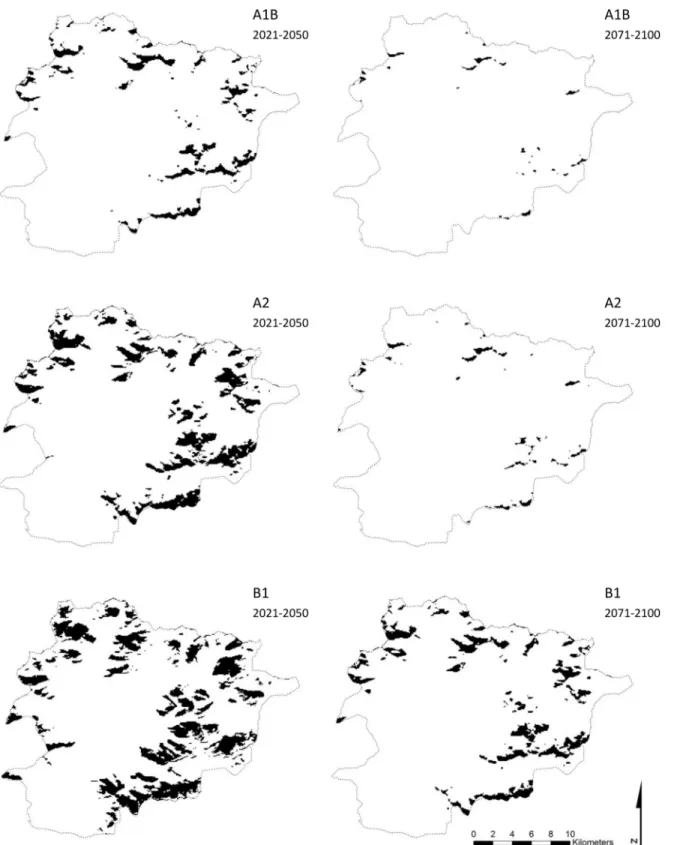
Using the mean of the two threshold values, we obtained from scenario A1B suitable habitat areas forR.ferrugineumof 22.2 km2(4.7% of Andorra) and 2.8 km2(0.6%) for the periods 2021–
2050 and 2071–2100, respectively (Fig 2). In this case, 12.3% and 0% of the current suitable habi-tat area will be preserved for the species in the short and long terms, respectively. Currently, 6.1% of the short-term suitable habitat area is occupied by the species but none of the long-term suit-able habitat area. For the A2 scenario, we obtained suitsuit-able habitat areas of 47.4 km2(10.1% of Andorra) and 5.6 km2(1.2%) in the short and long terms, respectively (Fig 2). In all, 42.6% and Fig 1.Rhododendron ferrugineumcurrent potential distribution.The black tone indicates predicted areas of the current potential distribution ofRhododendron ferrugineumin Andorra taken from the global model at a resolution of 90 m.
doi:10.1371/journal.pone.0147324.g001
Table 1. Models AUC and TSS performance scores.Differences in the AUC and TSS performance scores in the five algorithms used to model the current distribution ofR.ferrugineumin Andorra.
Modelling process using Psnow as climatic variable
Modelling process usingTmin as climatic
variable
Modelling process using Tmax as climatic variable
Modelling process using Pann as climatic variable
Algorithm AUC score TSS score AUC score TSS score AUC score TSS score AUC score TSS score
GAM 0.939 0.742 0.920 0.928 0.725 0.708 0.918 0.698
BRT 0.959 0.801 0.946 0.952 0.786 0.749 0.947 0.755
CTA 0.920 0.755 0.853 0.869 0.649 0.626 0.874 0.647
ANN 0.925 0.703 0.917 0.696 0.931 0.729 0.916 0.703
MARS 0.930 0.717 0.910 0.918 0.700 0.655 0.904 0.648
Fig 2.Rhododendron ferrugineumpotential distribution under climate change.The black tone indicates predicted areas of the potential distribution of
Rhododendron ferrugineumin Andorra under three climate changes scenarios (A1B, A2 and B1) for the periods 2021–2050 and 2071–2100 taken from the
global model at a resolution of 90 m.
0.2% of the current suitable habitat area will continue to be suitable habitat for the species in the short and long terms, respectively. In total, 13.9% and 0.6% of the area predicted as suitable habi-tat in the short and long terms, respectively, were occupied by the species in 2012. Finally, for the B1 scenario, we obtained suitable habitat areas of 68.6 km2(14.7% of Andorra) and 32.8 km2 (7%) for the short and long terms, respectively (Fig 2), which means that 88.3% and 24.6% of the current habitat suitable areas will continue to be suitable habitat for the species in the short and long terms, respectively. In all, 16.1% and 10.3% of the area predicted as suitable habitat in the short and long terms, respectively, are already occupied by the species.
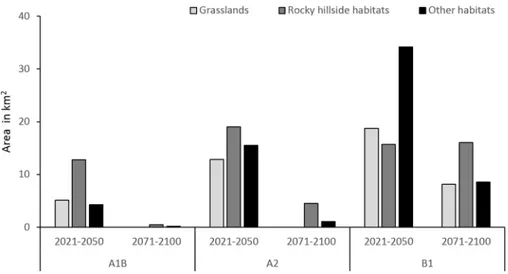
In the short term (2021–2050), the future suitable habitat area forR.ferrugineumwill encompass, respectively, (a) grassland, and (b) screes and rocky hillside habitats as follows: 23% and 57.6% of the 22.2 km2 of suitable habitat areas predicted by the A1B scenario; 27.1% and 40.1% of the 47.4 km2 of suitable habitat areas predicted by the A2 scenario; and 27.3% and 22.9% of the 68.6 km2 of suitable habitat areas predicted by the B1 scenarios (Fig 3). In the long term (2071–2100), the future habitat suitable area forR.ferrugineumwill cover above all screes and rocky hillside habitats: 84.4% of the 0.6 km2and 81.3% of the 5.6 km2of suitable habitat areas predicted by the A1B and A2 scenarios, respectively; while for the B1 scenario the future suitable habitat area ofR.ferrugineumwill encompass grasslands and screes and rocky hillside habitats: 24.9% and 48.9% of the 32.8 km2.
Discussion
Current habitat suitability map of
R
.
ferrugineum
The excellent model accuracy obtained for the realized niche model ofR.ferrugineumis not surprising since clonal species generally provide good model fits [12], especially when the mod-elled species—as is the case ofR.ferrugineum–has a small geographical range [86]. This great accuracy can also be attributed to the relatively minor effect of land use on species presence-absence, the distribution of the species in equilibrium with climate (detected with the use of true absence data) and the niche stability highlighted by the species (no shift in competition with other species or genetic variation over time; [87,88].
Fig 3.Rhododendron ferrugineumfuture suitable habitats under climate change.Future suitable habitats (grasslands, rocky hillsides and other habitats) present in the potential distribution ofRhododendron
ferrugineumin Andorra under three climate change scenarios (A1B, A2 and B1) for the periods 2021–2050
and 2071–2100.
The use of potential snow accumulation to model the realized niche model ofR. ferrugi-neumis of great interest as this variable had the greatest influence on species niche, thereby confirming the important role played by snow in its distribution. Our results also confirm those of [25,42], whereby the variables that characterize limiting or regulating factors increase the predictive power of species niche modelling and, as in our case, contribute to greater model accuracy. Indeed,R.ferrugineumhas a wide-ranging distribution within alpine environments because it is physiologically adapted to alpine habitats characterized by freezing, powerful solar radiation and sudden and important changes in microclimates and/or drought stress [89,90]. Nevertheless, this species is highly dependent on snow cover during winter and so the consid-eration of potential snow accumulation provides a new dimension to the characterization of its realized niche. Given that solar radiation also contributes to species distribution, projections under different climate change scenarios will be numerous and thus permit good model accu-racy [43,44]. The lack of influence of slope on species niche implies that there will be little decrease in suitable conditions at higher elevations where slope gradients tend to be greater [91]. The limited influence of topographic aspect on the species’distribution is initially surpris-ing as the species tends to be located on north-facsurpris-ing slopes [92]. However, solar radiation highlights many variations in topographic aspect and as the prime input for energy balance also influences snow melting [93].
Although the altitudinal range ofR.ferrugineumin Andorra is fairly similar to its observed range in the Alps [94] and other parts of the Pyrenees [95], we did find it in generally drier environments than on the northern face of the Pyrenees [92,96] and in generally more humid environments than on the southern face [95]. Annual precipitation levels are not that impor-tant for this species—as other studies have already pointed out (see [97]; and reference therein)–and of far greater relevance is the effect that temperature has on precipitation in mountainous areas.
Future habitat suitability maps of
R
.
ferrugineum
under climate change
scenarios
The effect of climate change in the twenty-first century will include a reduction in the suitable habitat areas forR.ferrugineumin the Pyrenees. In the first half of this century, the decline in suitable habitats will be variable but not overly severe under the A1B, A2 and B1 scenarios (in the range 2.1–48.5 km2).The uncertainty existing regarding the magnitude of climate change gives rise to very contrasting forecasts for the species realized niche in this period. It is note-worthy that the moderate A1B scenario gives the most important reduction in suitable habitats for the species because the predicted climatic tendencies in winter under this scenario consist of a reduction in precipitation, while under the other scenarios an increase in the precipitation in winter is predicted. For the period 2071–2100, we obtained an important reduction in suit-able habitat (in the range 37.9–70.1 km2), which is not surprising since snow cover, of crucial importance for the species presence, is directly related to climate [98] and will decrease in area in winter as a consequence of the increase in temperatures and the fall in precipitation (depending on the scenario) [23]. The upward shift of this species realized niche model will depend on the presence of snow but, given its slow colonization rate [99], it is possible that this shift may not actually occur.
limit by shrubland species from lower elevations such asBuxus sempervirensandCorylus avel-lana, or even by subalpine forests ofAbies albaandPinus uncinata. As well, the stabilizing effect thatR.ferrugineumhas on mountain soils will be fulfilled by other shrub species. Sec-ondly, its plasticity and the frequency of its clonal reproduction [100] suggest that plants will be long-lived once they establish themselves. Thirdly, the vulnerability of seedlings will proba-bly increase with the fall in precipitation predicted in scenarios A1B and A2: summer droughts like that of 2012 [103] may affect seedling survival [92] and are expected to increase in this southern part of the Pyrenean chain [104]. Fourthly, the consequences for plant survival and plant seed production may be even more serious if this species has to withstand winter and spring frosts if snow cover is not present (the mean minimum temperature during the winter season will range between -4.8 and -1°). Indeed, an important reduction in snow cover dura-tion between at 1500–2000 m a.s.l. in the Pyrenees is expected under future climate change sce-narios [105], which may exposeR.ferrugineumto greater damage by freezing. Moreover, the greater resistance of subalpine and alpine grasslands to invasive species in the event of climate change and vegetation shifts [106] means that we should expect poorer seedling establishment and less and slower colonization of new areas. Besides, given that many of the new suitable habitats are situated on rocky hillside (23–84% of future predicted niches), the colonization of new areas will not be easy. The most likely outcome is therefore a shrinking of the current spe-cies distribution and a shift to the higher elevations where the few current areas of suitable hab-itats covered by the species will become the species main nucleus (from 7.3 to 0.5 km2for the B1 and A2 scenarios in the long term, respectively, and none for the A1B scenario). Even so, it is still unclear whether this colonization will actually occur or not. Finally, a counterbalance to this negative outcome for the survival ofR.ferrugineummay possibly be provided by the lower sensitivity of the snowpack (resulting from snow accumulation) to future climate change on the north-facing slopes [107] where the species is mostly found. Mountains are also relatively complex from a topographic and geomorphologic point of view; snow transport by wind is common and leads to snow erosion and/or accumulation depending on the fine scale of the wind circulation model [25]. In the case of a plant such asR.ferrugineumthat is particularly dependent on the presence of snow cover, the redistribution of the snowpack under future cli-mate change could create persistent snow patches at particular sites and raise the plant dis-persal pattern, or reduce the lack of snow cover [25]. However, any such prediction would require higher resolution DEM data and a dominant wind model in the SDM models, neither of which are currently available for Andorra. Next, the lack of snow cover could even be partly offset by higher temperatures, which may result in less adverse conditions for the species since low temperatures are directly linked to vital physiological processes [108]. In this case, the more suitable conditions induced by climate change could allow the species to outcompete other shrubland or forest species and to persist wherever it becomes established.
Conclusions
negatively affected. Finally, sinceR.ferrugineumis a relatively long-lived species [35] and may persist for a long time wherever it is established, decades may be needed to detect changes in its range [91,109]. Moreover, the effect of changes in land use in Andorra and the ensuing reduc-tion of livestock grazing in its subalpine and alpine grasslands [110] may affect the impact that climate change has onR.ferrugineumcommunities [111,112] since species migration and dis-turbed species assemblages could lead to important shifts in the ecological interactions occur-ring within plant species communities [113]. Despite being very difficult to predict the effect of global warming on the distribution of upland species such asR.ferrugineum, the most impor-tant consequences of any future habitat reduction will be likely to concern black grouse conser-vation as this species represents a key habitat for this threatened Galliforme bird species.
Supporting Information
S1 Fig. Winter potential snow accumulation map.Winter potential snow accumulation cal-culated in Andorra following López-Moreno et al. (2007) using data from the Climatological Atlas of Andorra (Batalla et al. 2011). Dark blue tones indicate areas with high snow cover in winter and red areas indicate the current presence of the plant.
(TIF)
S1 Table. Annual and winter Tmin, Tmax and precipitation values under climate change. Mean annual and winter (December, January and February) Tmin, Tmax and precipitation values for current reference values, for the mid-21st century (2021–2050) and for the end of the 21st century (2071–2100) under three climate change scenarios (A1B, A2 and B2). (PDF)
Acknowledgments
We are grateful to Damien George for his help with the Biomod2 library, to Andre Pornon for sharing his knowledge ofR.ferrugineum, and to Mike Lockwood for the linguistic corrections.
Author Contributions
Conceived and designed the experiments: BK PE RC LT. Performed the experiments: BK PE. Analyzed the data: BK PE. Contributed reagents/materials/analysis tools: BK PE RC LT. Wrote the paper: BK PE LT.
References
1. Comes H. The Mediterranean region—a hotspot for plant biogeographic research. New Phytol. 2004; 164(1):11–4.
2. Körner C. Alpine plant life: functional plant ecology of high mountain ecosystems. Springer; 2003. 374 p.
3. Thuiller W, Lavorel S, Araújo MB, Sykes MT, Prentice IC. Climate change threats to plant diversity in Europe. Proc Natl Acad Sci U S A. 2005; 102(23):8245–50. PMID:15919825
4. Diaz HF, Grosjean M, Graumlich L. Climate variability and change in high elevation regions: past, present & future. Diaz HF, editor. Clim Change. 2003; 59(1–2):1–4.
5. Brooks TM, Mittermeier RA, da Fonseca GAB, Gerlach J, Hoffmann M, Lamoreux JF, et al. Global bio-diversity conservation priorities. Science. 2006; 313(5783):58–61. PMID:16825561
6. Guisan A, Thuiller W. Predicting species distribution: offering more than simple habitat models. Ecol Lett. 2005; 8(9):993–1009.
editors. Global change and protected areas [Internet]. Netherlands: Springer; 2001 [cited 2014 Feb 11]. p. 45–51. Available:http://link.springer.com/chapter/10.1007/0-306-48051-4_6
8. Körner C. The use of“altitude”in ecological research. Trends Ecol Evol. 2007; 22(11):569–74. PMID: 17988759
9. Thomas CD, Cameron A, Green RE, Bakkenes M, Beaumont LJ, Collingham YC, et al. Extinction risk from climate change. Nature. 2004; 427(6970):145–8. PMID:14712274
10. Rosenzweig C, Karoly D, Vicarelli M, Neofotis P, Wu Q, Casassa G, et al. Attributing physical and bio-logical impacts to anthropogenic climate change. Nature. 2008; 453(7193):353–7. doi:10.1038/ nature06937PMID:18480817
11. Vittoz P, Randin C, Dutoit A, Bonnet F, Hegg O. Low impact of climate change on subalpine grass-lands in the Swiss Northern Alps. Glob Change Biol. 2009; 15(1):209–20.
12. Guisan A, Theurillat JP. Equilibrium modeling of alpine plant distribution: how far can we go? Phyto-coenologia. 2000; 30(3–4):353–84.
13. Kreyling J, Bittner T, Jaeschke A, Jentsch A, Jonas Steinbauer M, Thiel D, et al. Assisted colonization: a question of focal units and recipient localities. Restor Ecol. 2011; 19(4):433–40.
14. Martínez I, González-Taboada F, Wiegand T, Camarero JJ, Gutiérrez E. Dispersal limitation and spa-tial scale affect model based projections of Pinus uncinata response to climate change in the Pyre-nees. Glob Change Biol. 2012; 18(5):1714–24.
15. Buisson L, Grenouillet G, Casajus N, Lek S. Predicting the potential impacts of climate change on stream fish assemblages. Am Fish Soc Symp. 2010; 73:327–46.
16. Habel JC, Rödder D, Schmitt T, Nève G. Global warming will affect the genetic diversity and unique-ness of Lycaena helle populations. Glob Change Biol. 2011; 17(1):194–205.
17. Williams-Tripp M, D’Amico FJN, Pagé C, Bertrand A, Némoz M, Brown JA. Modeling rare species dis-tribution at the edge: the case for the vulnerable endemic Pyrenean desman in France. Sci World J. 2012; 2012:612965.
18. Peterson AT. Projected climate change effects on Rocky Mountain and Great Plains birds: generali-ties of biodiversity consequences. Glob Change Biol. 2003; 9(5):647–55.
19. Friedel H. Schneedeckenandauer und Vegetationsverteilung im Gelände. Forstliche Bundesversuch-sanstalt Mariabrunn. 1961; 59:317–69.
20. Neuner G, Ambach D, Aichner K. Impact of snow cover on photoinhibition and winter desiccation in evergreen Rhododendron ferrugineum leaves during subalpine winter. Tree Physiol. 1999; 19 (11):725–32. PMID:12651311
21. Zaghi D. Management of Natura 2000 habitats. 4060 alpine and boreal heaths. European Commis-sion; 2008.
22. The Council of the European Communities. Council Directive 92/43/EEC 1992 of 21 May 1992 on the conservation of natural habitats and of wild fauna and flora. L206 1992 p. 7–49.
23. Déqué M, Martin E, Kitova N. Response of the snow cover over France to climate change. Res Atmo-spheric Ocean Model. 2011; 41(7):11–2.
24. Gray LK, Hamann A. Tracking suitable habitat for tree populations under climate change in western North America. Clim Change. 2013; 117(1–2):289–303.
25. Randin C, Vuissoz G, Liston G, Vittoz P, Guisan A. Introduction of snow and geomorphic disturbance variables into predictive models of alpine plant distribution in the Western Swiss Alps. Arct Antarct Alp Res. 2009; 41(3):347–61.
26. Batalla M, Ninyerola M, Esteban P. Atles Climàtic Digital d’Andorra. Servidor de mapes. [Internet]. Institut d’Estudis Andorrans—Universitat Autònoma de Barcelona; 2011. Available:http://opengis. uab.es/wms/ACDA/index.htm
27. López-Moreno J., Vicente-Serrano S., Lanjeri S. Mapping snowpack distribution over large areas using GIS and interpolation techniques. Clim Res. 2007; 33:257–70.
28. Sillero N. What does ecological modelling model? A proposed classification of ecological niche mod-els based on their underlying methods. Ecol Model. 2011 Apr 24; 222(8):1343–6.
29. Thuiller W, Lavorel S, Araújo MB. Niche properties and geographical extent as predictors of species sensitivity to climate change. Glob Ecol Biogeogr. 2005; 14(4):347–57.
30. OPCC PCCO. Main climatological regions of the Pyrenees [Internet]. 2013 [cited 2013 Aug 8]. Avail-able:http://www.opcc-ctp.org/index.php?option = com_content&view = article&id=4%3Aregions-climatiques&catid=7%3Ales-pyrenees-le-territoire-daction&Itemid=7&lang = fr
32. Carreras J, Carrillo E, Ferré A, Perez-Haase A, Ninot JM, Caritg R. Mapa digital dels hàbitats d’ An-dorra. Andorra: Institut d’Estudis Andorrans; 2013.
33. Louis A, Petereit F, Lechtenberg M, Deters A, Hensel A. Phytochemical characterization of
Rhodo-dendron ferrugineumand in vitro assessment of an aqueousextract on cell toxicity. Planta Med. 2010;
76(14):1550–7. doi:10.1055/s-0029-1241016PMID:20309793
34. Castroviejo S, Laínz M, López González G, Montserrat-Recoder P, Muñoz Garmendia F, Paiva J, et al. Flora Ibérica. Plantas vasculares de la Península Ibérica e Islas Baleares. Real Jardin Botánico, C.S.I.C. Madrid; 1993.
35. Pornon A, Escaravage N, Till-Bottraud I, Doche B. Variation of reproductive traits in Rhododendron ferrugineum L. (Ericaceae) populations along a successional gradient. Plant Ecol. 1997; 130(1):1–11. 36. Congalton R, Green K. A practical look at the sources of confusion in error matrix generation.
Photo-gramm Eng Remote Sens PERS. 1993; 59(5):641–4.
37. Binaghi E, Brivio PA, Ghezzi P, Rampini A. A fuzzy set-based accuracy assessment of soft classifica-tion. Pattern Recognit Lett. 1999; 20(9):935–48.
38. Cohen J. A coefficient of agreement for nominal scales. Educ Psychol Meas. 1960; 20:37–46. 39. Foody GM. Status of land cover classification accuracy assessment. Remote Sens Environ. 2002; 80
(1):185–201.
40. Lobo JM, Jiménez-Valverde A, Hortal J. The uncertain nature of absences and their importance in species distribution modelling. Ecography. 2010 Feb 1; 33(1):103–14.
41. Ruiz-Labourdette D, Nogués-Bravo D, Ollero HS, Schmitz MF, Pineda FD. Forest composition in Mediterranean mountains is projected to shift along the entire elevational gradient under climate change. J Biogeogr. 2012; 39(1):162–76.
42. Randin CF, Dedieu J-P, Zappa M, Long L, Dullinger S. Validation of and comparison between a semi-distributed rainfall–runoff hydrological model (PREVAH) and a spatially distributed snow-evolution model (SnowModel) for snow cover prediction in mountain ecosystems. Ecohydrology. 2014;n/a—n/ a.
43. Araújo MB, Pearson RG. Equilibrium of species’distributions with climate. Ecography. 2005; 28 (5):693–5.
44. Pearman PB, Guisan A, Broennimann O, Randin CF. Niche dynamics in space and time. Trends Ecol Evol. 2008; 23(3):149–58. doi:10.1016/j.tree.2007.11.005PMID:18289716
45. Collins M, Knutti R, Arblaster J, Dufresne J., Fichefet T, Friedlingstein P, et al. Long-term climate change: projections, commitments and irreversibility. In: Stocker T., Qin D, Plattner G., Tignor M, Allen S., Boschung J, et al., editors. Climate change 2013: the physical science basis contribution of working group I to the fifth assessment report of the intergovernmental panel on climate change. Cambridge, United Kingdom and New York, NY, USA: Cambridge University Press; 2013. p. 1029–
136.
46. Stocker T., Qin D, Plattner G., Tignor M, Allen S., Boschung J, et al. IPCC 2013: Climate Change 2013: The Physical Science Basis. Contribution of Working Group I to the Fifth Assessment Report of the Intergovernmental Panel on Climate Change. Cambridge, United Kingdom and New York, NY, USA: Cambridge University Press; 2013. 1535 p.
47. López-Moreno JI, Goyette S, Beniston M. Climate change prediction over complex areas: spatial vari-ability of uncertainties and predictions over the Pyrenees from a set of regional climate models. Int J Climatol. 2008; 28(11):1535–50.
48. Hair JF, Black WC, Anderson RE, Tatham RL. Multivariate data analysis [Internet]. Upper Saddle River, United States: Prentice-Hall; 1998 [cited 2015 Feb 25]. 730 p. Available:http://cds.cern.ch/ record/580950
49. Graham MH. Confronting multicollinearity in ecological multiple regression. Ecology. 2003; 84 (11):2809–15.
50. Wintle BA, Elith J, Potts JM. Fauna habitat modelling and mapping: a review and case study in the Lower Hunter Central Coast region of NSW. Austral Ecol. 2005 Nov 1; 30(7):719–38.
51. Montgomery DC, Peck AE. Introduction to linear regression analysis [Internet]. New York, United States: Wiley; 1982 [cited 2015 Feb 25]. 504 p. Available:http://www.bcin.ca/Interface/openbcin.cgi? submit = submit&Chinkey=118179
52. Zuur A, Ieno EN, Smith GM. Analysing Ecological Data. Springer Science, United States; 2007. 686 p.
53. Legendre P, Fortin MJ. Spatial pattern and ecological analysis. Plant Ecol. 1989; 80(2):107–38. 54. Austin M. Species distribution models and ecological theory: a critical assessment and some possible
55. Legendre P. Spatial autocorrelation: trouble or new paradigm? Ecology. 1993; 74(6):1659–73. 56. Legendre P, Legendre L. Numerical Ecology. Amsterdam: Elsevier; 2000. 1008 p.
57. Fortin MJ, Drapeau P, Legendre P. Spatial autocorrelation and sampling design in plant ecology. Plant Ecol. 1989; 83(1):209–22.
58. Cliff AD, Ord JK. Spatial processes: models & applications. London, UK: Pion; 1981. 288 p. 59. Dormann CF, McPherson JM, Araújo MB, Bivand R, Bolliger J, Carl G, et al. Methods to account for
spatial autocorrelation in the analysis of species distributional data: a review. Ecography. 2007; 30 (5):609–28.
60. Diniz-Filho JA., Bini LM. Modelling geographical patterns in species richness using eigenvector-based spatial filters. Glob Ecol Biogeogr. 2005; 14(2):177–85.
61. Reichert P, Omlin M. On the usefulness of overparameterized ecological models. Ecol Model. 1997; 95(2–3):289–99.
62. Wintle BA, McCarthy MA, Volinsky CT, Kavanagh RP. The use of bayesian model averaging to better represent uncertainty in ecological models. Conserv Biol. 2003; 17(6):1579–90.
63. Araújo MB, New M. Ensemble forecasting of species distributions. Trends Ecol Evol. 2007; 22(1):42–
7. PMID:17011070
64. Gallien L, Douzet R, Pratte S, Zimmermann NE, Thuiller W. Invasive species distribution models—
how violating the equilibrium assumption can create new insights: Beyond the equilibrium assumption of SDMs. Glob Ecol Biogeogr. 2012; 21(11):1126–36.
65. Thuiller W, Georges D, Engler R. Biomod2: Ensemble platform for species distribution modeling. 2013.
66. Hastie TJ, Tibshirani RJ. Generalized Additive Models. London: Chapman and Hall; 1990. 356 p. 67. Friedman J. Multivariate Adaptive Regression Splines. Ann Stat. 1991; 19(1):1–67.
68. Brieman L, Friedman J., Olshen R., Stone C. Classification and regression trees. Chapman and Hall. New York; 1984.
69. Ridgeway G. The State of Boosting. Comput Sci Stat. 1999; 31:172–81.
70. Ripley B. Pattern recognition and neural networks. Cambridge University Press. Cambridge; 1996. 71. Heikkinen RK, Luoto M, Araújo MB, Virkkala R, Thuiller W, Sykes MT. Methods and uncertainties in
bioclimatic envelope modelling under climate change. Prog Phys Geogr. 2006; 30(6):751–77. 72. Leathwick JR, Elith J, Hastie T. Comparative performance of generalized additive models and
multi-variate adaptive regression splines for statistical modelling of species distributions. Ecol Model. 2006; 199(2):188–96.
73. Guisan A, Graham CH, Elith J, Huettmann F. Sensitivity of predictive species distribution models to change in grain size. Divers Distrib. 2007; 13(3):332–40.
74. De’ath G, Fabricius KE. Classification and regression trees: a powerful yet simple technique for eco-logical data analysis. Ecology. 2000; 81(11):3178–92.
75. Marmion M, Parviainen M, Luoto M, Heikkinen RK, Thuiller W. Evaluation of consensus methods in predictive species distribution modelling. Divers Distrib. 2009; 15(1):59–69.
76. Araújo MB, Pearson RG, Thuiller W, Erhard M. Validation of species–climate impact models under cli-mate change. Glob Change Biol. 2005; 11(9):1504–13.
77. Allouche O, Tsoar A, Kadmon R. Assessing the accuracy of species distribution models: prevalence, kappa and the true skill statistic (TSS). J Appl Ecol. 2006; 43(6):1223–32.
78. Fielding AH, Bell JF. A review of methods for the assessment of prediction errors in conservation pres-ence/absence models. Environ Conserv. 1997; 24(01):38–49.
79. Cohen J. Weighted kappa: nominal scale agreement provision for scaled disagreement or partial credit. Psychol Bull. 1968; 70(4):213–20.
80. Pearson RG, Raxworthy CJ, Nakamura M, Townsend Peterson A. Predicting species distributions from small numbers of occurrence records: a test case using cryptic geckos in Madagascar. J Bio-geogr. 2007; 34(1):102–17.
81. Liu C, Berry PM, Dawson TP, Pearson RG. Selecting thresholds of occurrence in the prediction of species distributions. Ecography. 2005; 28(3):385–93.
82. Jiménez-Valverde A, Lobo JM. Threshold criteria for conversion of probability of species presence to either–or presence–absence. Acta Oecologica. 2007 May; 31(3):361–9.
84. Cantor SB, Sun CC, Tortolero-Luna G, Richards-Kortum R, Follen M. A comparison of C/B ratios from studies using receiver operating characteristic curve analysis. J Clin Epidemiol. 1999 Sep; 52(9):885–
92. PMID:10529029
85. Thuiller W, Lafourcade B, Engler R, Araújo MB. BIOMOD—a platform for ensemble forecasting of species distributions. Ecography. 2009; 32(3):369–73.
86. Hernandez PA, Graham CH, Master LL, Albert DL. The effect of sample size and species characteris-tics on performance of different species distribution modeling methods. Ecography. 2006; 29(5):773–
85.
87. Nogués-Bravo D. Predicting the past distribution of species climatic niches. Glob Ecol Biogeogr. 2009; 18(5):521–31.
88. Václavík T, Meentemeyer RK. Invasive species distribution modeling (iSDM): Are absence data and dispersal constraints needed to predict actual distributions? Ecol Model. 2009; 220(23):3248–58. 89. Lütz C, Schönauer E, Neuner G. Physiological adaptation before and after snow melt in green
over-wintering leaves of some alpine plants. Phyton. 2005; 45(3):139–56.
90. Mayr S, Beikircher B, Obkircher M-A, Schmid P. Hydraulic plasticity and limitations of alpine Rhodo-dendron species. Oecologia. 2010; 164(2):321–30. doi:10.1007/s00442-010-1648-7PMID: 20454977
91. Theurillat JP, Guisan A. Potential impact of climate change on vegetation in the European Alps: a review. Clim Change. 2001; 50(1):77–109.
92. Pornon A, Escaravage N, Thomas P, Taberlet P. Dynamics of genotypic structure in clonal Rhodo-dendron ferrugineum (Ericaceae) populations. Mol Ecol. 2000; 9(8):1099–111. PMID:10964229 93. Fu P, Rich PM. A geometric solar radiation model with applications in agriculture and forestry. Comput
Electron Agric. 2002; 37(1–3):25–35.
94. Escaravage N, Flubacker E, Pornon A, Doche B, Till-Bottraud I. Stamen dimorphism in Rhododen-dron ferrugineum (Ericaceae): development and function. Am J Bot. 2001; 88(1):68–75. PMID: 11159128
95. Gracia M, Montané F, Piqué J, Retana J. Overstory structure and topographic gradients determining diversity and abundance of understory shrub species in temperate forests in central Pyrenees (NE Spain). For Ecol Manag. 2007; 242:391–7.
96. Pasche F, Armand M, Gouaux P, Lamaze T, Pornon A. Are meadows with high ecological and patri-monial value endangered by heathland invasion in the French central Pyrenees? Biol Conserv. 2004; 118(1):101–8.
97. Tardif J, Camarero JJ, Ribas M, Gutiérrez E. Spatiotemporal variability in tree growth in the Central Pyrenees: climatic and site influences. Ecol Monogr. 2003; 73(2):241–57.
98. Lischke H, Guisan A, Fischlin A, Williams J, Bugmann H. Vegetation responses to climate change in the Alps: modeling studies. In: Views from the Alps: regional perspectives on climate change. Boston: MIT Press; 1998. p. 309–50.
99. Clark CJ, Poulsen JR, Levey DJ, Osenberg CW. Are plant populations seed limited? A critique and meta-analysis of seed addition experiments. Am Nat. 2007; 170(1):128–42. PMID:17853997 100. Escaravage N, Questiau S, Pornon A, Doche B, Taberlet P. Clonal diversity in a Rhododendron
ferru-gineum L. (Ericaceae) population inferred from AFLP markers. Mol Ecol. 1998; 7(8):975–82. 101. Nogués-Bravo D, Araújo MB, Errea M, Martinez-Rica J. Exposure of global mountain systems to
cli-mate warming during the 21st Century. Glob Environ Change. 2007; 17(3–4):420–8.
102. Falk W, Hempelmann N. Species favourability shift in Europe due to climate change: a case study for Fagus sylvatica L. and Picea abies (L.) Karst. based on an ensemble of climate models. J Climatol [Internet]. 2013 [cited 2014 Feb 24];2013. Available:http://www.hindawi.com/journals/jcli/2013/ 787250/abs/
103. CENMA. Informe climàtic anual: resum any 2012. Sant Juliàde Lòria, Principat d’Andorra: CENMA; 2013 p. 8. Report No.: clima2012_2013-01-15.
104. Esteban Vea P, Prohom Duran M, Aguilar E. Tendencias recientes e índices de cambio climático de la temperatura y la precipitación en Andorra, Pirineos (1935–2008). Pirineos. 2012; 167:87–106. 105. Szczypta C, Gascoin S, Houet T, Hagolle O, Dejoux J-F, Vigneau C, et al. Impact of climate and land
cover changes on snow cover in a small Pyrenean catchment. J Hydrol. 2015 Feb; 521:84–99. 106. Dullinger S, Dirnböck T, Grabherr G. Patterns of shrub invasion into high mountain grasslands of the
Northern Calcareous Alps, Austria. Arct Antarct Alp Res. 2003; 35(4):434–41.
108. Vetaas OR. Realized and potential climate niches: a comparison of four Rhododendron tree species. J Biogeogr. 2002; 29(4):545–54.
109. Jump AS, Hunt JM, Peñuelas J. Rapid climate change-related growth decline at the southern range edge of Fagus sylvatica. Glob Change Biol. 2006; 12(11):2163–74.
110. Komac B, Domènech M, Fanlo R. Effects of grazing on plant species diversity and pasture quality in subalpine grasslands in the eastern Pyrenees (Andorra): Implications for conservation. J Nat Con-serv. 2014; 22(3):247–55.
111. Körner C. The green cover of mountains in a changing environment. In: Huber UM, Bugmann HKM, Reasoner MA, editors. Global Change and Mountain Regions [Internet]. Springer Netherlands; 2005 [cited 2014 Feb 25]. p. 367–75. Available:http://link.springer.com/chapter/10.1007/1-4020-3508-X_ 36
112. Jay F, Manel S, Alvarez N, Durand EY, Thuiller W, Holderegger R, et al. Forecasting changes in popu-lation genetic structure of alpine plants in response to global warming. Mol Ecol. 2012; 21(10):2354–
68. doi:10.1111/j.1365-294X.2012.05541.xPMID:22512785