www.the-cryosphere.net/10/2673/2016/ doi:10.5194/tc-10-2673-2016
© Author(s) 2016. CC Attribution 3.0 License.
Presence of rapidly degrading permafrost plateaus
in south-central Alaska
Benjamin M. Jones1, Carson A. Baughman1, Vladimir E. Romanovsky2,3, Andrew D. Parsekian4, Esther L. Babcock1, Eva Stephani1, Miriam C. Jones5, Guido Grosse6, and Edward E. Berg7,*
1Alaska Science Center, US Geological Survey, Anchorage, AK 99508, USA 2Geophysical Institute, University of Alaska Fairbanks, Fairbanks, AK 99775, USA 3Earth Cryosphere Institute, 86 Malygina Street, 625000 Tyumen, Russia
4Department of Geology and Geophysics, University of Wyoming, Laramie, WY 82070, USA 5Eastern Geology and Paleoclimate Science Center, US Geological Survey, Reston, VA 20192, USA 6Alfred Wegener Institute, Helmholtz Centre for Polar and Marine Research, 14473 Potsdam, Germany 7Kenai National Wildlife Refuge, US Fish and Wildlife Service, Soldotna, AK 99669, USA
*retired
Correspondence to:Benjamin M. Jones (bjones@usgs.gov)
Received: 14 April 2016 – Published in The Cryosphere Discuss.: 23 May 2016
Revised: 13 October 2016 – Accepted: 27 October 2016 – Published: 15 November 2016
Abstract. Permafrost presence is determined by a complex interaction of climatic, topographic, and ecological condi-tions operating over long time scales. In particular, veg-etation and organic layer characteristics may act to pro-tect permafrost in regions with a mean annual air tem-perature (MAAT) above 0◦C. In this study, we document the presence of residual permafrost plateaus in the west-ern Kenai Peninsula lowlands of south-central Alaska, a re-gion with a MAAT of 1.5±1◦C (1981–2010). Continu-ous ground temperature measurements between 16 Septem-ber 2012 and 15 SeptemSeptem-ber 2015, using calibrated thermis-tor strings, documented the presence of warm permafrost (−0.04 to−0.08◦C). Field measurements (probing) on sev-eral plateau features during the fall of 2015 showed that the depth to the permafrost table averaged 1.48 m but at some locations was as shallow as 0.53 m. Late winter surveys (augering, coring, and GPR) in 2016 showed that the aver-age seasonally frozen ground thickness was 0.45 m, overly-ing a talik above the permafrost table. Measured permafrost thickness ranged from 0.33 to >6.90 m. Manual
interpre-tation of historic aerial photography acquired in 1950 in-dicates that residual permafrost plateaus covered 920 ha as mapped across portions of four wetland complexes encom-passing 4810 ha. However, between 1950 and ca. 2010, per-mafrost plateau extent decreased by 60.0 %, with lateral
fea-ture degradation accounting for 85.0 % of the reduction in area. Permafrost loss on the Kenai Peninsula is likely associ-ated with a warming climate, wildfires that remove the pro-tective forest and organic layer cover, groundwater flow at depth, and lateral heat transfer from wetland surface waters in the summer. Better understanding the resilience and vul-nerability of ecosystem-protected permafrost is critical for mapping and predicting future permafrost extent and degra-dation across all permafrost regions that are currently warm-ing. Further work should focus on reconstructing permafrost history in south-central Alaska as well as additional contem-porary observations of these ecosystem-protected permafrost sites south of the regions with relatively stable permafrost.
1 Introduction
typi-cally represents the north-to-south changes in spatial distri-bution for terrestrial permafrost in high latitudes. Mean an-nual ground temperatures (MAGT) in the continuous per-mafrost zone can be as cold as−15◦C, fall within a narrow range around −2◦C in the discontinuous permafrost zone, and can be warmer than−1◦C in sporadic and isolated per-mafrost zones (Smith and Riseborough, 2002; Romanovsky et al., 2010). In the absence of extensive ground tempera-ture data, researchers have estimated the southern limit of permafrost in northern high latitudes with continental-scale patterns of air temperature isotherms (Brown, 1960, 1970; Ferrians, 1965; Brown et al., 1998). However, in reality com-plex interactions between climatic, topographic, hydrologic, and ecologic conditions operating over long time scales reg-ulate permafrost presence and stability (Shur and Jorgenson, 2007). Due to these interactions, permafrost may persist in regions with a mean annual air temperature (MAAT) above 0◦C, and it may degrade in regions with a MAAT below −10◦C (Jorgenson et al., 2010). Thus, the extent and dynam-ics of permafrost and permafrost-related landscape features remain poorly mapped and modelled at sufficiently fine reso-lution needed for predicting the impact of climate change on specific local landscapes, which is necessary for many deci-sion makers.
Permafrost warming, degradation, and thaw subsidence can have significant implications for ecosystems, infrastruc-ture, and climate at local, regional, and global scales (Jor-genson et al., 2001; Nelson et al., 2001; Schuur et al., 2008). In general, permafrost in Alaska has warmed between 0.3 and 6.0◦C since ground temperature measurements began between the 1950 and 1980s (Lachenbruch and Marshall, 1986; Romanovsky and Osterkamp, 1995; Romanovsky et al., 2002, 2010; Osterkamp, 2007). Warming and thawing of near-surface permafrost may lead to widespread terrain in-stability in ice-rich permafrost in the Arctic (Jorgenson et al., 2006; Lantz and Kokelj, 2008; Gooseff et al., 2009; Jones et al., 2015; Liljedahl et al., 2016) and the subArctic (Os-terkamp et al., 2000; Jorgenson and Os(Os-terkamp, 2005; Lara et al., 2016). Such land surface changes can impact vegeta-tion, hydrology, aquatic ecosystems, and soil-carbon dynam-ics (Grosse et al., 2011; Jorgenson et al., 2013; Kokelj et al., 2015; O’Donnell et al., 2011; Schuur et al., 2008; Vonk et al., 2015). For example, in boreal peatlands, thaw of ice-rich per-mafrost often converts forested perper-mafrost plateaus into lake and wetland bog and fen complexes (Camill, 1999; Jorgen-son et al., 2001; Payette et al., 2004; Sannel and Kuhry, 2008, 2011; Quinton et al., 2011; Jorgenson et al., 2012; Kanevskiy et al., 2014; Swindles et al., 2015; Lara et al., 2016). Fur-thermore, the transition from permafrost peatlands to thawed or only seasonally frozen peatlands can have a positive or a negative feedback on regional and global carbon cycles de-pending on permafrost conditions and differential effects of thaw on net primary productivity and heterotrophic respira-tion (Turetsky et al., 2007; Swindles et al., 2015), as well as
on the degree of loss of the former deep permafrost carbon pool (O’Donnell et al., 2012).
In Alaska, a variety of permafrost conditions shape roughly 80 % of the landscape (Jorgenson et al., 2008b). Shur and Jorgenson (2007) proposed five classes of per-mafrost that describe the interaction of climatological and ecological processes. Arranged from coldest to warmest, these permafrost classes are as follows: climate-driven, climate-driven but ecosystem-modified, climate-driven but protected, driven, and ecosystem-protected. Ecosystem-protected permafrost is the warmest and most vulnerable of the five classes of permafrost and characterizes the sporadic and isolated permafrost zones. It comprises residual permafrost that persists due to favorable ecosystem factors under a climate that is not conducive to its formation. Press disturbances, associated with warming air temperatures and increases in precipitation (especially snow), and pulse disturbances, such as fire or human activi-ties, can trigger immediate ecosystem modification and per-mafrost thaw in these regions (Shur and Jorgenson, 2007).
Since permafrost acts as a sentinel, integrator, and reg-ulator of climate change, improved understanding of its distribution and dynamics is essential, particularly along the southern permafrost boundary (Lunardini, 1996). South-central Alaska, a region with a MAAT of ∼2◦C, is typ-ically mapped as being within the permafrost-free zone (Ferrians, 1965; Brown et al., 1998; Pastick et al., 2015). However, ecosystem-protected permafrost persists in south-central Alaska in regions with present-day climatic condi-tions that are no longer conducive to its formation (Shur and Jorgenson, 2007). Isolated permafrost patches in south-central Alaska exist in the western Kenai Peninsula low-lands (Hopkins et al., 1955; Berg et al., 2009; Jorgenson et al., 2008b) and in the vicinity of Anchorage (Jorgenson et al., 2003; Riddle and Rooney, 2012; Kanevskiy et al., 2013). Enhanced insight into the resilience and vulnerabil-ity of ecosystem-protected permafrost is important due to its utility as a climate indicator and a forecaster of the envi-ronmental consequences expected to arise from permafrost thaw elsewhere in the boreal forest, where MAAT is ex-pected to warm beyond 0◦C in the coming decades (Beil-man et al., 2001). Nevertheless, to date, detailed studies of these south-central Alaskan ecosystem-protected permafrost deposits have remained limited (Kanevskiy et al., 2013).
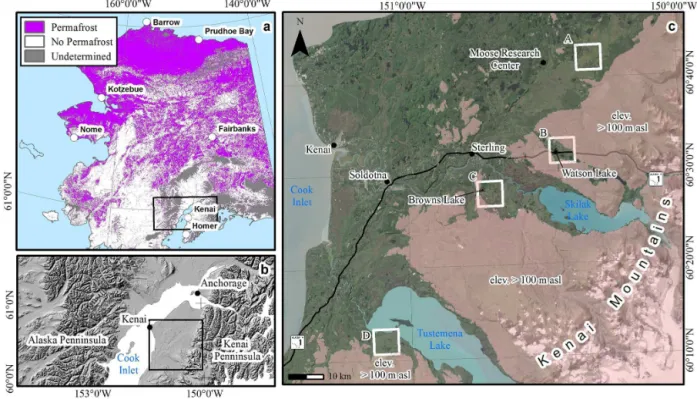
ge-Figure 1.Study area figure.(a)Recent permafrost map of Alaska (Pastick et al., 2015) indicating permafrost presence (purple) and absence (white) in the upper 1 m of the ground surface.(b)Hillshade relief image showing a portion of south-central Alaska. The study region on the Kenai Peninsula lowlands is shown with the black box outline.(c)The portion of the Kenai Peninsula lowlands where field studies and remotely sensed observations were conducted. Ground temperature observations were collected at the Browns Lake and Watson Lake sites. The remote sensing change detection areas are shown with a white box: (A) Mystery Creek, (B) Watson Lake, (C) Browns Lake, and (D) Tustumena Lake wetland complexes.
ometry of the frozen ground below the forested plateaus. Historic aerial photography and high-resolution satellite im-agery from 1950, 1984, 1996, and ca. 2010 were also used to map decadal-scale changes in the aerial extent of the residual permafrost plateaus in portions of four wetland complexes on the western Kenai Peninsula. This study aims to docu-ment and incorporate the loss of ecosystem-protected per-mafrost into the overall understanding of landscape dynam-ics in the western Kenai Peninsula lowlands. More impor-tantly, insights into its stability will enhance the mapping and prediction of current and future permafrost extent along the southern fringe of the circumpolar permafrost region.
2 Study area
The western Kenai Peninsula lowlands are located in south-central Alaska, between 59.6 and 61.0◦N, and are generally less than 100 m a.s.l. (above sea level) (Fig. 1). The low-lands experience a semi-continental climate due to a rain shadow produced by the Kenai Mountains to the east and the presence of Cook Inlet to the northwest, and Kachemak Bay to the south (Jones et al., 2009). Regional MAAT for 1981–2010 was 1.5◦C, with a mean annual precipita-tion of 441 mm (http://www.ncdc.noaa.gov/crn/observaprecipita-tions.
htm) (Fig. 2). The lowlands represent a unique landscape where two major glacial ice fields converged during the Late Wisconsin, 25 000–21 000 ky a−1 (Reger et al., 2007). The modern topography, composed of moraines, outwash fans, kettle lakes, kames, and eskers, is indicative of this glacial history (Hopkins et al., 1955). During the Holocene, the glaciers in the Kenai Peninsula lowlands were succeeded by boreal forest, muskeg, and wetlands laced with rivers and creeks and dotted with lakes (Anderson et al., 2006; Reger et al., 2007). Pastick et al. (2015) recently mapped this re-gion as being permafrost free in the upper 1 m of the ground surface.
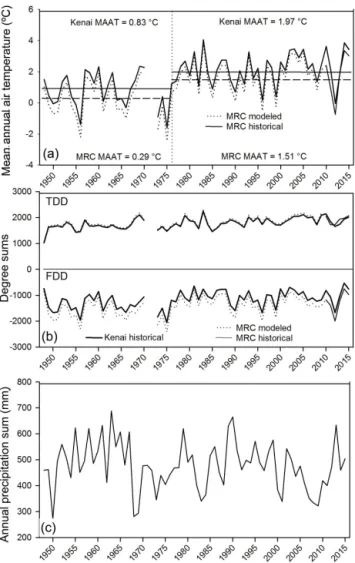
Figure 2. (a) Historical (1948–2015) mean annual air temper-ature compiled from Kenai Municipal Airport (WBAN 26523) hourly surface data and interpolated (broken) and measured (solid) mean annual air temperature for the MRC station (Kenai 29 ENE AWS 702590). (b) Thawing degree day (TDD) and freezing de-gree day (FDD) sums for 1948–2015 derived from historical and interpolated daily mean temperature.(c)Cumulative annual precip-itation data from the Kenai Municipal Airport (WBAN 26523) be-tween 1948 and 2015.
wetland complexes, elevated forested plateaus, primarily black spruce but with some paper birch and cottonwood and an understory of dwarf shrubs, exist where the ground surface has been elevated above the regional water table. We suspected these features were associated with a vol-umetric expansion of freezing peat, forming a permafrost plateau, an elevated permafrost feature associated with frost heave (Zoltai, 1972, 1993). Characterization of degrading permafrost plateaus was the focus of our studies on the Kenai Peninsula.
3 Methods
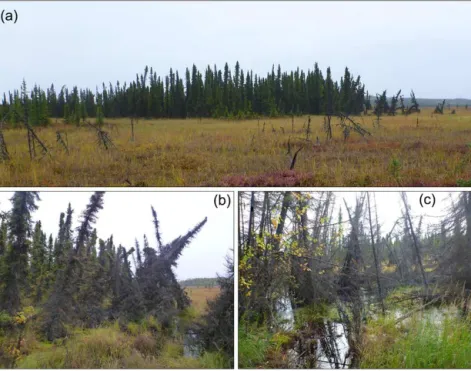
In September 2012, we conducted field studies at a num-ber of black spruce plateaus located within herbaceous wetland complexes (Figs. 1 and 3). These studies docu-mented frozen ground below an unfrozen layer with thick-nesses ranging from 0.49 m to>1.00 m. The plateau features
tended to have sharply defined scalloped edges, marginal thermokarst moats, and collapse-scar depressions on their summits (Fig. 3). These traits were characteristic of the per-mafrost features described by Hopkins et al. (1955) on the Kenai Peninsula and similar to permafrost plateaus across colder boreal regions (Zoltai, 1972; Thie, 1974; Jorgenson et al., 2001; Camill, 2005; Sannel et al., 2015). To answer whether the frozen deposits encountered at the black spruce plateaus were indeed permafrost, we collected continuous ground temperature measurements for 3 years, measured late-summer thaw depths, mechanically drilled and cored for the base of the frozen ground, imaged the subsurface with ground-penetrating radar (GPR), and analyzed a time series of high-resolution remotely sensed imagery. These research efforts are described in more detail below.
3.1 Field instrumentation and surveys
Table 1.Mean annual ground temperature (MAGT) data for four observation sites in the Kenai Peninsula lowlands. Browns Lake PF1, Watson Lake PF1, and Watson Lake PF2 represent permafrost plateaus and the Watson Lake non-PF site represents a black-spruce-forested non-plateau site. Sensor depths that were perennially frozen in a given year are in bold. Mean annual air temperature (MAAT), thawing and freezing degree days (TDD and FDD), and average winter snow depth (MASD) are from the MRC station (Kenai 29 ENE-AWS 702590).
KENAI 29 ENE AWS 702590 Browns Lake PF1 Watson Lake PF1 Watson Lake PF2 Watson Lake non-PF met station data
Sensor MAGT Sensor MAGT Sensor MAGT Sensor MAGT MAAT TDD FDD MASD depth (◦C) depth (◦C) depth (◦C) depth (◦C) (◦C) sums sums (cm)
(cm) (cm) (cm) (cm)
16 September 2012–15 September 2013
50 −0.02 10 0.34 10 0.05 25 0.94
0.88 1865.9 1544.3 19.3
100 –0.06 25 −0.09 50 −0.30 50 0.42
200 –0.08 50 −0.20 100 –0.08 100 0.14
300 –0.08 100 –0.08 200 –0.06 130 0.16
16 September 2013–15 September 2014
50a 0.17 10 0.93 10 0.86 25 0.57
2.58 2066.6 1123.4 8.3
100 –0.06 25 0.40 50 −0.07 50 0.32
200 –0.06 50 −0.02 100 –0.08 100 0.14
300 –0.08 100 –0.06 200 –0.08 130 0.14
16 September 2014–15 September 2015
50b – 10b – 10 1.53 25b –
3.24 2009.8 829.1 2.7
100 –0.04 25b – 50 0.14 50b –
200 –0.06 50b – 100 –0.07 100b –
300 –0.07 100b,c – 200c −0.07 130b –
athermistor failed on 24 August 2014,bthermistor or data logger failure, andcpermafrost thaw during observation period.
were post processed prior to summarizing the hourly ground temperature data into daily, monthly, and annual means.
Additional field surveys at each study site provided infor-mation on the geometry of the frozen ground distribution and deposit types. A tile probe was used to measure the depth to frozen sediments at each ground temperature monitoring location in mid-September 2015 (limited to 2.2 m bgs). At the two forested plateaus in the Watson Lake wetland com-plex, tile probing locations were selected randomly and split between hummock and depression microtopography. At the Browns Lake site, this depth was recorded at three points every meter along a 100 m transect across the plateau fea-ture. In addition, a topographic profile of the primary Browns Lake plateau was collected using a Leica survey-grade dif-ferential GPS (dGPS) system (±0.02 m vertical accuracy) on 9 October 2015 to adjust the probing measurements relative to the local topography. An additional dGPS profile was ac-quired on 19 February 2016 at an adjacent plateau to provide more relative feature height information in the wetland com-plex. At both the Browns Lake and Watson Lake locations, the frozen ground thickness was measured using the Kovacs Enterprise ice auger system powered by an 18 V portable drill. At Browns Lake (site PF-BL-6), a borehole was also core-drilled to a depth of 5.38 m using a SIPRE permafrost corer (5 cm diameter) with an engine auger head for analy-sis of the frozen ground deposit (Fig. 1). The frozen cores were described according to the cryofacies method (French and Shur, 2010) using cryostructure classification systems inspired by Murton and French (1994) and Kanevskiy et al. (2014). Gravimetric ice contents of eleven samples were measured by oven drying at 60◦C for 168 h. Volumetric ice contents were measured from ten well-preserved samples.
Implementation of GPR allowed for imaging of cer-tain characteristics of the frozen ground along the primary Browns Lake plateau feature. A shielded 100 MHz MALÅ antenna was used in July 2014 and Sensors & Software 100 MHz unshielded bistatic antennas in common-offset configuration in February 2016. The data were processed using commercially available Reflex-W processing software (Sandmeier, 2008). Basic processing steps included dewow filtering, time-zero correction, removing bad traces, and bandpass filtering (40–67.2–128–369 MHz for MALÅ; 25– 50–200–400 MHz for Sensors & Software). Additional pro-cessing steps included an average background subtraction with a running window of 20–100 traces to reduce noise from surface multiples, where applicable, and variable gain for viewing purposes. Care was taken during processing to pre-serve any flat-lying reflectors. Finally, the radargrams were corrected using the dGPS surface topography and converted two-way travel time to depth using an estimated average sub-surface velocity of 0.038 m ns−1calibrated to average direct
probe depths.
3.2 Remotely sensed imagery and change detection Historic aerial photography and contemporary high resolu-tion satellite imagery acquired between 1950 and ca. 2010 provided an estimated extent of forested plateaus centered on four wetland complexes on the western Kenai Peninsula lowlands. Four change detection study areas (Fig. 1) were selected based on the presence of forested-plateau features surrounded by herbaceous wetland vegetation that likely in-dicated permafrost presence in the boreal wetlands on the Kenai Peninsula (Hopkins et al., 1955). Arranged from north to south, these included portions of the Mystery Creek, Wat-son Lake, Browns Lake, and Tustumena Lake wetland com-plexes (Fig. 1). Mapping forested-plateau features and their change over time is a common method for detection of per-mafrost thaw in boreal wetlands. The land cover change as-sociated with conversion of a forested permafrost plateau to a lake or herbaceous wetland (i.e., bog or fen) is readily de-tectable in high-resolution remotely sensed imagery (Thie, 1974; Camill and Clark, 1998; Osterkamp et al., 2000; Jor-genson et al., 2001, 2008a; Payette et al., 2004; Quinton et al., 2011; Lara et al., 2016).
A 25 km2 square study area was overlaid at each of
the potential permafrost areas and clipped the wetland ex-tent as defined by the 2001 National Land Cover Dataset for Alaska (http://www.mrlc.gov/nlcd2011.php) to define the mapping area. Panchromatic, Digital Orthophoto Quadran-gle (DOQs) images were produced at a spatial resolution of 1.0 m for the entire Kenai Peninsula between July and August 1996. The DOQs provided the base upon which to georegister the other remotely sensed image datasets that consisted of panchromatic aerial photos collected in Au-gust 1950 (1 : 40 000 scale), color-infrared aerial photos ac-quired in 1984 (1 : 62 500 scale), and panchromatic high-resolution satellite images (<1 m spatial resolution)
ac-quired in ca. 2010. The mean RMS error associated with image georegistration was 1.82 m and ranged from 1.32 to 2.61 m. All images were sampled to a ground resolution of 1 m. Following image registration, forested plateaus were manually digitized in a geographic information system (Ar-cGIS v. 10.1) at a mapping scale of 1 : 1000 (Fig. 4). The high spatial resolution, georegistered remotely sensed datasets allowed for the assessment of residual permafrost plateau extent in four time slices (1950, 1984, 1996, ca. 2010) and change rates across three decadal-scale time periods: (1) 1950–1984 (34 years), (2) 1984–1996 (12 years), and (3) 1996–ca. 2010 (14 years).
3.3 Climate and weather data
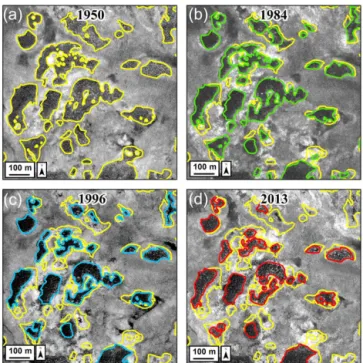
Figure 4.Time series documenting the extent of a subset of per-mafrost features in the Browns Lake wetland complex in(a)1950, (b)1984,(c)1996, and(d)2013. Permafrost plateau extent in 1950 is shown as a yellow polygon in each frame and other time slices outlined as green (1984), blue (1996), and red (2013).
1971 and 1973–present and sub-hourly air temperature data from the Kenai 29 ENE station (WBAN: 26563) located at the Alaska Department of Fish and Game Moose Research Center (MRC) from September 2010 to present. Since the MRC station is more representative of the field study sites, the temperature records for MRC were reconstructed back to 1948 using a linear regression function found between KMA and MRC daily mean temperatures as summarized from hourly and sub-hourly measurements. The regression equation was calculated by comparing daily mean tempera-ture for 1 January 2012 to 31 December 2015 and validating it against daily mean temperatures at the MRC for 1 Septem-ber 2010 to 31 DecemSeptem-ber 2011. Lastly, daily snow depth to-tals were acquired from September 2012 to September 2015 from MRC records (http://wcc.sc.egov.usda.gov/nwcc/site? sitenum=966).
4 Results
4.1 Ground thermal regime of south-central Alaskan permafrost
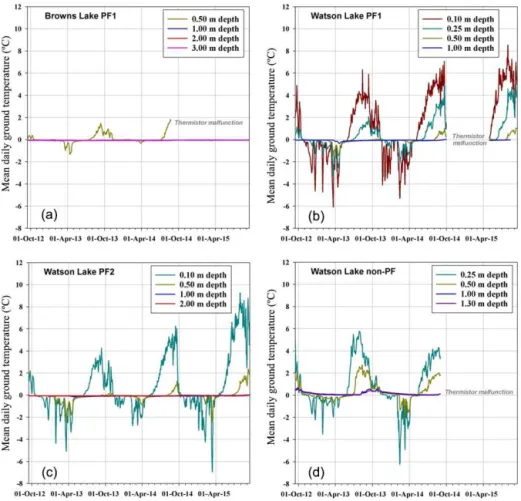
Calibrated ground temperature records collected between 16 September 2012 and 15 September 2015 at one forested plateau near Browns Lake and two forested plateaus near Watson Lake confirmed the presence of near-surface per-mafrost in the western Kenai Peninsula lowlands (Fig. 5a–c).
Over this time period, the MAGT of permafrost at 1.0 m bgs ranged from−0.04 to−0.08◦C (Table 1). At the Browns Lake PF1 and the Watson Lake PF2 sites, permafrost at 2.0 m bgs had a MAGT between−0.06 and −0.08◦C. At the Browns Lake PF1 site, permafrost at 3.0 m bgs had a MAGT between −0.07 and −0.08◦C (Table 1). No per-mafrost was detected at a black-spruce-forested, non-plateau site near Watson Lake between September 2012 and Au-gust 2014 (Fig. 5d).
During the 3-year observation period, an increase in near-surface ground temperatures was recorded at all three per-mafrost sites in response to increases in air temperature (Ta-ble 1, Fig. 5). The ground temperature at 0.5 m depth was substantially below 0◦C at all three sites during the 2012– 2013 winter with minimum temperatures between−1.33◦C (Browns Lake) and −2.50◦C (Watson Lake PF2). In the 2013–2014 winter, the ground at 0.5 m depth was barely frozen at the Browns Lake and Watson Lake PF1 sites (Fig. 5a and b), with minimum winter temperatures at −0.32 and−0.20◦C, respectively. The increase in summer ground temperatures at 0.5 m depth was also substantial. By the end of the 2012 warm period, this temperature was above 0◦C only at the Browns Lake site (the maximum was at 0.40◦C). At the Watson Lake PF1 and PF2 sites the temper-ature at 0.5 m depth was just below 0◦C and never exceeded the thawing threshold, indicating that the maximum summer thaw (the active layer thickness) was just below 0.5 m dur-ing 2012. However, durdur-ing the summers of 2013 and 2014, the active layer thickness was more than 0.5 m at both of these sites and the maximum temperatures in 2014 exceeded 1◦C at the Watson Lake sites (Fig. 5b and c). At the Browns Lake site the temperature at 0.5 m depth reached almost 2◦C before the thermistor malfunction. The ground temperature warming at 0.5 m depth continued in 2015 (Fig. 5b and c).
Figure 5.Mean daily ground temperature data plots for the four shallow boreholes in the western Kenai Peninsula lowlands for the period of 16 September 2012 to 15 September 2015:(a)Browns Lake PF1 site,(b)Watson Lake PF1 site,(c)Watson Lake PF2 site, and(d)Watson Lake non-PF site. All axes scales are the same but sensor depths vary among sites based on site characteristics. Missing data indicate sensor or thermistor failure.
4.2 Depth to permafrost table and permafrost thickness
The thaw depth at the data logger observation sites, as mea-sured with the tile probe on 16 September 2015, was 0.64 m for the Watson Lake PF1 site (n=3), 0.53 m for the Watson
Lake PF2 site (n=6), and 0.57 m for the Browns Lake PF1
site (n=6). More systematic probing at all three sites on
16 September 2015 showed that the average depth to the per-mafrost table where detectable (max probe length=2.20 m) was 1.48 m (n=222). However, probing did not encounter
frozen ground in the upper 2.20 m of the ground surface at an additional 140 measurement points, mostly associated with collapse-scar features and thermokarst moats. In general, depth to the permafrost table depended on the local topo-graphic conditions at each site. Hummocks (n=164) tended
to have a shallower depth to the permafrost table where mea-surable (average of 1.12 m), while depth to the permafrost table measurements in depressions (n=58) was larger
(aver-age of 1.53 m).
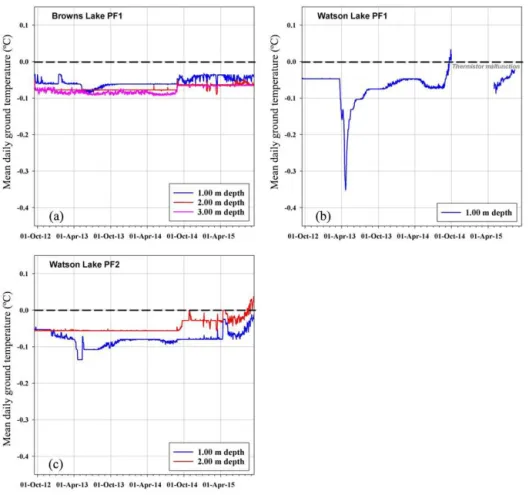
Figure 6.Mean daily ground temperature data plots indicating the presence of permafrost in the western Kenai Peninsula lowlands for the period of 16 September 2012 to 15 September 2015:(a)Browns Lake PF1 site,(b)Watson Lake PF1 site, and(c)Watson Lake PF2 site. Top-down permafrost thaw occurred at Watson Lake PF1 during the fall of 2014 and bottom-up permafrost thaw occurred at Watson Lake PF2 during the fall of 2015.
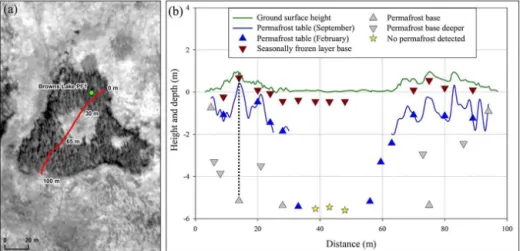
permafrost at the two marginal plateau measurement sites at the primary plateau feature indicated a permafrost thickness of 0.45 and 0.33 m (Fig. 7b). At the three interior plateau measurements points, permafrost was 5.57–5.65 m thick. At one of these locations (0.98 m relative height), a core was ac-quired. It consisted of frozen peat from 0.48 to 5.69 m bgs, overlying 0.25 m of unfrozen peat, with unfrozen mineral sediment at the base. At the other five locations where the bottom of permafrost was not reached, drilling operations documented permafrost at least down to between 3.5 and 4.0 m bgs (Fig. 7b), and contained frozen peat as well.
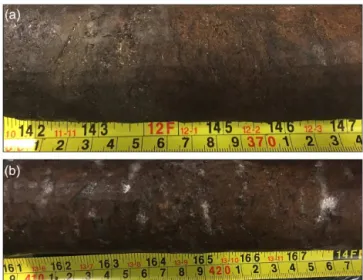
The permafrost core at the PF-BL-6 site was described as poorly decomposed peat with well-developed organic-matrix cryostructures, except between depths of 3.32–3.65 m where a layer of silt and peat with mainly microlenticular cryostructure was observed (Figs. 8 and 9). The gravimetric and volumetric ice contents of the peat varied between 883 and 1873 and 80–96 %, respectively, while they were 379– 447 and 81 %, respectively, in the previously mentioned silt and peat layer. The upper two meters of peat were character-ized mainly by an organic-matrix porphyritic cryostructure
transitioning to an organic-matrix microlenticular cryostruc-ture with some layered ice lenses. Below two meters, the peat was characterized mainly by an organic-matrix micro-lenticular cryostructure with some belt-like and suspended cryostructures.
infor-Figure 7. (a) High-resolution satellite image showing the permafrost plateau in the Browns Lake wetland complex where detailed field surveys were conducted as well as the location of the Browns Lake PF1 data logger (green dot).(b)A∼100 m transect across the Browns
Lake PF1 permafrost plateau site showing ground surface height above the wetland (green line), depth to the permafrost table (blue line and blue arrows), permafrost thickness constraints (grey arrows), seasonally frozen ground depth (maroon arrows), and lack of permafrost (yellow stars) as measured by probing, drilling, and coring. Locations where the permafrost table exceeded 2.2 m from the ground surface (limiting depth for September surveys) are indicated with a non-existent blue line. Locations where the base of the permafrost was encountered are indicated with an upward looking grey triangle and those locations where it was not encountered, a downward looking grey triangle. The black dashed vertical line represents the location of the PF-BL-6 permafrost core.
mation on the presence of a talik overlying the permafrost table.
4.3 Remote identification of permafrost plateaus In 1950, residual permafrost plateau extent accounted for 920 ha of the 4810 ha (19.1 %) of wetlands mapped within four change detection areas (Fig. 1, Table 2). Between 1950 and 1984, permafrost plateau extent decreased to 750 ha, at an average rate of 5.1 ha yr−1(Table 3). Between 1984 and
1996, permafrost extent dropped to 520 ha, at an average rate of 18.8 ha yr−1, the greatest rate documented in the study
pe-riods. Between 1996 and 2010, permafrost features contin-ued to degrade at a rate of 9.5 ha yr−1so that by 2010, only 370 ha of the permafrost features remained. Thus, between 1950 and ca. 2010, 60 % of the residual permafrost plateaus disappeared in the mapped study areas (Fig. 11 and Table 2). Assessment of change in the four wetland complexes showed differences in the extent and change rate of resid-ual permafrost plateaus overtime. The Mystery Creek study area had the most extensive permafrost plateau coverage (32.8 % of the wetland area analyzed) in the 1950s relative to the Watson Lake (9.8 %), Browns Lake (11.1 %), and Tus-tumena Lake (15.8 %) study areas (Table 2). By ca. 2010, permafrost plateau extent in each of the study areas dimin-ished to a cover of 14.8, 3.5, 3.8, and 5.2 %, respectively. Thus, there was a loss of 54.8 % of the plateau extent in the Mystery Creek study area, 64.7 % in the Watson Lake study area, 65.5 % in the Browns Lake study area, and 66.9 % in the Tustumena Lake study area between 1950 and ca. 2010. These changes equate to loss rates of 0.9 % yr−1 for
Mys-tery Creek and 1.1 % yr−1for the Watson, Browns, and Tus-tumena Lake study areas (Table 3). Mean area loss for all four sites was 0.8 % yr−1 between 1950 and 1984. During this time, loss rate was greatest for Watson Lake and Browns Lake and least for Mystery Creek. Mean loss rate for all four sites increased to 2.3 % yr−1between 1984 and 1996. Dur-ing this time, loss rates were greatest in the north and least in the south with Mystery Creek and Tustumena Lake los-ing 3.0 and 1.2 % yr−1, respectively. Average loss rates
Figure 8.Cryostratigraphy and ice contents from borehole PF-BL-6 (inspired by Kanevskiy et al., 2014). The gravimetric and volumet-ric ice contents of the peat varied between 883–1873 and 80–96 %, respectively, while they were 379–447 and 81 %, respectively, in the silt and peat layer located between 3.32 and 3.65 m.
and Watson and Browns Lake (both<1.0 %). The complete
loss of permafrost features was greatest in Browns Lake (22.4 %) and least in Watson Lake (8.3 %). Mystery Creek and Tustumena Lake had 10.5 and 12.3 %, respectively, of their permafrost plateaus disappear in the form of complete feature loss. During the period of remotely sensed obser-vations complete feature loss increased from 6.7 % (1950– 1984) to 21.0 % (1996–ca. 2010) of the detected change, while lateral feature loss decreased from 91.0 % (1950–1984) to 78.1 % (1996–ca. 2010) of the detected change, likely highlighting the role of fragmentation in promoting complete feature degradation.
4.4 Climate and weather data
The MAAT of the western Kenai Peninsula lowlands be-tween 1981 and 2010 was 2.22◦C for the KMA station and estimated to be 1.79◦C for the MRC station. There was sig-nificant correlation between the KMA and MRC daily mean air temperatures for the 2012–2015 period (r2=0.97). The
Figure 9. (a)Stratigraphic contact between the base of the frozen silt and peat layer, occurring at 3.65 m, and the underlying frozen peat.(b)Example of organic-matrix microlenticular to suspended cryostructures developed in the peat below the stratigraphic contact shown in(a).
regression equation performed well during validation tests (r2=0.95) and was therefore used to estimate daily
tem-perature data for the MRC station back to July 1948. Mean annual air temperature has increased by 0.4◦C since 1950, with a step increase occurring in 1976 associated with the Pacific Decadal Oscillation (PDO) (Hartmann and Wendler, 2005) (Fig. 2). Between July 1948 and December 1976, MAAT was 0.83 and 0.29◦C for KMA and MRC, re-spectively. Following the PDO shift MAAT increased to 1.97 and 1.51◦C for KMA and MRC, respectively (Fig. 2). Prior to the PDO shift, 18 (MRC) and 6 (KMA) out of 27 years had a MAAT below freezing, while after the PDO shift, only 10 (MRC) and 0 (KMA) out of 39 years had a MAAT below freezing. MAAT at the MRC station was 0.88◦C (2012), 2.58◦C (2013), and 3.24◦C (2014) dur-ing our 3-year ground temperature observation period of 16 September 2012 to 15 September 2015. Therefore, the ob-servations during 2014–2015 occurred during a period with anomalously high MAAT relative to the previous climate normal period, with more warming in the winter than the summer months (Table 1). Additionally, between 1948 and 2015, warm season (May–September) air temperatures in-creased by 0.02◦C yr−1 for both the Kenai and MRC
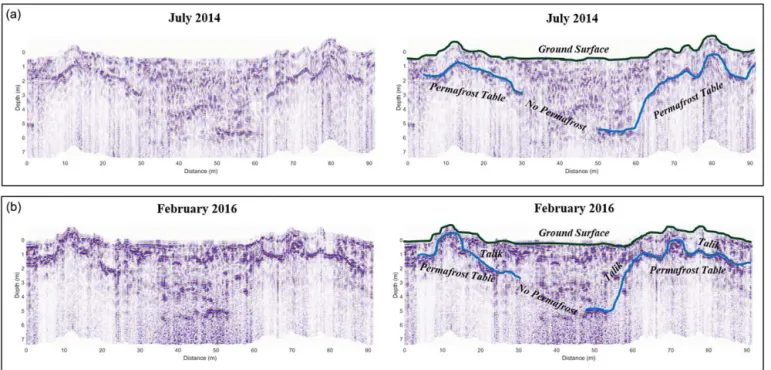
Figure 10.GPR profiles at the intensive Browns Lake permafrost plateau (Fig. 7a) from(a)late July 2014 with MALÅ shielded 100 MHz antennas and(b)mid-February 2016 with Sensors & Software unshielded bistatic 100 MHz antennas. Processed radargrams are on the left and processed, interpreted radargrams are on the right. Both summer and winter profiles clearly show reflectors associated with the permafrost table and in the case of(b)show the presence of a talik. However, we were unable to image the permafrost base using GPR. Note that the two GPR transects differ slightly in their orientation across the feature.
5 Discussion
5.1 Presence of ecosystem-protected permafrost in south-central Alaska
These permafrost data for the residual permafrost plateaus on the Kenai Peninsula are the first such observations for iso-lated permafrost bodies in south-central Alaska (Osterkamp, 2007). Based on the five classes of permafrost proposed by Shur and Jorgenson (2007), the permafrost present in wet-land complexes of the western Kenai Peninsula lowwet-lands is ecosystem-protected. The permafrost on the Kenai Peninsula is extremely warm, with a MAGT that ranges from−0.04 to −0.08◦C (Table 1; Fig. 6). Permafrost ground temperatures at all monitoring sites were near the phase-equilibrium tem-perature at depths from 1.0 to 3.0 m. Latent-heat effects associated with unfrozen water content in permafrost and with seasonal phase changes in the active layer can buffer the ground thermal regime from changes in air tempera-ture at warm permafrost sites (Romanovsky and Osterkamp, 2000) and in part can explain the persistence of ecosystem-protected permafrost on the Kenai Peninsula (Shur and Jor-genson, 2007; Jorgenson et al., 2010). Even though all ther-mistors were calibrated prior to installation, the ability to re-solve such warm permafrost temperatures and their change over time using temperature alone is somewhat limiting. Thus, future measurements at the residual permafrost plateau
sites in south-central Alaska will be accompanied by the ad-dition of soil moisture probes as well as borehole, nuclear magnetic resonance (NMR), which provides a direct measure of liquid water content (Parsekian et al., 2013).
Field surveys that included probing, augering, coring, and GPR provided additional information on the vertical and spa-tial distribution of the warm permafrost in the western Ke-nai Peninsula lowlands. The average active layer thickness at the permafrost plateau ground temperature observation sites was 0.58 m. These sites were chosen for initial instrumenta-tion in September 2012 based in part on the relatively shal-low depth to the frost table. More comprehensive probing in September 2015 revealed that the average depth to the permafrost table was 1.48 m (n=222) as averaged across
lay-ered ice lenses, and belt-like and suspended cryostructures (Figs. 8 and 9). Laboratory analysis also revealed gravimet-ric and volumetgravimet-ric ice contents up to 1873 and 96 %, respec-tively (Fig. 8).
5.2 Extent and change in residual permafrost plateaus since the 1950s
While previous reports of permafrost on the Kenai Penin-sula exist (Hopkins et al., 1955; Jorgenson et al., 2008b), they were restricted to the wetland complex (Mystery Creek) north of Sterling (Berg et al., 2009). Information on its dy-namics here and elsewhere was lacking. The analysis of re-motely sensed imagery and field surveys identified residual permafrost plateaus in three additional wetland complexes where it had not been previously identified (Figs. 1 and 11) and indicated that the state of permafrost within the Kenai lowlands is highly dynamic. In 1950, forested-permafrost plateau extent accounted for 19.0 % of the land cover in the 4810 ha of wetland complexes analyzed in the four change-detection study areas. In each of the wetland areas analyzed, permafrost plateaus accounted for more than 10.0 % of the area in 1950. However, inferred permafrost extent decreased by 60.0 % between 1950 and ca. 2010, and its lateral cov-erage dropped below 5.0 % in three of the four study areas (Table 2).
The residual permafrost plateaus documented in this study share similar attributes to features elsewhere in boreal peat-lands for which permafrost degradation has been inferred due to the ease of remotely detecting the conversion from forested permafrost plateau to non-permafrost herbaceous wetland or waterbody (Jorgenson et al., 2001, 2008a, 2012). Thie (1974) inferred a permafrost plateau loss rate of 0.47 % yr−1between 1800 and 1960 for a 130 000 ha area of
southern Manitoba. In Québec, Canada, a 13 ha peat bog lost 1.80 % yr−1 between 1957 and 2003 (Payette et al., 2004).
In the Northwest Territories, Canada, Quinton et al. (2011) reported a loss rate of 0.62 % yr−1between 1947 and 2008 across a 100 ha study area. In interior Alaska (Tanana Flats), Jorgenson et al. (2001) reported a loss rate of 0.76 % yr−1for birch-forested permafrost plateaus between 1949 and 1995 using a point sampling method within a 260 000 ha wet-land area. Lara et al. (2016) recently updated these numbers for the Tanana Flats by manually digitizing features with methods similar to ours and demonstrated that birch forest plateaus decreased at a much slower rate of 0.12 % yr−1, and that black-spruce-forested permafrost plateau features ap-peared to be stable. Thus, the loss rate of 1.0 % yr−1that we report for the 4810 ha mapped on the western Kenai Penin-sula lowlands between 1950 and ca. 2010 are the second fastest change rates reported thus far in boreal peatlands.
T able 2. Permafrost plateau extent mapped in each study re gion in 1950, 1984, 1996, and ca. 2010. Analyzed we tland area for each study re gion is gi ven along with the number of features, total plateau area, mean plateau area, and plateau extent for each image observ ation ye ar . Ca. 2010 refers to images acquired in 2011 (Mystery Creek and W atson Lak e), 2012 (T ustumena Lak e), and 2013 (Bro wns Lak e). 1950 1984 1996 ca. 2010 Study W etland Number of Total Mean Plateau Number of Total Mean Plateau Number of Total Mean Plateau Number of Total Mean Plateau re gion area features plateau plateau extent features plateau plateau extent features plateau plateau extent features plateau plateau extent (ha) area area (%) area area (%) area area (%) area area (%) (ha) (ha) (ha) (ha) (ha) (ha) (ha) (ha) Mystery 1562.0 212 511.5 2.4 32.7 237 457.7 1.9 29.3 335 292.6 0.9 18.7 321 232.3 0.7 14.9
Creek Watson
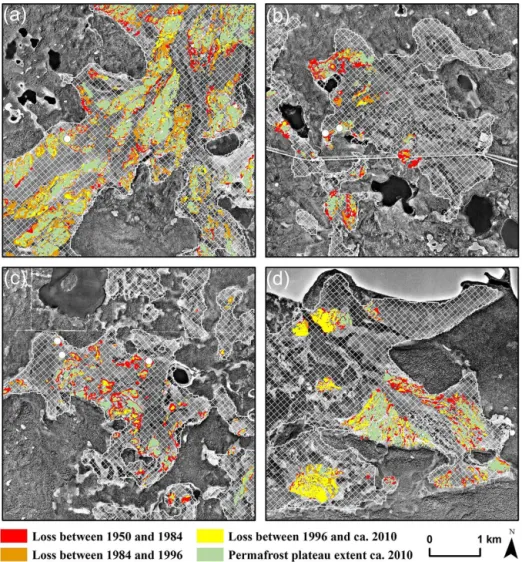
Figure 11. Spatial and temporal pattern of permafrost loss within four change detection areas: (a) Mystery Creek,(b) Watson Lake, (c)Browns Lake, and(d)Tustumena Lake. Red indicates feature loss between 1950 and 1980, orange is feature loss between 1984 and 1996, yellow is feature loss between 1996 and ca. 2010, and green is ca. 2010 permafrost plateau extent. The white dots indicate the location of field-verified permafrost between 2009 and 2016. The hatched white polygons indicate the wetland extent where plateau features were mapped in each study area. Background imagery is the 1996 orthophotography.
5.3 Drivers of permafrost loss
Permafrost on the Kenai Peninsula is likely degrading as a result of warming air temperatures (+0.4◦C decade−1 since 1950), especially where warming during the winter sea-son likely exacerbates these effects (Table 4). During the 3-year observation period as well as since the 1950s, warming in the winter has been more pronounced than in the summer (Table 1 and Fig. 2) and 2014–2015 had a MAAT roughly double that of the 1981–2010 climate normal period. Storm systems regularly bring warm air masses (>4◦C) to the
re-gion during the winter. Air temperature warming during the winter months has decreased the number of freezing-degree days, which means that the ground freezes to a much lesser degree in the winter (Fig. 2 and Table 1). Therefore, ground temperatures decreased less over the winter period (Fig. 5 and Table 1), potentially leading to talik development.
Pre-vious research on permafrost plateaus in colder regions in-dicate that preferential warming in the winter and increased snow accumulation leads to enhanced permafrost thaw in bo-real peatlands (Camill, 2005; Osterkamp, 2007). Since the Kenai Peninsula lowlands experience a semi-continental cli-mate due to the rain shadow produced by the Kenai Moun-tains, a lack of winter snowfall may have contributed to permafrost persistence in this region by allowing relatively cold winter air temperatures to propagate into the subsurface. Thus, talik formation and permafrost degradation at the study sites in south-central Alaska are likely being driven for the most part by winter air temperature warming (Fig. 2).
Table 3.Change in the extent of permafrost plateaus for each of the study regions between 1950 and ca. 2010, 1950 and 1984, 1984 and 1996, and 1996 and ca. 2010. Change is reported in aerial units per year, proportional area change, percent change per year, and by the type of change. Change type refers to whether the plateau loss occurred along the periphery of a feature (lateral), in the center of a feature (internal), or whether complete loss of a feature occurred. Ca. 2010 refers to images acquired in 2011 (Mystery Creek and Watson Lake), 2012 (Tustumena Lake), and 2013 (Browns Lake).
Study area Area Proportional Percent Change type
change area change change Lateral Internal Complete (ha yr−1) (ha yr−1100 ha−1) (% yr−1) (%) (%) (%)
1950 to ca. 2010
Mystery Creek −4.6 −0.3 −0.9 86.2 3.3 10.5
Watson Lake −0.9 −0.1 −1.1 90.9 0.8 8.3
Browns Lake −1.2 −0.1 −1.0 77.2 0.3 22.4
Tustumena Lake −2.3 −0.2 −1.1 86.0 1.7 12.3
All sites −9.2 −0.2 −1.0 85.1 1.5 13.4
1950 to 1984
Mystery Creek −1.6 −0.1 −0.3 88.8 5.2 5.9
Watson Lake −1.0 −0.1 −1.1 91.7 1.4 6.9
Browns Lake −1.3 −0.1 −1.2 89.0 0.6 10.1
Tustumena Lake −1.2 −0.1 −0.6 94.1 2.1 3.8
All sites −5.1 −0.1 −0.6 91.0 2.3 6.7
1984 to 1996
Mystery Creek −13.8 −0.9 −3.0 87.1 1.8 11.2
Watson Lake −1.6 −0.2 −2.9 88.7 0.6 10.7
Browns Lake −1.3 −0.1 −2.0 84.0 0.1 16.0
Tustumena Lake −2.1 −0.2 −1.2 85.1 2.9 12.0
All sites −18.7 −0.4 −2.5 86.2 1.3 12.5
1996 to ca. 2010
Mystery Creek −4.0 −0.3 −1.4 82.7 3.0 14.3
Watson Lake −0.4 −0.1 −1.1 92.2 0.5 7.3
Browns Lake −0.7 −0.1 −1.4 58.7 0.1 41.2
Tustumena Lake −4.6 −0.3 −3.2 78.7 0.2 21.1
All sites −9.5 −0.2 −1.8 78.1 1.0 21.0
Table 4. Mean annual, mean summer (May to September), and mean winter (October to April) air temperature for the three remotely sensed image observation periods compiled from the Kenai Municipal Airport (WBAN 26523) and estimated from the MRC station (Kenai 29 ENE-AWS 702590).
Mean annual air Mean summer air Mean winter air temperature (◦C) temperature (◦C) temperature (◦C)
Remote sensing Kenai MRC Kenai MRC Kenai MRC time period Airport Airport Airport
1950 to 1984 1.12 0.59 9.92 10.39 −5.29 −6.54
1984 to 1996 1.77 1.31 10.28 10.78 −4.37 −5.52
1996 to 2015 2.34 1.86 10.81 11.31 −3.77 −4.95
large areas of permafrost already close to thawing, to quickly thaw, leaving only colder permafrost and permafrost with in-tact peat and forest cover. Fire can be an important driver of permafrost thaw (Yoshikawa et al., 2002) and thermokarst
numer-ous sites in the Watson Lake and Browns Lake study areas. Watson Lake and Browns Lake subsequently had the two greatest loss rates between 1950 and 1984, which may be re-lated to the 1947 fire. However, the presence of black spruce burn poles were not found on all permafrost plateaus vis-ited indicating that the burning was likely relatively patchy in the wetlands. At Browns Lake, permafrost plateaus that did not burn in 1947 exhibited less degradation, had thicker per-mafrost, denser tree cover, and larger trees than the plateaus that burned. Large portions of the Tustumena Lake study area burned in the 1996 Crooked Creek Fire and 2005 Fox Creek Fire. These fires likely damaged, and partially removed, the protective ecosystem cover (black spruce forest and peat) and degraded several permafrost plateau features. This resulted in the Tustumena study area having the highest change rate for the latter time period and 77.0 % of the plateau loss that oc-curred between 1996 and ca. 2010 did so in areas that burned in the 1996 and 2005 fires.
Bottom-up permafrost degradation was documented over the short period of direct measurements between 2012 and 2015. The bottom-up permafrost thaw observed at the Wat-son Lake PF2 site indicates that the flow of groundwater be-low the permafrost plateaus could be responsible for degra-dation (Walters et al., 1998). In addition, analysis of the re-motely sensed imagery for the four select wetland complexes primarily documented lateral permafrost degradation since the 1950s, as inferred by the conversion of forested plateau margins to herbaceous wetland vegetation. This type of fea-ture loss accounted for 85.0 % of the change between 1950 and ca. 2010. This pattern of loss was further observed in the field through the presence of thermokarst moats and drown-ing black spruce trees along the margins of the permafrost plateaus (Fig. 3). This is similar to the dominant processes documented in more northerly boreal peatlands with per-mafrost plateaus (Thie, 1974; Camill and Clark, 1998; Os-terkamp et al., 2000; Jorgenson et al., 2001, 2012; Payette et al., 2004; Quinton et al., 2011; O’Donnell et al., 2012; Lara et al., 2015). These findings highlight the importance of groundwater flow and also the impact of saturated herba-ceous wetlands that absorb heat during the summer, which likely degrades permafrost along the peat plateau margins (Walters et al., 1998). It is possible that lateral permafrost degradation caused by these processes is overwhelming the protection provided by the ecosystem cover for permafrost stability on the Kenai Peninsula lowlands. Future research is required to more fully understand the role of groundwater movement on permafrost instability in the study region.
5.4 Proposed history of permafrost on the Kenai Peninsula
During the Last Glacial Maximum (LGM), Northern Hemi-sphere permafrost extended much further south than present day (Lindgren et al., 2015). However, permafrost history in south-central Alaska is poorly constrained. Even though the
western Kenai Peninsula lowlands were almost completely glaciated during the LGM (Reger et al., 2007), the per-mafrost features identified in this study occur in glaciola-custrine or glaciofluvial wetland complexes that were either not glaciated during the LGM (Mystery Creek) or became deglaciated before 16 000 cal years BP (Reger et al., 2007). Perhaps permafrost formed on the Kenai Peninsula during deglaciation or shortly thereafter during the Younger Dryas 12 900–11 700 years ago (Jones et al., 2009). However, this permafrost would have likely thawed during the Holocene Thermal Maximum (Zoltai, 1972; Kaufman et al., 2004). As the regional climate became cooler and wetter, between 8000 and 5000 years ago,Sphagnumaccumulation and preserva-tion on the western Kenai Peninsula lowlands may have pro-moted more widespread permafrost aggradation (Jones et al., 2009). Following this period, the peatlands may have pro-gressively become frozen, heaving the permafrost plateaus above the water table, drying the peat-rich soils, promoting growth of black spruce, and creating a buffer layer protect-ing the underlyprotect-ing permafrost (ecosystem-protected) from the unfavorable climate for permafrost that currently exists today (Zoltai, 1972, 1995; Payette et al., 2004; Camill, 2005; Shur and Jorgenson, 2007). Growth of permafrost and heav-ing the peatland surface above the water table could ex-plain low peat accumulation rates calculated in many Ke-nai Peninsula peatlands between 3300 and 2000 years ago (Jones and Yu, 2010; Jones et al., 2014). This also coin-cides with widespread neoglaciation on the Kenai Peninsula 3000–1500 years ago (Wiles and Calkin, 1994, Barclay et al., 2009). Alternatively, the Little Ice Age (365–165 years ago) promoted shallow permafrost formation in areas that were predominantly unfrozen throughout the Holocene (Ro-manovsky et al., 1992; Jorgenson et al., 2001), and thus, could account for the presence of residual permafrost on the Kenai Peninsula. The widespread loss of permafrost plateaus in central Alaska may be a result of degradation of Little Ice Age permafrost (Jorgenson et al., 2001). The age, his-tory, and future trajectory of permafrost on the western Kenai Peninsula lowlands require further study.
5.5 Landscape dynamics and permafrost thaw in the western Kenai Peninsula lowlands
vegetation in wetlands (Berg et al., 2009) may be attributed to warmer air temperatures and decreases in precipitation. Fur-thermore, tectonic activity associated with the Great Alaska Earthquake of 1964 caused the western Kenai Peninsula to lower in elevation by 0.7–2.3 m (Plafker, 1969), while the northern portion of the peninsula subsequently uplifted 0.8– 0.9 m (Cohen and Freymueller, 1997), potentially altering groundwater flow paths (Gracz, 2011).
In this study, the loss of ecosystem-protected permafrost in the overall understanding of landscape dynamics in the western Kenai Peninsula lowlands was documented and in-corporated. The degradation of permafrost can impact terres-trial and aquatic ecosystems, hydrology, infrastructure, and carbon cycling on the Kenai Peninsula (Schuur et al., 2008; Grosse et al., 2011; Jorgenson et al., 2013; Kokelj et al., 2015; Vonk et al., 2015). Permafrost degradation within the wetlands is responsible for a shift from black spruce forest plateaus to fen and bog wetland ecosystems at a mean rate of 9.2 ha yr−1 since the 1950s in the four change detection
study areas. Permafrost plateaus redirect surface and near-surface drainage in boreal wetlands (Quinton et al., 2011), and the thaw subsidence of these features increases drainage network connectivity (Beilman and Robinson, 2003) and al-ters the local hydrological cycle (Hayashi et al., 2007). Thus, the loss of permafrost and/or changes in seasonally frozen ground phenology could in part be aiding in observations of terrestrial and aquatic changes that have occurred on the Ke-nai Peninsula during the past several decades. Further work is required to better understand the past influence of permafrost on the Kenai Peninsula as well as the future loss of these warm permafrost deposits.
6 Conclusions
Based on the ground data and remotely sensed observations, it was found that peatland permafrost is currently more ex-tensive than previously reported in south-central Alaska, a region with a MAAT of 1.5◦C. Warm permafrost (−0.04 to −0.08◦C) persists on the western Kenai Peninsula lowlands in forested (black spruce), peat plateaus found in glaciola-custrine and glaciofluvial wetland complexes. At the field study sites, the depth to permafrost table on the peat plateaus averaged 1.48 m in September 2015 but was as shallow as 0.53 m at some locations. Permafrost thickness ranged from 0.33 m to greater than 6.90 m. Field surveys conducted in February 2016 documented the presence of a talik overlying the permafrost table. In 1950, residual permafrost plateaus covered 19.0 % of the 4810 ha wetland area mapped in the study. Within the changed detection study areas, 60.0 % of the permafrost plateaus present in 1950 had degraded by ca. 2010. In most cases, permafrost degradation equated to the loss of forest and its replacement by bog or fen vege-tation that preferentially occurred along permafrost plateau margins. Permafrost loss on the Kenai Peninsula is likely
associated with a warming climate, particularly during the winter season, wildfires that remove the protective ecosys-tem cover, groundwater flow at depth, and lateral heat trans-fer from wetland surface waters in the summer. Future stud-ies on the residual permafrost plateaus on the Kenai Penin-sula will provide further insight for mapping and predicting permafrost extent across boreal permafrost regions that are currently warming.
7 Data availability
All data available upon request to the corresponding author.
Author contributions. Benjamin M. Jones devised the study design
and prepared the paper with contributions from all co-authors. Ben-jamin M. Jones, Carson A. Baughman, Vladimir E. Romanovsky, Esther L. Babcock, Andrew D. Parsekian, Miriam C. Jones, and Edward E. Berg contributed to field instrumentation and field studies. Benjamin M. Jones, Carson A. Baughman, and Guido Grosse conducted and contributed to remote sensing anal-ysis. Carson A. Baughman compiled and interpolated regional weather and climate station data. Eva Stephani conducted the cry-ofacies analysis and laboratory testing. All co-authors contributed substantially to this research.
Acknowledgements. Funding for this research was provided
by the US Geological Survey Land Change Science and Land Remote Sensing programs. Support was also provided by the Russian Science Foundation (project RNF 16-17-00102). We thank the Kenai National Wildlife Refuge for granting permission to access field sites. We thank Kelly Harrell, Kobuk Kashi, Lydia Zeglin, Josefine Lenz, Emiline Ostlind, and Callie Zuck for help with fieldwork. We thank David Swanson, Eric Klein, Neal Pastick, Mikhail Kanevskiy, and Andreas Kääb for providing useful feedback and edits on an earlier version of this paper. Any use of trade, product, or firm names is for descriptive pur-poses only and does not imply endorsement by the US Government.
Edited by: A. Kääb
Reviewed by: M. Kanevskiy and A. Kääb
References
Anderson, R. S., Hallett, D. J., Berg, E., Jass, R. B., Toney, J. L., de Fontaine, C. S., and DeVolder, A.: Holocene development of Boreal forests and fire regimes on the Kenai Lowlands of Alaska, Holocene, 16, 791–803, doi:10.1191/0959683606hol966rp, 2006.
Barclay, D. J., Wiles, G. C., and Calkin, P. E.: Holocene glacier fluc-tuations in Alaska, Quaternary Sci. Rev., 28, 2034–2048, 2009. Beilman, D. W. and Robinson, S. D.: Peatland permafrost thaw and
Beilman, D. W., Vitt, D. H. ,and Halsey, L. A.: Localized Per-mafrost Peatlands in Western Canada: Definition, Distribu-tions, and Degradation, Arct. Antarct. Alp. Res., 33, 70–77, doi:10.2307/1552279, 2001.
Berg, E. E. and Anderson, R. S.: Fire history of white and Lutz spruce forests on the Kenai Peninsula, Alaska, over the last two millennia as determined from soil charcoal, Forest Ecol. Man-age., 227, 275–283, doi:10.1016/j.foreco.2006.02.042, 2006. Berg, E. E., David Henry, J., Fastie, C. L., De Volder, A. D., and
Matsuoka, S. M.: Spruce beetle outbreaks on the Kenai Penin-sula, Alaska, and Kluane National Park and Reserve, Yukon Ter-ritory: Relationship to summer temperatures and regional differ-ences in disturbance regimes, Forest Ecol. Manage., 227, 219– 232, doi:10.1016/j.foreco.2006.02.038, 2006.
Berg, E. E., Hillman, K. M., Dial, R., and DeRuwe, A.: Recent woody invasion of wetlands on the Kenai Peninsula Lowlands, south-central Alaska: a major regime shift after 18 000 years of wet Sphagnum–sedge peat recruitment, Can. J. Forest Res., 39, 2033–2046, doi:10.1139/X09-121, 2009.
Brown, J., Ferrians, O. J., Heginbottom, J. A., and Melnikov, E. S.: Circum-Arctic Map of Permafrost and Ground Ice Conditions, Boulder, CO, National Snow and Ice Data Center, digital media, 1998.
Brown, R. J. E.: The Distribution of Permafrost and Its Relation to Air Temperature in Canada and the U.S.S.R., Arctic, 13, 163– 177, doi:10.14430/arctic3697, 1960.
Brown, R. J. E.: Permafrost in Canada: its influence on Northern development, University of Toronto Press, Toronto, 1970. Cable, W. L., Romanovsky, V. E., and Jorgenson, M. T.:
Scaling-up permafrost thermal measurements in western Alaska us-ing an ecotype approach, The Cryosphere, 10, 2517–2532, doi:10.5194/tc-10-2517-2016, 2016.
Camill, P.: Patterns of boreal permafrost peatland vegetation across environmental gradients sensitive to climate warming, Can. J. Bot., 77, 721–733, doi:10.1139/b99-008, 1999.
Camill, P.: Permafrost Thaw Accelerates in Boreal Peatlands Dur-ing Late-20th Century Climate WarmDur-ing, Climatic Change, 68, 135–152, doi:10.1007/s10584-005-4785-y, 2005.
Camill, P. and Clark, J. S.: Climate Change Disequilibrium of Bo-real Permafrost Peatlands Caused by Local Processes, Am. Nat., 151, 207–222, doi:10.1086/286112, 1998.
Cohen, S. C. and Freymueller, J. T.: Deformation of the Kenai Peninsula, Alaska, J. Geophys. Res.-Solid Ea., 102, 20479– 20487, 1997.
Ferrians, O. J.: Permafrost Map of Alaska, US Geological Sur-vey Miscellaneous Geologic Investigations Map I-445, scale 1 : 2 500 000, US Geological Survey, Washington, D.C., 1965. French, H. and Shur, Y.: The principles of cryostratigraphy,
Earth-Sci. Rev., 101, 190–206, doi:10.1016/j.earscirev.2010.04.002, 2010.
Gooseff, M. N., Balser, A., Bowden, W. B., and Jones, J. B.: Ef-fects of Hillslope Thermokarst in Northern Alaska, Eos T. Am. Geophys. Un., 90, 29–30, doi:10.1029/2009EO040001, 2009. Gracz, M. B.: Comment on “Wetland drying and succession across
the Kenai Peninsula Lowlands, south-central Alaska” Appears in Can. J. Forest Res. 35: 1931–1941 (2005), Can. J. Forest Res., 41, 425–428, doi:10.1139/X10-147, 2011.
Grosse, G., Harden, J., Turetsky, M., McGuire, A. D., Camill, P., Tarnocai, C., Frolking, S., Schuur, E. A. G., Jorgenson, T.,
Marchenko, S., Romanovsky, V., Wickland, K. P., French, N., Waldrop, M., Bourgeau-Chavez, L., and Striegl, R. G.: Vul-nerability of high-latitude soil organic carbon in North Amer-ica to disturbance, J. Geophys. Res.-Biogeo., 116, G00K06, doi:10.1029/2010JG001507, 2011.
Hartmann, B. and Wendler, G.: The significance of the 1976 Pacific climate shift in the climatology of Alaska, J. Climate, 18, 4824– 4839, 2005.
Hayashi, M., Goeller, N., Quinton, W. L., and Wright, N.: A simple heat-conduction method for simulating the frost-table depth in hydrological models, Hydrol. Process., 21, 2610–2622, doi:10.1002/hyp.6792, 2007.
Hopkins, D. M., Karlstrom, T. N. V., Black, R. F., Williams, J. R., Pewe, T. L., Fernald, A. T., and Muller, E. H.: Permafrost and Ground Water in Alaska, Geological Survey Professional Paper, US Geological Survey, United States Government Printing Of-fice, Washington, D.C., 1955.
Jones, B. M.: Land-cover change on the southern Kenai Peninsula lowlands, Alaska using USGS land cover trends methodology, J. Geogr. Reg. Plan., 1, 068–071, 2008.
Jones, B. M., Grosse, G., Arp, C. D., Miller, E., Liu, L., Hayes, D. J., and Larsen, C. F.: Recent Arctic tundra fire initiates widespread thermokarst development, Sci. Rep., 5, doi:10.1038/srep15865, 2015.
Jones, M. C., Peteet, D. M., Kurdyla, D., and Guilderson, T.: Climate and vegetation history from a 14,000-year peatland record, Kenai Peninsula, Alaska, Quatern. Res., 72, 207–217, doi:10.1016/j.yqres.2009.04.002, 2009.
Jones, M. C., Wooller, M., and Peteet, D. M.: A deglacial and Holocene record of climate variability in south-central Alaska from stable oxygen isotopes and plant macrofossils in peat, Qua-ternary Sci. Rev., 87, 1–11, 2014.
Jorgenson, M. T. and Osterkamp, T. E.: Response of boreal ecosys-tems to varying modes of permafrost degradation, Can. J. Forest Res., 35, 2100–2111, doi:10.1139/x05-153, 2005.
Jorgenson, M. T., Racine, C. H., Walters, J. C., and Osterkamp, T. E.: Permafrost Degradation and Ecological Changes Associated with a Warming Climate in Central Alaska, Climatic Change, 48, 551–579, doi:10.1023/A:1005667424292, 2001.
Jorgenson, M. T., Roth, J. E., Schlentner, S. F., Pullman, E. R., and Macander, M.: An ecological land survey for Fort Richardson, Alaska (No. ERDC/CRREL-TR-03-19), Engineer Research And Development Center Hanover Cold Regions Research And En-gineering Lab, Hanover, NH, 2003.
Jorgenson, M. T., Shur, Y. L., and Pullman, E. R.: Abrupt increase in permafrost degradation in Arctic Alaska, Geophys. Res. Lett., 33, L02503, doi:10.1029/2005GL024960, 2006.
Jorgenson, M. T., Shur, Y. L., and Osterkamp, T. E.: Thermokarst in Alaska, in: Proceedings of the Ninth International Conference on Permafrost, Vol. 1, 29 June–3 July 2008, Fairbanks, Alaska, edited by: Kane, D. L. and Hinkel, K. M., Institute of Northern Engineering, University of Alaska, Fairbanks, 869–876, 2008a. Jorgenson, M. T., Yoshikawa, K., Kanevskiy, M. Z., Shur, Y.,
Ro-manovsky, V. E., Marchenko, S., Grosse, G., Brown, J., and Jones, B. M.: Permafrost characteristics of Alaska, in: 9th In-ternational Conference on Permafrost, Fairbanks, AK, 2008b. Jorgenson, M. T., Romanovsky, V., Harden, J., Shur, Y., O’Donnell,
Re-silience and vulnerability of permafrost to climate change, Can. J. Forest Res., 40, 1219–1236, doi:10.1139/X10-060, 2010. Jorgenson, M. T., Kanevskiy, M., Shur, Y., Osterkamp, T., Fortier,
D., Cater, T., and Miller, P.: Thermokarst lake and shore fen de-velopment in boreal Alaska, in: Proceedings of the Tenth Inter-national Conference on Permafrost, Vol. 1 InterInter-national contribu-tions, 25–29 June 2012, Salekhard, Russia, edited by: Hinkel, K. M., The Northern Publisher, Salekhard, Russia, 179–184, 2012. Jorgenson, M. T., Harden, J., Kanevskiy, M., O’Donnell, J.,
Wick-land, K., Stephanie Ewing, Manies, K., Zhuang, Q., Shur, Y., Striegl, R., and Koch, J.: Reorganization of vegetation, hydrol-ogy and soil carbon after permafrost degradation across het-erogeneous boreal landscapes, Environ. Res. Lett., 8, 035017, doi:10.1088/1748-9326/8/3/035017, 2013.
Kanevskiy, M., Shur, Y., Krzewinski, T., and Dillon, M.: Structure and properties of ice-rich permafrost near An-chorage, Alaska, Cold Reg. Sci. Technol., 93, 1–11, doi:10.1016/j.coldregions.2013.05.001, 2013.
Kanevskiy, M., Jorgenson, T., Shur, Y., O’Donnell, J. A., Harden, J. W., Zhuang, Q., and Fortier, D.: Cryostratigraphy and Permafrost Evolution in the Lacustrine Lowlands of West-Central Alaska, Permafrost Periglac. Process., 25, 14–34, 2014.
Kaufman, D. S., Ager, T. A., Anderson, N. J., Anderson, P. M., An-drews, J. T., Bartlein, P. J., Brubaker, L. B., Coats, L. L., Cwynar, L. C., Duvall, M. L., and Dyke, A. S.: Holocene thermal maxi-mum in the western Arctic (0–180 W). Quaternary Sci. Rev., 23, 529–560, 2004.
Klein, E., Berg, E. E., and Dial, R.: Wetland drying and succession across the Kenai Peninsula Lowlands, south-central Alaska, Can. J. Forest Res., 35, 1931–1941, doi:10.1139/x05-129, 2005. Kokelj, S. V., Tunnicliffe, J., Lacelle, D., Lantz, T. C., Chin, K.
S., and Fraser, R.: Increased precipitation drives mega slump development and destabilization of ice-rich permafrost ter-rain, northwestern Canada, Global Planet. Change, 129, 56–68, doi:10.1016/j.gloplacha.2015.02.008, 2015.
Lachenbruch, A. H. and Marshall, B. V.: Changing Climate: Geothermal Evidence from Permafrost in the Alaskan Arc-tic, Science, 234, 689–696, doi:10.1126/science.234.4777.689, 1986.
Lantz, T. C. and Kokelj, S. V.: Increasing rates of retrogressive thaw slump activity in the Mackenzie Delta region, N.W.T., Canada, Geophys. Res. Lett., 35, L06502, doi:10.1029/2007GL032433, 2008.
Lara, M. J., Genet, H., McGuire, A. D., Euskirchen, E. S., Zhang, Y., Brown, D. R. N., Jorgenson, M. T., Romanovsky, V., Breen, A., and Bolton, W. R.: Thermokarst rates intensify due to climate change and forest fragmentation in an Alaskan boreal forest low-land, Global Change Biol., 22, 816–829, doi:10.1111/gcb.13124, in press, 2016.
Lewkowicz, A. G., Etzelmüller, B., and Smith, S. L.: Characteristics of discontinuous permafrost based on ground temperature mea-surements and electrical resistivity tomography, southern Yukon, Canada, Permafrost Periglac. Process., 22, 320–342, 2011. Liljedahl, A. K., Boike, J., Daanen, R. P., Fedorov, A. N., Frost,
G. V., Grosse, G., Hinzman, L. D., Iijma, Y., Jorgenson, J. C., Matveyeva, N., Necsoiu, M., Raynolds, M. K., Romanovsky, V. E., Schulla, J., Tape, K., Walker, D. A., and Yabuki, H.: Pan-Arctic ice-wedge degradation in warming permafrost and its in-fluence on tundra hydrology, Nat. Geosci., 9, 312–318, 2016.
Lindgren, A., Hugelius, G., Kuhry, P., Christensen, T. R., and Vandenberghe, J.: GIS-based Maps and Area Estimates of Northern Hemisphere Permafrost Extent during the Last Glacial Maximum, Permafr. Periglac. Process., 27, 6–16, doi:10.1002/ppp.1851, 2016.
Lunardini, V. J.: Climatic warming and the degradation of warm permafrost, Permafrost Periglac. Process., 7, 311–320, 1996. Murton, J. B. and French, H. M.: Cryostructures in permafrost,
Tuk-toyaktuk coastlands, western Arctic Canada, Can. J. Earth Sci., 31, 737–747, 1994.
Neal, A.: Ground-penetrating radar and its use in sedimentology: principles, problems and progress, Earth-Sci. Rev., 66, 261–330, 2004.
Nelson, F. E., Anisimov, O. A., and Shiklomanov, N. I.: Sub-sidence risk from thawing permafrost, Nature, 410, 889–890, doi:10.1038/35073746, 2001.
O’Donnell, J. A., Harden, J. W., McGuire, A. D., Kanevskiy, M. Z., Jorgenson, M. T., and Xu, X.: The effect of fire and permafrost interactions on soil carbon accumulation in an up-land black spruce ecosystem of interior Alaska: implications for post-thaw carbon loss, Global Change Biol., 17, 1461–1474, doi:10.1111/j.1365-2486.2010.02358.x, 2011.
O’Donnell, J. A., Jorgenson, M. T., Harden, J. W., McGuire, A. D., Kanevskiy, M. Z., and Wickland, K. P.: The Effects of Permafrost Thaw on Soil Hydrologic, Thermal, and Carbon Dynamics in an Alaskan Peatland, Ecosystems, 15, 213–229, doi:10.1007/s10021-011-9504-0, 2012.
Osterkamp, T. E.: Characteristics of the recent warming of per-mafrost in Alaska, J. Geophys. Res.-Ea. Surf., 112, F02S02, doi:10.1029/2006JF000578, 2007.
Osterkamp, T. E., Viereck, L., Shur, Y., Jorgenson, M. T., Racine, C., Doyle, A., and Boone, R. D.: Observations of Thermokarst and Its Impact on Boreal Forests in Alaska, U.S.A., Arct. Antarct. Alp. Res., 32, 303–315, doi:10.2307/1552529, 2000.
Parsekian, A. D., Slater, L., Comas, X., and Glaser, P. H.: Vari-ations in free-phase gases in peat landforms determined by ground-penetrating radar, J. Geophys. Res.-Biogeo., 115, G2, doi:10.1029/2009JG001086, 2010.
Parsekian, A. D., Grosse, G., Walbrecker, J. O., Müller-Petke, M., Keating, K., Liu, L., Jones, B. M., and Knight, R.: Detecting un-frozen sediments below thermokarst lakes with surface nuclear magnetic resonance, Geophys. Res. Lett., 40, 535–540, 2013. Pastick, N. J., Jorgenson, M. T., Wylie, B. K., Nield, S. J., Johnson,
K. D., and Finley, A. O.: Distribution of near-surface permafrost in Alaska: Estimates of present and future conditions, Remote Sens. Environ., 168, 301–315, doi:10.1016/j.rse.2015.07.019, 2015.
Payette, S., Delwaide, A., Caccianiga, M., and Beauchemin, M.: Accelerated thawing of subarctic peatland permafrost over the last 50 years, Geophys. Res. Lett., 31, L18208, doi:10.1029/2004GL020358, 2004.
Plafker, G.: Tectonics of the March 27, 1964 Alaska earthquake: US Geological Survey Professional Paper, available at: http: //pubs.usgs.gov/pp/0543i/ (last access: 1 March 2016), 1969. Quinton, W. L., Hayashi, M., and Chasmer, L. E.: