Submitted20 April 2016 Accepted 27 September 2016 Published27 October 2016
Corresponding author Lauren L. Kordonowy, [email protected]
Academic editor Ana Pavasovic
Additional Information and Declarations can be found on page 17
DOI10.7717/peerj.2617
Copyright
2016 Kordonowy and MacManes
Distributed under
Creative Commons CC-BY 4.0
OPEN ACCESS
Characterization of a male reproductive
transcriptome for
Peromyscus eremicus
(Cactus mouse)
Lauren L. Kordonowy*and Matthew D. MacManes*
Department of Molecular, Cellular, and Biological Sciences, University of New Hampshire, Durham, NH, United States
*These authors contributed equally to this work.
ABSTRACT
Rodents of the genusPeromyscushave become increasingly utilized models for investi-gations into adaptive biology. This genus is particularly powerful for research linking genetics with adaptive physiology or behaviors, and recent research has capitalized on the unique opportunities afforded by the ecological diversity of these rodents. Well characterized genomic and transcriptomic data is intrinsic to explorations of the genetic architecture responsible for ecological adaptations. Therefore, this study characterizes the transcriptome of three male reproductive tissues (testes, epididymis and vas deferens) ofPeromyscus eremicus(Cactus mouse), a desert specialist. The transcriptome assembly process was optimized in order to produce a high quality and substantially complete annotated transcriptome. This composite transcriptome was generated to characterize the expressed transcripts in the male reproductive tract ofP. eremicus, which will serve as a crucial resource for future research investigating our hypothesis that the male Cactus mouse possesses an adaptive reproductive phenotype to mitigate water-loss from ejaculate. This study reports genes under positive selection in the male Cactus mouse reproductive transcriptome relative to transcriptomes fromPeromyscus maniculatus(deer mouse) andMus musculus.Thus, this study expands upon existing genetic research in this species, and we provide a high quality transcriptome to enable further explorations of our proposed hypothesis for male Cactus mouse reproductive adaptations to minimize seminal fluid loss.
SubjectsBioinformatics, Evolutionary Studies, Genetics, Genomics, Zoology
Keywords Peromyscus eremicus, Transcriptome, Genomics, Bioinformatics, Adaptation, Desert physiology, Cactus mouse, Reproduction
INTRODUCTION
species in extreme environments, the genetic underpinnings of these adaptations have only recently become a larger area of research (Hoekstra et al., 2006;Cheviron & Brumfield, 2011;Lorenzo et al., 2014;Guillen et al., 2015). High-throughput sequencing technology of model and non-model organisms (Ellegren, 2014) enables evolutionary biologists to conduct genome and transcriptome wide analyses and link patterns of gene selection with functional adaptations.
Studies on the genetic basis of adaptation have included a wide variety of taxa. For ex-ample, butterflies in theHeliconiusgenus have been a particularly effective study system for determining the genetic basis of pigmentation patterns, and there is evidence of interspecific introgression for genes enabling adaptive mimicry patterns (Hines et al., 2012;Heliconius Genome Consortium, 2012). In addition, a population genomic study in three-spine stickle-backs has elucidated many loci responsible for divergent adaptations from marine to fresh-water environments (Jones et al., 2012). Furthermore, researchers have developed a list of candidate genes that have evolved in multiple populations of freshwater adapted three-spine sticklebacks (Hohenlohe et al., 2010). Another active area of adaptation genetics research fo-cuses on species residing in extreme environments. High altitude adaptations to hemoglobin variants have been identified in multiple organisms, including humans (Lorenzo et al., 2014), several species of Andean ducks (McCracken et al., 2009a;McCracken et al., 2009b), and deer mice, Peromyscus maniculatus(Storz et al., 2010;Natarajan et al., 2015). The genetic pathways responsible for physiological adaptations to desert habitats remain enigmatic; however, considerable progress has been made developing candidate gene sets for future analyses (e.g.,Guillen et al., 2015;MacManes & Eisen, 2014;Marra et al., 2012;
Marra, Romero & DeWoody, 2014). Functional studies will stem from this foundational research aimed at identifying the genomic underpinnings of adaptations to extreme environments; yet, it is inherently challenging and critically important to demonstrate that specific loci are functionally responsible for adaptations (Storz & Wheat, 2010).
Rodents of the genusPeromyscushave been at the forefront of research elucidating the genetic basis for adaptation (reviewed inBedford & Hoekstra, 2015). This diverse genus has served as an ideal platform for adaptation research spanning from the genetic basis of behavioral adaptations—such as complex burrowing in Peromyscus polionotus(Weber & Hoekstra, 2009;Weber, Peterson & Hoekstra, 2013)—to the loci responsible for adaptive morphology—such as coat coloration inPeromyscus polionotus leucocephalus(Hoekstra et al., 2006), and including kidney desert adaptations inPeromyscus eremicus(MacManes & Eisen, 2014). We are currently usingPeromyscus eremicusas a model species for investigating the genetic bases of desert adaptations. This paper describes a crucial component of this research aim.
underlying adaptive renal physiology. However, to our knowledge, potential physiological reproductive adaptations to water limitation have not been studied in this species or in other desert rodents. We hypothesize that maleP. eremicuspossess reproductive adaptions to mitigate water loss.
The adaptive kidney physiology in kangaroo rat species (genus:Dipodomys), which produce highly concentrated urine via a disproportionately long loop of Henle ( Schmidt-Nielsen et al., 1948;Schmidt-Nielsen & Schmidt-Nielsen, 1952;Vimtrup & Schmidt-Nielsen, 1952;Urity et al., 2012), has been well-established. We propose that there may also be repro-ductive adaptations to mitigate water loss in desert rodents. Recent findings pertaining to the genetic signatures of adaptive kidney function in desert rodents (Marra et al., 2012;Marra, Romero & DeWoody, 2014; MacManes & Eisen, 2014), suggest that such hypothesized reproductive adaptations may be detectable at the genetic level (should they exist) using sim-ilar comparative transcriptomic methods. We present this hypothesis in light of the mount-ing body of research for high rates of reproductive protein evolution (reviewed inSwanson & Vacquier, 2002;Ramm et al., 2014), which we propose indicates that reproductive tissues may possess a significant capacity for evolving in response to strong selective pressures.
Dewsbury (1982)made the assertion that producing ejaculates incurs a cost for male mammals, which produce relatively high sperm counts, and his analysis utilizes P. maniculatusas a model. Ejaculation has also been demonstrated to be costly inMus musculus domesticus;Ramm & Stockley (2007)found that mice are able to manipulate the quantity of sperm released in response to varying competition for females.Peromyscusand other rodents exhibit rapid evolution of testis-expressed proteins (Turner, Chuong & Hoekstra, 2008). In addition, the epididymal transcriptome ofM. musculusshows evidence for positive selection among epididymis-specialized genes that are secreted, which the authors attribute to their putative evolutionary importance (Dean, Good & Nachman, 2008). Moreover, a recent analysis for sperm genes from multiple mouse strains found that sperm proteins involved in both motility and in sperm-egg interactions show signatures of positive selec-tion, potentially facilitating evolutionary mechanisms for sperm-competition and sexual conflict (Vicens, Luke & Roldan, 2014). We therefore propose that both the inherently costly nature of producing ejaculate and the rapid evolution of genes in murine testes, epididymis, and sperm would be ideal for desert rodents to evolve ejaculate adaptations to limited water-availability.
for research studies exploring this hypothesized male P. eremicus reproductive desert adaptation. For example, this transcriptome will be instrumental in further experimental studies investigating differential gene expression in these tissue types in response to variable hydration levels or in large-scale comparative transcriptomic studies spanning numerous desert and non-desert rodents.
Here, we characterize a male Cactus mouse tissue-specific transcriptome by presenting a preliminary exploration of transcript abundance and putative homology. We also perform comparative transcriptomic analyses to identify evidence of positive selection in genes potentially related to the hypothesized reproductive desert adaptations. It is beyond the scope of this manuscript to evaluate the functionality of these candidate genes in the context of desert adaptation, much less male specific reproductive adaptations. However, the elucidation of candidate genes in the context of male reproductive tissues will be instru-mental for future studies aimed at determining which genes are functionally responsible for the proposed reproductive adaptations to water limitation in male Cactus mouse.
METHODS
Tissue samples, RNA extraction, cDNA library preparation and sequencing
ThePeromyscus eremicusmale used for this study was captive born and descendant from a population from thePeromyscusGenetic Stock Center (Columbia, South Carolina). This individual was housed in a facility at the University of New Hampshire designed to mimic desert conditions in the Southwestern United States. Specifically, the temperature increases gradually during the light hours until it peaks at 90◦
Fahrenheit in the afternoon, and the temperature decreases during hours of darkness to 75◦
. Humidity levels are 10% during the daylight hours and 25% during darkness. The photoperiodic cycle in this desert chamber is for long days of photo-stimulation, with 16 h of light, and 8 h of darkness. The colony includes males and females which are housed within a single room, providing olfactory cues that stimulate reproductive maturity. The photoperiod and shared housing in this colony result in the attainment of reproductive maturity in both sexes. Males are deemed reproductively mature when they are fully scrotal. The males do not undergo seasonal testicular atrophy, as evidenced by their consistent scrotal condition and their year-round successful reproduction.
A single reproductively matureP. eremicusmale was sacrificed via isoflurane overdose and decapitation. This was done in accordance with University of New Hampshire Animal Care and Use Committee guidelines (protocol number 130902) and guidelines established by the American Society of Mammalogists (Sikes et al., 2011). Testes, epididymis, and vas deferens were immediately harvested (within ten minutes of euthanasia), placed in RNAlater (Ambion Life Technologies) and stored at−80 ◦C until RNA extraction. We
LS Kit (Illumina). Each of the three samples was labeled with a unique hexamer adapter for identification after multiplex single lane sequencing. Following library completion, we confirmed the quality and quantity of the DNA product with the Qubit and Tapestation. We submitted the multiplexed sample of the libraries for running on a single lane at the New York Genome Center Sequencing Facility (NY, New York). Paired end sequencing reads of length 125 bp were generated on an Illumina 2500 platform. Reads were parsed by tissue type according to their unique hexamer IDs in preparation for transcriptome assembly.
Reproductive transcriptome assembly
The composite reproductive transcriptome was assembled with reads from the testes, epididymis and vas deferens using the previously developed Oyster River Protocol for de novotranscriptome assembly pipeline (MacManes, 2016). Briefly, the reads were error corrected with Rcorrector v1.0.1 (Song & Florea, 2015). We used thede novotranscriptome assembler Trinity v2.1.1 (Haas et al., 2013; Grabherr et al., 2011). Within the Trinity platform, we ran Trimmomatic (Bolger, Lohse & Usadel, 2014) to remove the adapters, and we also trimmed at PHRED<2, as recommended byMacManes (2014).
Next we evaluated transcriptome assembly quality and completeness using BUSCO v1.1b1 and Transrate v1.0.1. BUSCO (Simão et al., 2015) reports the number of complete, fragmented, and missing orthologs in assembled genomes, transcriptomes, or gene sets relative to compiled ortholog databases. We ran BUSCO on the assembly using the ortholog database for vertebrates, which includes 3,023 genes. The assembly was also analyzed by Transrate using theMus musculuspeptide database from Ensembl (downloaded 2/24/16) as a reference. The Transrate score provided a metric ofde novotranscriptome assembly quality, and the software also generated an improved assembly comprised of highly supported contigs (Smith-Unna et al., 2016). Finally, we re-ran BUSCO on the improved assembly generated by Transrate to determine if this assembly had similar metric scores for completeness as the original assembly produced by Trinity. As alternatives to the original Trinity assembly and the optimized Transrate assembly, we proceeded with our optimization determinations by filtering out low abundance contigs from the original Trinity assembly. First we calculated the relative abundance of the transcripts with Kallisto v0.42.4 and Salmon v0.5.1. Kallisto utilizes a pseudo-alignment algorithm to map RNA-seq data reads to targets for transcript abundance quantification (Bray et al., 2015). In contrast, Salmon employs a lightweight quasi-alignment method and a high speed streaming algorithm to quantify transcripts (Patro, Duggal & Kingsford, 2015). After determining transcript abundance in both Kallisto and Salmon, we removed contigs with transcripts per million (TPM) estimates of less than 0.5 and of less than 1.0 in two separate optimization trials (as perMacManes, 2016). Finally, we evaluated these two filtered assemblies with Transrate and BUSCO to determine the relative quality and completeness of both assemblies. We chose the optimal assembly version by comparing Transrate and BUSCO metrics and also through careful consideration of total contig numbers across all filtering and optimizing versions. The chosen assembly was the Transrate optimized TPM
Annotation, transcript abundance, and database searches
We used dammit v0.2.7.1 (Scott, 2016) to annotate the optimized transcriptome assembly (as per MacManes, 2016). Within the dammit platform, we predicted protein coding regions for each tissue with TransDecoder v2.0.1 (Haas et al., 2013), which was used to find open reading frames (ORFs). Furthermore, dammit utilizes multiple database searches for annotating transcriptomes. These database searches include searches in Rfam v12.0 to find non-coding RNAs (Nawrocki et al., 2015), searches for protein domains in Pfam-A v29.0 (Sonnhammer, Eddy & Durbin, 1997;Finn et al., 2016), the execution of a LAST search for known proteins in the UniRef90 database (Suzek et al., 2007;Suzek et al., 2015), ortholog matches in the BUSCO database, and orthology searches in OrthoDB (Kriventseva et al., 2015).
We used the assembly annotated by dammit to re-run Kallisto to determine transcript abundance within each of the three tissue types. We used TPM counts of expression for all three tissues to generate counts of transcripts specific to and shared across tissue types. We also downloaded the ncRNA database forMus musculusfrom Ensembl (v 2/25/16), and we did a BLASTn (Altschul et al., 1990;Madden, 2002) search for these ncRNAs in our assembly. This database has 16,274 sequences, and we determined the number of transcript ID matches and the number of unique ncRNA sequence matches for our assembly. We also counted how many transcript matches were present in each of the tissues, and we referenced the corresponding Kallisto derived TPM values to determine the number of unique and ubiquitous transcript matches for each tissue.
We searched the annotated assembly for transporter protein matches within the Transporter Classification Database (tcdb.org). This database has 13,846 sequences representing proteins in transmembrane molecular transport systems (Saier et al., 2014). We executed a BLASTx (Altschul et al., 1990;Madden, 2002) search to find the number of transcript ID matches and the number of unique transporter protein matches within the assembly. Next we determined how many transcript ID matches were found in each of the three tissues. As previously described above, we also cross-referenced these matches with the Kallisto derived TPM values to find the number of ubiquitous and unique transcript matches by tissue type.
Comparative analysis for genes under positive selection
based on sequence similarity. Our next script selected the single copy orthologs (SCOs) from among these orthogroups for analysis. Then we selected the cds file transcripts for all three species corresponding to the previously identified single copy orthologs. Finally, we ran a script which aligned the sequences with PRANK v150803 (Löytynoja, 2014) and performed the analyses for positive selection for the single copy orthologous sequences with codeml in PAML v4.8 (Yang, 1997;Yang, 2007). Specifically, we performed theM2abranch site test (Zhang, Nielsen & Yang, 2005) for positive selection after stipulatingP. eremicusas the foreground lineage. Genes were deemed under positive selection if the omega values (w) exceeded 1 within theM2amodel and if they yielded statistically significant results for the likelihood ratio test (LRT) comparison between the null and alternative models. To perform the LRT, we determined if 21lnL (two times the difference between the log likelihood values for the alternative—M2a—and the null—M1a—models) exceeded a chi-square value corresponding to a significantp-value (p<0.05) (Yang, 1998) after applying the Benjamini-Hochburg correction for multiple comparisons (Benjamini & Hochberg, 1995). For each of theP. eremicusgene sequences demonstrated to be under positive selection according to the LRT, we selected theM. musculuscds sequence from the SCO group corresponding to theP. eremicusgene sequence. Then we performed a BLASTn search on theM. musculussequence to find gene matches on NCBI to determine the gene identity for theP. eremicussequence under positive selection.
Of note, the code for performing all of the above analyses can be found at GitHub (https://github.com/macmanes-lab/peer_reproductive/transcriptome). The data files are available on Dryad (doi:10.5061/dryad.01c3t).
RESULTS AND DISCUSSION
Reproductive transcriptome assembly
There were 45–94 million paired reads produced for each of the three transcriptome datasets, yielding a total of 415,960,428 reads. The raw reads are available at the European Nucleotide Archive under study accession numberPRJEB13364.
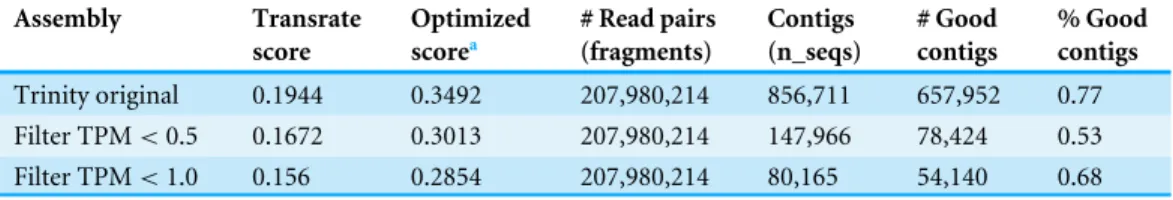
Table 1 Transrate results for the reproductive transcriptome assembly produced by different opti-mization methods.
Assembly Transrate score
Optimized scorea
# Read pairs (fragments)
Contigs (n_seqs)
# Good contigs
% Good contigs
Trinity original 0.1944 0.3492 207,980,214 856,711 657,952 0.77 Filter TPM<0.5 0.1672 0.3013 207,980,214 147,966 78,424 0.53 Filter TPM<1.0 0.156 0.2854 207,980,214 80,165 54,140 0.68
Notes.
aThis is the score of the Transrate optimized assembly inTable 2.
Table 2 BUSCO metrics for the reproductive transcriptome assembly produced by different optimiza-tion methods.
Assembly % Complete % Duplicated % Fragmented % Missing
Trinity original 90 49 3.4 5.5
Transrate optimized 85 44 4.3 9.7
Filter TPM<0.5 85 38 3.0 11
Transrate TPM<0.5 73 31 3.9 22
Filter TPM<1.0 80 28 2.8 16
Transrate TPM<1.0 74 25 3.4 21
Specifically, the optimized Transrate score was 0.3492, and the percent coverage of the reference assembly was also highest, with 45% of the mouse database represented. This assembly was highly competitive for completeness, as indicated by the fact that it contained 85% of vertebrate single copy orthologs. However, this assembly had an exorbitantly high number of contigs (657,952 contigs), which is nearly an order of magnitude more contigs than the next best performing assembly: the Transrate optimized TPM >0.5 filtered assembly (78,424 contigs). In consideration of the dramatically more realistic contig number for the Transrate optimized TPM>0.5 filtered assembly, and in light of its second best performance for Transrate score (0.3013), reasonable Transrate mouse reference assembly coverage (37%), and sufficiently high BUSCO completeness (73% orthologs found), we chose this assembly as our optimized transcriptome. Therefore, we proceeded with this optimized assembly version as our finalized transcriptome assembly for our analyses.
Annotation, transcript abundance and database searches
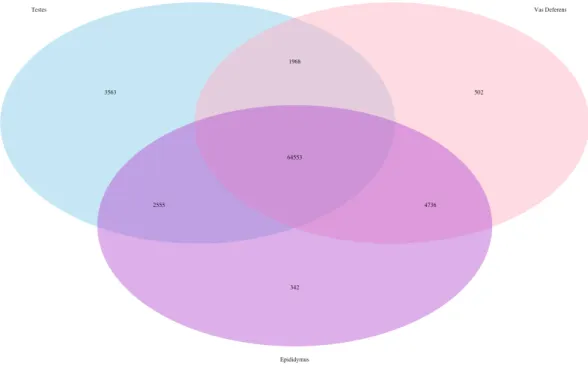
Figure 1 Venn Diagram of transcript expression differences and similarities between the three repro-ductive tissues for a single male mouse.The total number of transcripts is 78,424.
Rfam database for ncRNAs, and these results are posted in Dryad. Of note, 80.1% (62,835) of the transcripts were annotated using one or more of the above described methods (the dammit.gff3 file is posted in Dryad), and it is this final annotated assembly that was used for all subsequent analyses (this annotated transcriptome is available on Dryad).
The Kallisto generated TPM counts of expression (available on Dryad) were utilized to determine which transcripts were ubiquitous and specific to the three tissue types, which we have depicted in a Venn diagram format (Fig. 1). The assembly consisted of 78,424 different transcript IDs, of which 64,553 were shared across all three tissues. The number of unique transcripts were as follows: 3,563 in testes, 342 in epididymis, and 502 in vas deferens. The relatively large number of unique transcripts in the testes is consistent with previous findings which describe the testes as the tissue with the highest number of tissue-enriched genes in the human body (Djureinovic et al., 2014;Uhlén et al., 2015). However, because this expression data was generated by a single individual, we want to emphasize that these results have no statistical power. Rather, we view these numerical comparisons of unique and ubiquitous transcript counts as an exploratory evaluation of potential relationships between tissue types. Such comparisons across tissue types for a single individual of this species previously indicated that the kidney had relatively higher numbers of unique transcripts than testes (MacManes & Eisen, 2014). Future research with multiple individuals will be necessary to statistically evaluate the relative rates of transcript expression between these reproductive tissues, as well as their relationship with other non-reproductive tissue types.
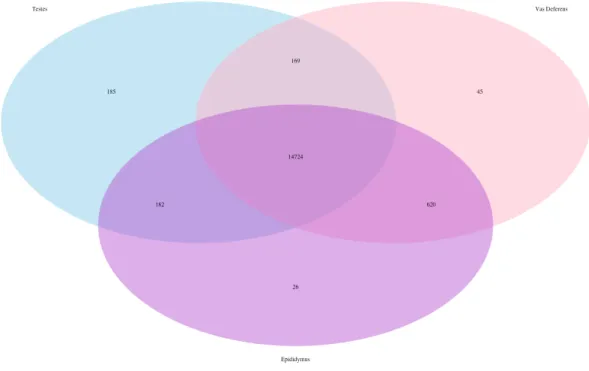
Figure 2 Venn Diagram of transcript matches between the three reproductive tissues to ncRNA se-quences inMus musculus. The total number of transcript matches across the tissue types is 15,964.
ncRNA matches, and they are posted on Dryad. The transcript matches by tissue type were found using the Kallisto TPM determinations, and they were as follows, testes: 15,260, epididymis: 15,552, and vas deferens: 15,558. A Venn Diagram depicts unique and shared transcript matches by tissue type (Fig. 2). The majority of transcript matches were ubiquitous to all three tissues (14,724), and there were far fewer tissue specific matches. The testes had more unique transcript matches (185) than the epididymis (26) or the vas deferens (45). These findings are consistent with our results above regarding the relative numbers of total unique transcripts in the assembly by tissue type. However, these counts for relative transcript matches among tissue types were generated with transcripts from a single individual; therefore, the comparative results across tissue type were not statistically evaluated. It is seemingly probable that the diversity of transcripts for regulation should be highest in tissues generating relatively diverse proteins, in this case, the testes, which did have the highest number of unique transcript matches. The role of ncRNA in reproductive tissues throughout multiple developmental stages has recently been reviewed in detail (Hale, Yang & Ross, 2014). In addition, ncRNAs have been found to be highly abundant in murine testes (Sun, Lin & Wu, 2013). Furthermore, sperm from humans and mice contain a significant number of ncRNAs (Krawetz et al., 2011;Kowano et al., 2012). However, we are unaware of any research investigating the involvement of ncRNA in desert adaptations; therefore, we cannot speculate on particular ncRNA matches within our dataset that may have potential desert adaptive roles.
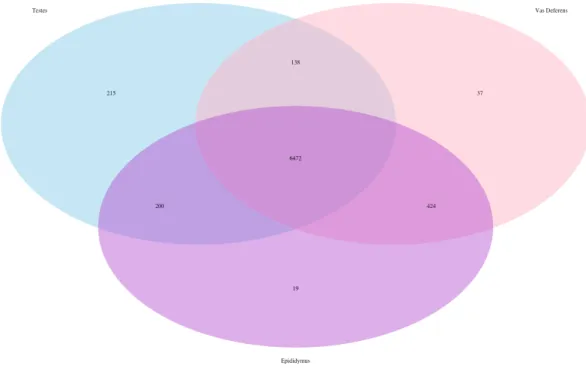
Figure 3 Venn Diagram of transcript matches between the three reproductive tissues to protein se-quences in the Transporter Classification Database. The total number of transcript matches across the tissue types is 7,521.
matches was highly similar between the tissue types (testes 7,025; epididymis 7,115; vas deferens: 7,071). We generated a Venn Diagram to display the numbers of shared and unique transcript matches to the transporter protein sequences (Fig. 3). Most transcript matches were present in all three tissues (6,472), and there were relatively few unique matches in the three tissue types. However, the testes had the highest number of unique transcript matches (215) relative to the epididymis (19) and the vas deferens (37). These comparative results across tissue types represent exploratory findings for a single mouse, and the count data have not been statistically tested, but these preliminary results should be investigated in future studies. Furthermore, our BLASTx search of this transporter protein database yielded transcript matches for multiple solute carrier proteins. We are particularly interested in solute carrier proteins because previous research has found candidate genes in this protein family for desert adaptations in kidneys of the kangaroo rat (Marra et al., 2012;Marra, Romero & DeWoody, 2014) and the Cactus mouse (MacManes & Eisen, 2014). In addition, we had multiple matches to aquaporins, which are water channels allowing transport across cellular membranes. One transcript matched specifically to Aquaporin 3, a sperm water channel found in mice and humans, which is essential to maintaining sperm cellular integrity in response to the hypotonic environment within the female reproductive tract (Chen et al., 2011).
Comparative analysis for genes under positive selection
M. musculusas the non-desert adapted outgroup because this species possesses transcrip-tomic resources which are exceptional in their annotation and completeness. The widely dis-tributed (Carleton, 1989) habitat generalist deer mouse,P. maniculatus,was chosen because it harbors the most complete transcriptomic data available among thePeromyscusgenus.
There were 3,731 panorthologous groups (single copy orthologs) in our three species comparison. The branch test was successfully implemented for SCOs when all three sequences aligned adequately with PRANK and when codeml produced bothM1aand M2aoutput files for the LRT comparison (n=2,820 in total). TheM2atest indicated that 42 genes were evolving under a model of positive selection in the Cactus mouse (Table 3). Therefore, we investigated whether previous research on either rodent reproductive tissues or on desert specialized rodents documented evidence of positive selection for any of these genes or gene families. Only one of these 42 genes matched an epididymis-specialized secreted gene undergoing positive selection in another rodent (C57/BL6 mice). Namely, Qsox2 is a match for Qscn6l1, a member of the sulfhydryl oxidase/quiescin-6 family, which is purportedly involved in neuroblastoma apoptosis (Dean, Good & Nachman, 2008). However, we cannot speculate regarding the functionality this gene has in male rodent reproductive tissue, or why it appears to be evolving under a model of positive selection in these two studies. Another of our 42 positively selected genes, Lrrc46, may have some similarity to Lrrc50, a gene under positive section in testes ofPeromyscus(Turner, Chuong & Hoekstra, 2008). Leucine-rich repeat containing (Lrrc) genes have diverse biological roles; therefore, we also will not speculate on any correspondence between these two genes. As expected given our experimental design, there was no concordance between our 42 genes and those found to be under positive selection in a recent study on mouse spermatozoa proteins (Vicens, Luke & Roldan, 2014).
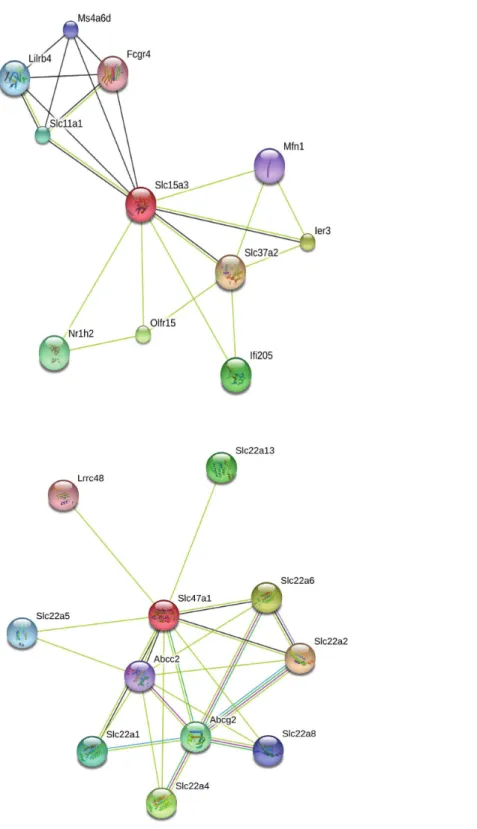
Our search for gene matches from the current study with other desert rodent research revealed notable similarities. Two solute carrier proteins, Slc15a3 and Slc47a1, were found to be under positive selection in our analysis. This finding bears particular significance because another protein in this family, Slc2a9, shows signatures of positive selection in desert rodent kidney transcriptomes in Dipodomys spectabilisandChaetodipus baileyi(Marra, Romero & DeWoody, 2014) andP. eremicus(MacManes & Eisen, 2014). Solute carriers are a large family of cell membrane proteins that are responsible for transporting solutes (reviewed in
Hediger et al., 2004;Hediger et al., 2013;César-Razquin et al., 2015). Furthermore,Marra, Romero & DeWoody (2014), hypothesize that solute carriers are critical for osmoregulation in desert rodents, and they assert that these genes may be under evolutionary pressure in such rodents. In response to the potential relevance of the two solute carriers under positive selection in our study to desert rodent osmoregulation, we generated STRING (Snel et al., 2000;Szklarczyk et al., 2015) diagrams for their protein-protein interactions (Fig. 4). These diagrams demonstrate multiple connections to other solute carriers for both proteins, thereby suggesting their potential functional roles.
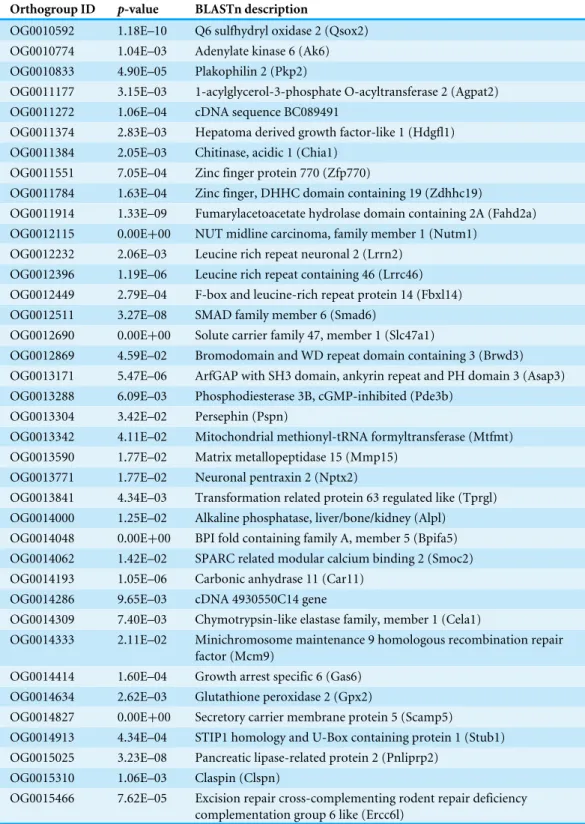
Table 3 The 42 genes that reached statistical significance (p<0.05) after correcting for multiple
hy-pothesis testing for theM2abranch-site test for positive selection in PAML in the male Cactus mouse reproductive transcriptome.
Orthogroup ID p-value BLASTn description
OG0010592 1.18E–10 Q6 sulfhydryl oxidase 2 (Qsox2) OG0010774 1.04E–03 Adenylate kinase 6 (Ak6) OG0010833 4.90E–05 Plakophilin 2 (Pkp2)
OG0011177 3.15E–03 1-acylglycerol-3-phosphate O-acyltransferase 2 (Agpat2) OG0011272 1.06E–04 cDNA sequence BC089491
OG0011374 2.83E–03 Hepatoma derived growth factor-like 1 (Hdgfl1) OG0011384 2.05E–03 Chitinase, acidic 1 (Chia1)
OG0011551 7.05E–04 Zinc finger protein 770 (Zfp770)
OG0011784 1.63E–04 Zinc finger, DHHC domain containing 19 (Zdhhc19)
OG0011914 1.33E–09 Fumarylacetoacetate hydrolase domain containing 2A (Fahd2a) OG0012115 0.00E+00 NUT midline carcinoma, family member 1 (Nutm1)
OG0012232 2.06E–03 Leucine rich repeat neuronal 2 (Lrrn2) OG0012396 1.19E–06 Leucine rich repeat containing 46 (Lrrc46) OG0012449 2.79E–04 F-box and leucine-rich repeat protein 14 (Fbxl14) OG0012511 3.27E–08 SMAD family member 6 (Smad6)
OG0012690 0.00E+00 Solute carrier family 47, member 1 (Slc47a1)
OG0012869 4.59E–02 Bromodomain and WD repeat domain containing 3 (Brwd3) OG0013171 5.47E–06 ArfGAP with SH3 domain, ankyrin repeat and PH domain 3 (Asap3) OG0013288 6.09E–03 Phosphodiesterase 3B, cGMP-inhibited (Pde3b)
OG0013304 3.42E–02 Persephin (Pspn)
OG0013342 4.11E–02 Mitochondrial methionyl-tRNA formyltransferase (Mtfmt) OG0013590 1.77E–02 Matrix metallopeptidase 15 (Mmp15)
OG0013771 1.77E–02 Neuronal pentraxin 2 (Nptx2)
OG0013841 4.34E–03 Transformation related protein 63 regulated like (Tprgl) OG0014000 1.25E–02 Alkaline phosphatase, liver/bone/kidney (Alpl)
OG0014048 0.00E+00 BPI fold containing family A, member 5 (Bpifa5) OG0014062 1.42E–02 SPARC related modular calcium binding 2 (Smoc2) OG0014193 1.05E–06 Carbonic anhydrase 11 (Car11)
OG0014286 9.65E–03 cDNA 4930550C14 gene
OG0014309 7.40E–03 Chymotrypsin-like elastase family, member 1 (Cela1)
OG0014333 2.11E–02 Minichromosome maintenance 9 homologous recombination repair factor (Mcm9)
OG0014414 1.60E–04 Growth arrest specific 6 (Gas6) OG0014634 2.62E–03 Glutathione peroxidase 2 (Gpx2)
OG0014827 0.00E+00 Secretory carrier membrane protein 5 (Scamp5)
OG0014913 4.34E–04 STIP1 homology and U-Box containing protein 1 (Stub1) OG0015025 3.23E–08 Pancreatic lipase-related protein 2 (Pnliprp2)
OG0015310 1.06E–03 Claspin (Clspn)
OG0015466 7.62E–05 Excision repair cross-complementing rodent repair deficiency complementation group 6 like (Ercc6l)
Table 3(continued)
Orthogroup ID p-value BLASTn description
OG0015627 4.18E–03 Solute carrier family 15, member 3 (Slc15a3) OG0015662 1.52E–03 Epithelial membrane protein 2 (Emp2)
OG0015704 3.96E–03 Cubilin (intrinsic factor-cobalamin receptor) (Cubn) OG0015713 4.97E–07 Suppressor APC domain containing 1 (Sapcd1)
However, desert specialization is not the sole difference betweenP. eremicusandP. manicu-latus, much less betweenP. eremicusandM. musculus.P. maniculatusis highly promiscuous, whileP. eremicusis relatively socially monogamous (Wolff, 1989). Indeed,P. maniculatus has been the subject of considerable sperm competition research (Dewsbury, 1988;Fisher & Hoekstra, 2010). Differences in reproductive systems, and even potentially in sperm aggregation of P. maniculatus (Fisher & Hoekstra, 2010), may manifest themselves as evidence of selection patterns between these two Peromyscusspecies. Therefore, we are not proposing that the 42 genes we found to be under positive selection in the male Cactus mouse are functionally responsible for adaptive desert physiology. Rather, we are proposing that they are interesting candidate genes for future studies investigating the genetic underpinnings of physiological desert adaptations, including our hypothesized male reproductive adaptation, on a functional level. Several of these genes, specifically those in the solute carrier family, seem particularly promising for such work because they are undergoing rapid evolution in multiple desert rodent species.
CONCLUSIONS
preliminary (based on a single individual) transcript differences between tissue types. Furthermore, we find genes evolving under a model of positive selection in theP. eremicus male reproductive transcriptome relative to P. maniculatusandM. musculusin order to generate a list of candidate genes for future investigations in desert adaption genetics. Our future research will investigate the hypothesized male reproductive physiological adaptation to water limitation in Cactus mouse through a differential gene expression study, and the characterization of this reproductive transcriptome will form the foundation of studies along this vein. Moreover, this research contributes transcriptomic materials to a larger body of work in the expanding field of adaptation genetics, which benefits tremendously from enhanced opportunities for comparative analyses.
DRYAD DATA FILE LIST
Final Annotated Reproductive Tissue Transcriptome:reproductive.annotated.fasta (127 MB)
Transdecoder (Five Files): transdecoder.gff3(49 MB) transdecoder.pep(27 MB) transdecoder.cds(62 MB) transdecoder.mRNA(172 MB) transdecoder.bed (10 MB)
Pfam Annotation:reproductive.pfam.gff3(32 MB) Rfam Annotation:reproductive.rfam.gff3(191 KB) Dammit Annotation:reproductive.dammit.gff3(98 MB) UniRef90 Annotation:reproductive.uniref.gff3(9.5 MB) Kallisto Results for Annotated Transcriptome (Three Files):
kallisto.testes.tsv (3.4 MB) kallisto.epi.tsv(3.4 MB) kallisto.vas.tsv (3.4 MB)
ncRNA Database Matches (three files): epi.tpm.plus.ncRNA.txt (4.3 MB) vas.tpm.plus.ncRNA.txt (4.3 MB) testes.tpm.plus.ncRNA.txt (4.3 MB) tcdb Datatbase Matches (three files):
epi.tpm.plus.tcdb.txt (946 KB) vas.tpm.plus.tcdb.txt (946 KB) testes.tpm.plus.tcdb.txt (946 KB)
Comparative analysis for genes under positive selection (three files): PAMLresults.txt (354 KB)
ADDITIONAL INFORMATION AND DECLARATIONS
Funding
The work was funded by startup funds from the University of New Hampshire. The funders had no role in study design, data collection and analysis, decision to publish, or preparation of the manuscript.
Grant Disclosures
The following grant information was disclosed by the authors: University of New Hampshire.
Competing Interests
The authors declare there are no competing interests.
Author Contributions
• Lauren L. Kordonowy conceived and designed the experiments, performed the
experiments, analyzed the data, wrote the paper, prepared figures and/or tables, reviewed drafts of the paper.
• Matthew D. MacManes conceived and designed the experiments, performed the
experiments, analyzed the data, contributed reagents/materials/analysis tools, wrote the paper, reviewed drafts of the paper.
Animal Ethics
The following information was supplied relating to ethical approvals (i.e., approving body and any reference numbers):
University of New Hampshire Animal Care and Use Committee: (protocol number 130902).
DNA Deposition
The following information was supplied regarding the deposition of DNA sequences: European Nucleotide Archive (PRJEB13364, ID:318672).
Data Availability
The following information was supplied regarding data availability: Dryad DOI:10.5061/dryad.01c3t; Github:
https://github.com/macmanes-lab/peer_reproductive-transcriptome.
REFERENCES
Altschul SF, Gish W, Miller W, Myers EW, Lipman DJ. 1990.Basic local alignment
search tool.Journal of Molecular Biology215(3):403–410
DOI 10.1016/S0022-2836(05)80360-2.
Bedford NL, Hoekstra HE. 2015.The natural history of model organisms:Peromyscus
mice as a model for studying natural variation.eLife4:e06813
Benjamini Y, Hochberg Y. 1995.Controlling the false discovery rate: a practical and powerful approach to multiple testing.Journal of the Royal Statistical Society: Series B (Methodological)57(1):289–300.
Bolger AM, Lohse M, Usadel B. 2014.Trimmomatic: a flexiable trimmer for illumina
se-quence data.Bioinformatics30(15):2114–2120DOI 10.1093/bioninformatics/btu170.
Bray N, Pimentel H, Melsted P, Pachter L. 2015.Near-optimal RNA-seq quantification.
ArXiv preprint.arXiv:1505.02710.
Carleton M. 1989. Systematics and evolution. In: Kirkland Jr LG, Layne JN, eds.
Advances in the study of Peromyscus (Rodentia). Lubbock: Texas Tech University Press, 7–142.
César-Razquin A, Snijder B, Frappier-Brinton T, Isserlin R, Gyimesi G, Bai X,
Reith-meier RA, Hepworth D, Hediger MA, Edwards AM, Superti-Furga G. 2015.A call
for systematic research on solute carriers.Cell162(3):478–487
DOI 10.1016/j.cell.2015.07.022.
Chen Q, Peng H, Lei L, Zhang Y, Kuang H, Cao Y, Shi Q, Ma T, Duan T. 2011.
Aqua-porin 3 is a sperm water channel essential for postcopulatory sperm osmoadaptation and migration.Cell Research21(6):922–933DOI 10.1038/cr.2010.169.
Cheviron ZA, Brumfield RT. 2011.Genomic insights into adaptation to high-altitude
environments.Heredity108(4):354–361DOI 10.1038/hdy.2011.85.
Dean MD, Good JM, Nachman MW. 2008.Adaptive evolution of proteins secreted
during sperm maturation: an analysis of the mouse epididymal transcriptome. Molecular Biology and Evolution25(2):383–392DOI 10.1093/molbev/msm265.
Dewsbury DA. 1982.Ejaculate cost and male choice.The American Naturalist
119(5):601–610.
Dewsbury DA. 1988.A test of the role of copulatory plugs in sperm competition
in deer mice (Peromyscus maniculatus).Journal of Mammalogy69(4):854–857
DOI 10.2307/1381648.
Djureinovic D, Fagerberg L, Hallstrom B, Danielsson A, Lindskog C, Uhlen M,
Ponten F. 2014.The human testes-specific proteome defined by transcriptomics
and antibody-based profiling.Molecular Human Reproduction20(6):476–488
DOI 10.1093/molehr/gau018.
Ellegren H. 2014.Genome sequencing and population genomics in non-model
organ-isms.Trends in Ecology and Evolution29(1):1–13DOI 10.1016/j.tree.2013.09.008.
Emms DM, Kelly S. 2015.OrthoFinder: solving fundamental biases in whole genome
comparisons dramatically improves orthogroup inference accuracy.Genome Biology
16:157 DOI 10.1186/s13059-015-0721-2.
Finn RD, Coggill P, Eberhardt RY, Eddy SR, Mistry J, Mitchell AL, Potter SC, Punta M,
Qureshi M, Sangrador-Vegas A, Salazar GA, Tate J, Bateman A. 2016.The Pfam
protein families database: towards a more sustainable future.Nucleic Acids Research
44:D279–D285DOI 10.1093/nar/gkv1344.
Fisher HS, Hoekstra HE. 2010.Competition drives cooperation among closely related
Grabherr MG, Haas BJ, Yassour M, Levin JZ, Thompson DA, Amit I, Adiconis X, Fan L, Raychowdhury R, Zeng Q, Chen Z, Mauceli E, Hacohen N, Gnirke A, Rhind N, Di Palma F, Birren BW, Nusbaum C, Lindbald-Toh K, Friedman N, Regev A. 2011.
Full-length transcriptome assembly from RNA-Seq data without a reference genome. Nature Biotechnology29:644–652DOI 10.1038/nbt.1883.
Guillen Y, Rius N, Delprat A, Williford A, Muyas F, Puig M, Casillas S, Ramia M, Egea R, Negre B, Mir G, Camps J, Moncunill V, Ruiz-Ruano FJ, Cabrero J, De Lima LG, Dias GB, Ruiz JC, Kapusta A, Garcia-Mas J, Gut M, Gut IG, Torrents D, Camacho JP, Kuhn GCS, Feschotte C, Clark AG, Betran E, Barbadilla A, Ruiz A. 2015.
Genomics of ecological adaptation in cactophilic drosophila.Genome Biology and Evolution7(1):349–366DOI 10.1093/gbe/evu291.
Haas BJ, Papanicolaou A, Yassour M, Grabherr M, Blood PD, Bowden J, Couger MB, Eccles D, Li B, Lieber M, Macmanes MD, Ott M, Orvis J, Pochet N, Strozzi F, Weeks N, Westerman R, William T, Dewey CN, Henschel R, Leduc RD, Friedman
N, Regev A. 2013.De novotranscript sequence reconstruction from RNA-Seq:
reference generation and analysis with Trinity.Nature Protocols8(8):1494–1512
DOI 10.1038/nprot.2013.084.
Hale BJ, Yang CX, Ross JW. 2014.Small RNA regulation of reproductive function.
Molecular Reproduction and Development 81(2):148–159 DOI 10.1002/mrd.22272.
Hediger MA, Clemencon B, Burrier RE, Bruford EA. 2013.The ABCs of membrane
transporters in health and disease (SLC series): introduction.Molecular Aspects of Medicine34(2–3):95–107DOI 10.1016/j.mam.2012.12.009.
Hediger MA, Romero MF, Peng J-B, Rolfs A, Takanaga H, Bruford EA. 2004.The
ABCs of solute carriers: physiological, pathological and therapeutic implications of human membrane transport proteins: introduction.Pffugers Archiv447(5):465–548
DOI 10.1007/s00424-003-1192-y.
HeliconiusGenome Consortium. 2012.Butterfly genome reveals promiscuous exchange
of mimicry adaptations among species.Nature487:94–98DOI 10.1038/nature11041.
Hines HM, Papa R, Ruiz M, Papanicolaou A, Wang C, Nijhout HF, McMillan WO,
Reed RD. 2012.Transcriptome analysis reveals novel patterning and pigmentation
genes underlyingHeliconiusbutterfly wing pattern variation.BMC Genomics13:288
DOI 10.1186/1471-2164-13-288.
Hoekstra HE, Hirschmann RJ, Bundey RA, Insel PA, Crossland JP. 2006.A single
amino acid mutation contributes to adaptive beach mouse color patterns.Science
313:101–104DOI 10.1126/science.1126121.
Hohenlohe PA, Bassham S, Etter PD, Stiffler N, Johnson EA, Cresko WA. 2010.
Population genomics of parallel adaptation in threespine stickleback using sequenced RAD Tags.PLoS Genetics6(2):e1000862DOI 10.1371/journal.pgen.1000862.
Jones FC, Grabherr MG, Chan YF, Russell P, Mauceli E, Johnson J, Swofford R, Pirun M, Zody MC, White S, Birney E, Searle S, Schmutz J, Grimwood J, Dickson MC, Myers RM, Miller CT, Summers BR, Knecht AK, Brady SD, Zhang H, Pollen AA, Howes T, Amemiya C, Broad Institute Genome Sequencing Platform & Whole
genomic basis of adaptive evolution in threespine sticklebacks.Nature484:55–61
DOI 10.1038/nature10944.
Katoh K, Misawa K, Kuma K, Miyata T. 2002.MAFFT: a novel method for rapid
multiple sequence alignment based on fast Fourier transform.Nucleic Acids Research
30(14):3059–3066DOI 10.1093/nar/gkf436.
Kowano M, Kawaji H, Grandejean V, Kiani J, Rassoulzadegan M. 2012.Novel small
noncoding RNAs in mouse spermatozoa, zygotes and early embryos.PLoS ONE
7(9):e44542DOI 10.1371/journal.pone.0044542.
Krawetz SA, Kruger A, Lalancette C, Tagett R, Anton E, Draghici S, Diamond
MP. 2011.A survey of small RNAs in human sperm.Human Reproduction
26(12):3401–3412DOI 10.1093/humrep/der329.
Kriventseva EV, Tegenfeldt R, Petty TJ, Waterhouse RM, Simao FA, Pozdnyakov IA,
Ioannidis P, Zdobnov EM. 2015.OrthoDBv8: update of the hierarchical catalog of
orthologs and the underlying free software.Nucleic Acids Research43:D250–D256
DOI 10.1093/nar/gku1220.
Lorenzo FR, Huff C, Myllymäki M, Olenchock B, Swierczek S, Tashi T, Gordeuk V, Wuren T, Ri-Li G, McClain DA, Khan TM, Koul PA, Guchhait P, Salama ME, Xing J, Semenza GL, Liberzon E, Wilson A, Simonson TS, Jorde LB, Kaelin Jr
WG, Koivunen P, Prchal JT. 2014.A genetic mechanism for Tibetan high-altitude
adaptation.Nature Genetics46(9):951–956DOI 10.1038/ng.3067.
Löytynoja A. 2014.Phylogeny-aware alignment with PRANK.Methods in Molecular
Biology1079:155–170DOI 10.1007/978-1-62703-646-7_10.
MacManes MD. 2014.On the optimal trimming of high-througput mRNA sequence
data.Frontiers in Genetics5:13DOI 10.3389/fgene.2014.00013.
MacManes MD. 2016.Establishing evidenced-based best practice for the de novo
assembly and evaluation of transcriptomes from non-model organisms.bioRxiv
DOI 10.1101/035642.
MacManes MD, Eisen MB. 2014.Characterization of the transcriptome, nucleotide
se-quence polymorphism, and natural selection in the desert adapted mousePeromyscus eremicus.PeerJ 2:e642DOI 10.7717/peerj.642.
MacMillen RE, Garland Jr T. 1989.Kirkland Jr LG, Layne JN, eds.Advances in the study
of peromyscus (Rodentia). Lubbock: Texas Tech University Press, 143–168.
Madden T. 2002. The BLAST sequence analysis tool. In: McEntyre J, Ostell J, eds.
The NCBI Handbook. Bethesda: National Center for Biotechnology Information, Chapter 16.Available athttps:// www.ncbi.nlm.nih.gov/ books/ NBK153387/.
Marra NJ, Eo SH, Hale MC, Waser PM, DeWoody JA. 2012.A priorianda posteriori
approaches for finding genes of evolutionary interest in non-model species: os-moregulatory genes in the kidney transcriptome of the desert rodentDipodomys spectabilis(banner-tailed kangaroo rat).Comparative Biochemistry and Physiology, Part D: Genomics Proteomics7(4):328–339DOI 10.1016/j.cbd.2012.07.001.
Marra NJ, Romero A, DeWoody A. 2014.Natural selection and the genetic basis of
osmoregulation in heteromyid rodents as revealed by RNA-seq.Molecular Ecology
McCracken KG, Barger CP, Bulgarella M, Johnson KP, Kuhner MK, Moore AV, Peters
JL, Trucco J, Valqui TH, Winker K, Wilson RE. 2009a.Signatures of high-altitude
adaptation in the major hemoglobin of five species of andean dabbling ducks.The American Naturalist 174(5):631–650DOI 10.1086/606020.
McCracken KG, Barger CP, Bulgarella M, Johnson KP, Sonsthagen SA, Trucco J,
Valqui TH, Wilson RE, Winker K, Sorenson MD. 2009b.Parallel evolution in the
major haemoglobin genes of eight species of Andean waterfowl.Molecular Ecology
18(19):3992–4005DOI 10.1111/j.1365-294X.2009.04352.x.
Natarajan C, Hoffman FG, Lanier HC, Wolf CJ, Cheviron ZA, Spangler ML, Weber RE,
Fago A, Storz JF. 2015.Intraspecific polymorphism, interspecific divergence, and
origins of function-altering mutation in deer mouse hemoglobin.Molecular Biology and Evolution32(4):978–997DOI 10.1093/molbev/msu403.
Nawrocki EP, Burge SW, Bateman A, Daub J, Eberhardt RY, Eddy SR, Floden EW,
Gardner PP, Jones TA, Tate J, Finn RD. 2015.Rfam 12.0: updates to the RNA
families database.Nucleic Acids Research43:D130–D137DOI 10.1093/nar/gku1063.
Patro R, Duggal G, Kingsford C. 2015.Salmon: accurate, versatile and ultrafast
quantification from RNA-seq data using lightweight-alignment.bioRxiv
DOI 10.1101/021592.
Price M, Dehal P, Arkin A. 2010.FastTree2-approximately maximum-likelihood trees
for large alignments.PLoS ONE 5(3):e9490DOI 10.1371/journal.pone.009490.
Ramm SA, Scharer L, Ehmcke J, Wistuba J. 2014.Sperm competition and the
evo-lution of spermatogenesis.Molecular Human Reproduction20(12):1169–1179
DOI 10.1093/molehr/gau070.
Ramm SA, Stockley P. 2007.Ejaculate allocation under varying sperm competition risk
in the house mouse,Mus musculus domesticus.Behavioral Ecology 18(2):491–495
DOI 10.1093/beheco/arm003.
Saier MH, Reddy VS, Tamang DG, Vastermark A. 2014.The transporter classification
database.Nucleic Acids Research42:D251–D258DOI 10.1093/nar/gkt1097.
Schmidt-Nielsen K, Schmidt-Nielsen B. 1952.Water metabolism of desert mammals 1.
Physiological Reviews32(2):135–166.
Schmidt-Nielsen B, Schmidt-Nielsen K, Brokaw A, Schneiderman H. 1948.Water
conservation in desert rodents.Journal of Cellular Physiology32(3):331–360
DOI 10.1002/jcp.1030320306.
Scott C. 2016.dammit: an open and accessible de novo transcriptome annotator.
Available atwww.camillescott.org/ dammit.
Sikes RS, Gannon WL, Animal Care and Use Committee of the American Society of
Mammalogists. 2011.Guidelines of the American society of mammalogists for the
use of wild mammals in research.Journal of Mammalogy92(1):235–253
DOI 10.1644/10-MAMM-F-355.1.
Simão FA, Waterhouse RM, Ioannidis P, Kriventseva EV, Zdobnov EM. 2015.BUSCO:
Smith-Unna R, Boursnell C, Patro R, Hibberd JM, Kelley S. 2016.TransRate: reference free quality assessment of de-novo transcriptome assemblies.Genome Research
26:1134–1144DOI 10.1101/gr.196469.115.
Snel B, Lehmann G, Bork P, Huynen MA. 2000.STRING: a web-server to retrieve and
display the repeatedly occurring neighbourhood of a gene.Nucleic Acids Research
28(18):3442–3444DOI 10.1093/nar/28.18.3442.
Song L, Florea L. 2015.Rcorrector: efficient and accurate error correction for Illumina
RNA-seq reads.Gigascience4:48DOI 10.1186/s13742-015-0089-y.
Sonnhammer ELL, Eddy SR, Durbin R. 1997.Pfam: a comprehensive database of
protein families based on seed alignments.Proteins28(3):405–420.
Storz JF, Runck AM, Moriyama H, Weber RE, Fago A. 2010.Genetic differences in
hemoglobin function between highland and lowland deer mice.Journal of Experi-mental Biology213(15):2565–2574DOI 10.1242/jeb.042598.
Storz JF, Wheat CW. 2010.Integrating evolutionary and functional approaches to infer
adaptation at specific loci.Evolution64(9):2489–2509
DOI 10.1111/j.1558-5646.2010.01044.x.
Sun J, Lin Y, Wu J. 2013.Long non-coding RNA expression profiling of mouse testis
dur-ing post-natal development.PLoS ONE8(10):e75750
DOI 10.1371/journal.pone.0075750.
Suzek BE, Huang H, McGarvey PB, Mazumder R, Wu CH. 2007.UniRef:
com-prehensive and non-redundant UniProt reference clusters.Bioinformatics
23(10):1282–1288DOI 10.1093/bioinformatics/btm098.
Suzek BE, Wang Y, Huang H, McGarvey PB, Wu CH. 2015.UniRef clusters: a
com-prehensive and scalable alternative for improving sequence similarity searches. Bioinformatics31(6):926–932DOI 10.1093/bioinformatics/btu739.
Swanson WJ, Vacquier VD. 2002.The rapid evolution of reproductive proteins.Nature
Reviews Genetics3(2):137–144DOI 10.1038/nrg733.
Szklarczyk D, Franceschini A, Wyder S, Forslund K, Heller D, Huerta-Cepas J, Simonovic M, Roth A, Santos A, Tsafou KP, Kuhn M, Bork P, Jensen LJ, Von
Mering C. 2015.STRINGv10: protein-protein interaction networks, integrated over
the tree of life.Nucleic Acids Research43:D447–D452DOI 10.1093/nar/gku1003.
Turner LM, Chuong EB, Hoekstra HE. 2008.comparative analysis of testis protein
evolution in Rodents.Genetics179(4):2075–2089DOI 10.1534/genetics.107.085902.
Uhlén M, Fagerberg L, Hallström BM, Lindskog C, Oksvold P, Mardinoglu A, Siverts-son Å, Kampf C, Sjöjstedt E, Asplund A, OlsSiverts-son I, Edlund K, Lundberg E, Navani S, Szigyarto CA, Odeberg J, Djureinovic D, Takanen JO, Hober S, Alm T, Edqvist PH, Berling H, Tegel H, Mulder J, Rockberg J, Nilsson P, Schwenk JM, Hamsten M, Von Feilitzen K, Forsberg M, Persson L, Johansson F, Zwahlen M, Von Heijne
G, Nielsen J, Pontén F. 2015.Tissue-based map of the human proteome.Science
347(6220):1260419DOI 10.1126/science.1260419.
Urity VB, Issaian T, Braun EJ, Dantzler WH, Pannabecker TL. 2012.Architecture of
Veal R, Caire W. 2001.Peromyscus eremicus.Mammalian Species118:1–6.
Vicens A, Luke L, Roldan E.RS. 2014.Proteins involved in motility and sperm-egg
interaction evolve more rapidly in mouse spermatozoa.PLoS ONE9(3):e91302
DOI 10.1371/journal.pone.0091302.
Vimtrup BJ, Schmidt-Nielsen B. 1952.The histology of the kidney of kangaroo rats.The
Anatomical Record114(4):515–528DOI 10.1002/ar.1091140402.
Weber JN, Hoekstra HE. 2009.The evolution of burrowing behavior in deer mice (genus
Peromyscus).Animal Behavior77(3):603–609DOI 10.1016/j.anbehav.2008.10.031.
Weber JN, Peterson BK, Hoekstra HE. 2013.Discrete genetic modules are responsible
for complex burrow evolution inPeromyscusmice.Nature493(7342):402–405
DOI 10.1038/nature11816.
Wolff J. 1989. Social behavior. In: Kirkland Jr LG, Layne JN, eds.Advances in the study of
Peromyscus (Rodentia). Lubbock: Texas Tech University Press, 271–291.
Yang Z. 1997.PAML: a program package for phylogenetic analysis by maximum
likelihood.Computer Applications in BioSciences13(5):555–556.
Yang Z. 1998.Likelihood ratio tests for detecting positive selection and application to
primate lysozyme evolution.Molecular Biology and Evolution15(5):568–573.
Yang Z. 2007.PAML4: phylogenetic analysis by maximum likelihood.Molecular Biology
and Evolution24(8):1586–1591DOI 10.1093/molbev/msm088.
Zhang J, Nielsen R, Yang Z. 2005.Evaluation of an improved branch-site likelihood