BGD
10, 2705–2765, 2013Coastal
thermo-erosion in the Laptev Sea
F. G ¨unther et al.
Title Page
Abstract Introduction
Conclusions References
Tables Figures
◭ ◮
◭ ◮
Back Close
Full Screen / Esc
Printer-friendly Version Interactive Discussion
Discussion
P
a
per
|
Dis
cussion
P
a
per
|
Discussion
P
a
per
|
Discussio
n
P
a
per
|
Biogeosciences Discuss., 10, 2705–2765, 2013 www.biogeosciences-discuss.net/10/2705/2013/ doi:10.5194/bgd-10-2705-2013
© Author(s) 2013. CC Attribution 3.0 License.
Open Access
Biogeosciences Discussions
Geoscientiic Geoscientiic
Geoscientiic Geoscientiic
This discussion paper is/has been under review for the journal Biogeosciences (BG). Please refer to the corresponding final paper in BG if available.
Short and long-term thermo-erosion of
ice-rich permafrost coasts in the Laptev
Sea region
F. G ¨unther1, P. P. Overduin1, A. V. Sandakov2, G. Grosse3, and M. N. Grigoriev2
1
Alfred Wegener Institute Helmholtz Centre for Polar and Marine Research, Potsdam, Germany
2
Permafrost Institute, Russian Academy of Sciences, Siberian Branch, Yakutsk, Russia
3
Geophysical Institute, University of Alaska Fairbanks, Fairbanks, USA
Received: 19 January 2013 – Accepted: 29 January 2013 – Published: 15 February 2013
Correspondence to: F. G ¨unther ([email protected])
BGD
10, 2705–2765, 2013Coastal
thermo-erosion in the Laptev Sea
F. G ¨unther et al.
Title Page
Abstract Introduction
Conclusions References
Tables Figures
◭ ◮
◭ ◮
Back Close
Full Screen / Esc
Printer-friendly Version Interactive Discussion
Discussion
P
a
per
|
Dis
cussion
P
a
per
|
Discussion
P
a
per
|
Discussio
n
P
a
per
|
Abstract
Permafrost coasts in the Arctic are susceptible to a variety of changing environmen-tal factors all of which currently point to increasing coasenvironmen-tal erosion rates and mass fluxes of sediment and carbon to the shallow arctic shelf seas. Rapid erosion along high yedoma coasts composed of Ice Complex permafrost deposits creates
impres-5
sive coastal ice cliffs and inspired research for designing and implementing change
detection studies for a long time, but continuous quantitative monitoring and a qualita-tive inventory of coastal thermo-erosion for large coastline segments is still lacking. Our goal is to use observations of thermo-erosion along the mainland coast of the Laptev Sea in eastern Siberia to understand how erosion rates depend on coastal
geomor-10
phology and the relative contributions of waterline and atmospheric drivers to coastal thermo-erosion over the past 4 decades and in the past few years. We compared mul-titemporal sets of orthorectified satellite imagery from 1965 to 2011 for three segments of coastline with a length of 73 to 95 km each and analyzed thermo-denudation (TD)
along cliff top and thermo-abrasion (TA) along cliff bottom for two nested time
peri-15
ods: long-term rates (the past 39–43 yr) and short term rates (the past 1–3 yr). The
Normalized Difference Thermo-erosion Index (NDTI) was used as a proxy that
qual-itatively describes the relative proportions of TD and TA. Mean annual erosion rates
at all three sites were higher in recent years (−5.3±1.31 m a−1) than over the long
term mean (−2.2±0.13 m a−1). The Mamontov Klyk coast exhibit primarily spatial
vari-20
ations of thermo-erosion, while intrasite-specific variations were strongest at the Buor
Khaya coast, where slowest long-term rates around−0.5±0.08 m a−1were observed.
The Oyogos Yar coast showed continuously rapid erosion up to−6.5±0.19 m a−1. In
general, variable characteristics of coastal thermo-erosion were observed not only
be-tween study sites and over time, but also within single coastal transects along the cliff
25
profile. Varying intensities of cliffbottom and top retreat are leading to diverse
quali-ties of coastal erosion that have different impacts on coastal mass fluxes. The different
BGD
10, 2705–2765, 2013Coastal
thermo-erosion in the Laptev Sea
F. G ¨unther et al.
Title Page
Abstract Introduction
Conclusions References
Tables Figures
◭ ◮
◭ ◮
Back Close
Full Screen / Esc
Printer-friendly Version Interactive Discussion
Discussion
P
a
per
|
Dis
cussion
P
a
per
|
Discussion
P
a
per
|
Discussio
n
P
a
per
|
influence not only the degree of coupling between TD and TA, and the magnitude of
effectively eroded volumes, but also the quantity of organic carbon released to the
shallow Laptev Sea from coastal erosion, which ranged on a long-term from 88±21.0
to 800±61.1 t per km coastline per year and will correspond to considerably higher
amounts, if recently observed more rapid coastal erosion rates prove to be persistent.
5
1 Introduction
Coastal erosion as a physical process along the marginal arctic shelf seas attracts in-creased attention not only in periglacial research (e.g. Lantuit et al., 2011b; Vasiliev et al., 2011), marine geosciences (Charkin et al., 2011), but also in the public aware-ness in terms of rapid responses of coastal erosion to climate warming, leading to
10
landscape instability and increased hazard exposure (Forbes, 2011). Because of re-cently decreasing sea ice extent (Comiso et al., 2008; Maslanik et al., 2011), larger fetch (Asplin et al., 2012), wave action and storm activity (Jones et al., 2009), a dou-bling in the duration of the open water season (Overeem et al., 2011), and rising air, permafrost, and sea water temperatures during the last decades (Romanovsky et al.,
15
2010; Dmitrenko et al., 2011; AMAP, 2011), erosion of arctic permafrost coasts and land loss are expected to increase. The enhanced material fluxes in the nearshore
zone, including sediment, organic matter, and nutrients, affect marine ecosystems and
primary production in arctic coastal habitats (Wassmann, 2011). The Arctic Ocean is the most land-dominated ocean basin, because of its large continental catchments
(Pe-20
terson et al., 2002), where terrigeneous dissolved organic carbon is mobilized from high
latitude carbon-rich soils and peatlands (Benner et al., 2004). Permafrost affected
arc-tic coasts make up approximately 34 % of the world’s coastlines (Lantuit et al., 2011b), and feature an unique suite of coastal processes with strong seasonality, cold temper-atures, permafrost, and sea ice, found nowhere else except Antarctica (Forbes, 2011).
25
BGD
10, 2705–2765, 2013Coastal
thermo-erosion in the Laptev Sea
F. G ¨unther et al.
Title Page
Abstract Introduction
Conclusions References
Tables Figures
◭ ◮
◭ ◮
Back Close
Full Screen / Esc
Printer-friendly Version Interactive Discussion
Discussion
P
a
per
|
Dis
cussion
P
a
per
|
Discussion
P
a
per
|
Discussio
n
P
a
per
|
ice-rich permafrost deposits (Grigoriev et al., 2006), which are highly susceptible to erosion.
In many regions, the coastal zone of the shallow East Siberian Arctic Shelf has a dominantly heterotrophic character (Pipko et al., 2011), where organic and inorganic
carbon from coastal erosion and river runoffresult in sea acidification and out-gassing
5
of CO2to the atmosphere (Razumov and Grigoriev, 2011). In addition, Are (1999) and
Rachold et al. (2000) find that sediment release to the ocean from the coasts in the Laptev Sea region is at least of the same order of magnitude as the amount of riverine input, underlining the importance of coastal erosion processes and the need for better quantification.
10
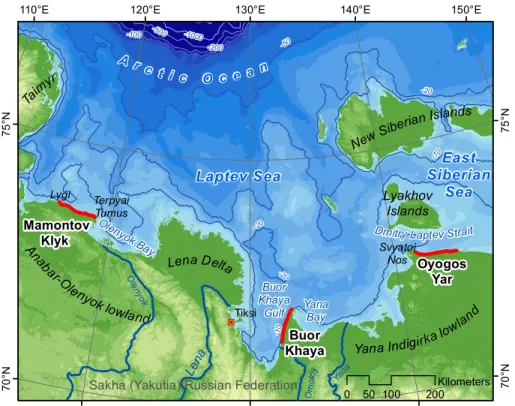
Along permafrost-dominated coasts, heat transfer and melt of ground ice is added to the mechanical erosion forces of waves and ice. This process of thermo-erosion dominates the majority of the Laptev Sea coast (Fig. 1) and leads to rapid erosion rates and the subsequent inundation of continental polygenetic permafrost deposits (Winterfeld et al., 2011), including the Ice Complex (in Russian “ledovyi kompleks”;
15
also called yedoma) and thermokarst (also called alas) deposits (e.g. Schirrmeister et al., 2011b). Geomorphologically, yedoma constitutes hilly uplands and alas low lying
basins, establishing local differences in elevation, e.g. up to 27 m in the Lena Delta
(Ulrich et al., 2010). Both types of deposits also contain high amounts of ground ice and soil organic carbon (Schirrmeister et al., 2011a; Strauss et al., 2012), making them
20
generally very vulnerable to carbon mobilization from disturbances (e.g. Grosse et al., 2011), especially in coastal settings (Grigoriev et al., 2004; Semiletov et al., 2011).
Thermo-erosion creates coastal cliffs with geomorphological features unique to
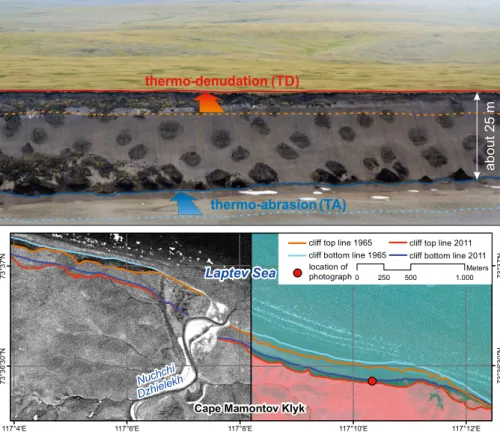
ice-rich coastlines. Two mass transport processes that combine thermal and mechanical forces to erode the coastline are thermo-denudation (TD) thermo-abrasion (TA) (see
25
Are, 1988a,b; Dupeyrat et al., 2011, and Fig. 2). TA is defined as the combined
me-chanical and thermal effects of impinging wave energy at the shoreline. TD is defined
BGD
10, 2705–2765, 2013Coastal
thermo-erosion in the Laptev Sea
F. G ¨unther et al.
Title Page
Abstract Introduction
Conclusions References
Tables Figures
◭ ◮
◭ ◮
Back Close
Full Screen / Esc
Printer-friendly Version Interactive Discussion
Discussion
P
a
per
|
Dis
cussion
P
a
per
|
Discussion
P
a
per
|
Discussio
n
P
a
per
|
coastal landslides. As an agent of TD, melt water from ground ice causes water satu-ration on coastal slopes, enabling gelifluction of blocks and mud stream development.
In addition to erosion products resulting from TA, TD on coastal cliffs delivers eroded
clastic material to the cliff’s bottom edge and to the shore platform. Often, additional
processes such as thermo-niche development and mechanical failure of ice-wedge
5
polygonal blocks along eroding coasts enhance mass transport rates. We adopt the definition of thermo-erosion of the permafrost coast of Are (1988a) as the combined
effects of TD and TA.
Ice Complex coasts have been studied by other researchers. For instance, Kaplina (1959) describes acceleration of coastal erosion in connection with the occurence of
10
large ice wedge bodies, leading to a reduction of material accruing during undercutting
of coastal cliffs through thermo-niches. Klyuev (1970) carries out repeated surveys to
quantify thermo-abrasion of the sea bottom. Are et al. (2005) develope a method for calculating coastal retreat rate based on the dimensions of thermo-terraces widespread across the Laptev Sea coast. Overduin et al. (2007) present a conceptual model of
per-15
mafrost preservation under submarine conditions in dependence on coastal erosion rates. Grigoriev (2008) does monitoring and analytical work on coastal permafrost dy-namics and mass fluxes on the East Siberian Arctic Shelf. Razumov (2010) systemizes endogeneous and exogeneous factors for modelling approaches of permafrost coastal erosion. Recent contributions are conducted by Pizhankova and Dobrynina (2010) and
20
Lantuit et al. (2011a), who carry out remote sensing time series analyses of coastal erosion dynamics for the entire Lyakhov Islands and the Bykovsky Peninsula, respec-tively.
The Arctic Coastal Dynamics Project (ACD) (Rachold et al., 2003) and Lantuit et al. (2011b) report a weighted mean annual coastal erosion rate for the Laptev Sea of
25
0.73 m per year (m a−1). Grigoriev (2008) quantify a mean retreat rate of 1.9 m a−1, for
BGD
10, 2705–2765, 2013Coastal
thermo-erosion in the Laptev Sea
F. G ¨unther et al.
Title Page
Abstract Introduction
Conclusions References
Tables Figures
◭ ◮
◭ ◮
Back Close
Full Screen / Esc
Printer-friendly Version Interactive Discussion
Discussion
P
a
per
|
Dis
cussion
P
a
per
|
Discussion
P
a
per
|
Discussio
n
P
a
per
|
et al., 2003, 2009; Grigoriev, 2008). Studies on coastal erosion in the eastern sector of the Russian Arctic are spatially limited and inconsistent in their methods of data
collection and interpretation. Therefore, satellite-based remote sensing offers the only
viable mean of observing, quantifying and monitoring coastal erosion dynamics in the Arctic over large regions. Although the morphodynamics of permafrost coasts have
5
been investigated in various regions, the relative intensities and contributions of TD and TA to erosion dynamics require detailed quantitative study. Despite the existence of absolute long-term and actual coastal retreat rates, adequate interpretation will depend on analyzing which processes drive local thermo-erosion.
The objective of this paper is to use observations of thermo-erosion along the Laptev
10
Sea coastline to understand the relative contributions of TD and TA to the erosion of ice-rich permafrost coasts over the past four decades and over the past few years, in
three different settings in the Laptev Sea region. We apply the concept of
Normalized-Difference-Thermo-erosion-Index (NDTI) of G ¨unther et al. (2012), as a dimensionless
index of the ratio of TD and TA above the waterline. Using state-of-the-art digital image
15
processing and GIS change detection techniques, we determine and compare mean annual coastal erosion rates for long and short-term observation periods. Using our findings, we discuss the impacts of these permafrost degradation processes on mass fluxes of organic carbon from land to arctic shelf sea. Understanding spatial patterns of thermo-erosion and how associated processes change over time will help us gain
20
predictive capability as conditions for erosion in the Arctic are changing.
2 Study site description
2.1 Geographical setting
All studied sites are located in northern Yakutia (Russian Federation) along the main-land coast of the Laptev Sea that extends from Taymir in the west to Cape
Svya-25
BGD
10, 2705–2765, 2013Coastal
thermo-erosion in the Laptev Sea
F. G ¨unther et al.
Title Page
Abstract Introduction
Conclusions References
Tables Figures
◭ ◮
◭ ◮
Back Close
Full Screen / Esc
Printer-friendly Version Interactive Discussion
Discussion
P
a
per
|
Dis
cussion
P
a
per
|
Discussion
P
a
per
|
Discussio
n
P
a
per
|
(1985), the territories of the outermost sites Mamontov Klyk and Oyogos Yar belong to the Arctic tundra, the Buor Khaya Peninsula to the northern tundra zone. The sub-arctic climate is continental and characterized by long harsh winters and short cold summers. Mean annual air temperature in Tiksi in the southern central Laptev Sea
is −11.5◦C (Romanovsky et al., 2010), the amplitude of seasonal variation 40.6◦C
5
(Kholodov et al., 2012). Terrestrial permafrost is continuously distributed in the region (Popov, 1989). The Laptev Sea is one of the shallow Siberian shelf seas (Fig. 1) and is underlain by subsea permafrost up to 500–650 m deep along the mainland coast (Romanovskii and Tumskoy, 2011). Roughly from October to June, the coastal sea is covered by thick one-year land fast sea ice. The sea ice-free season lasts for only 14 %
10
in the western, and 20 % of the year in the eastern Laptev Sea (Dunaev and Nikiforov, 2001). The Olenyok-Anabar and Yana-Indigirka coastal lowlands (Fig. 1) in the North of East Siberia represent former late Pleistocene accumulation plains. Subjected to permafrost degradation processes, nowadays their geomorphology is determined by levelling through thermokarst and drainage development in direction to the coast. By
15
far the largest river in the Laptev Sea region is the Lena River with an annual water
discharge of 529 km3(ROSHYDROMET and ArcticRIMS, 2009).
The Laptev Sea region is a unique geodynamic system, where active mid-oceanic seafloor spreading transforms into a passive rift system on continental crust (Sekretov, 2001), characterized by an alternating syncline-anticline system of neotectonic uplifted
20
horsts and small grabens (Drachev et al., 1998). A variation of the coastal morphology in the Siberian Arctic is influenced by glacial isostatic adjustment during the Holocene (Whitehouse et al., 2007). West and Middle Siberian rivers terminate in estuaries, while East Siberian rivers form marine deltas. According to Whitehouse et al. (2007) the
tran-sition between these two types of drainage occurs approximately at longitude 115◦E.
25
BGD
10, 2705–2765, 2013Coastal
thermo-erosion in the Laptev Sea
F. G ¨unther et al.
Title Page
Abstract Introduction
Conclusions References
Tables Figures
◭ ◮
◭ ◮
Back Close
Full Screen / Esc
Printer-friendly Version Interactive Discussion
Discussion
P
a
per
|
Dis
cussion
P
a
per
|
Discussion
P
a
per
|
Discussio
n
P
a
per
|
2.2 Mamontov Klyk
The studied coastline in the western Laptev Sea between the estuary of the Anabar River and the Olenyok River delta extents from Cape Lygi across Cape Mamontov
Klyk to the former polar station at Cape Terpyai Tumus in the East (Fig. 1; 73◦41′45′′N
115◦53′7′′E and 73◦33′11′′N 118◦42′16′′E). According to Schirrmeister et al. (2008)
5
the stratigraphy of the permafrost sequences cropping out at the coast cover late Pleis-tocene and Holocene strata and is composed of less ice-rich fluvial silts and sands with peat layers, covered with 20–30 m thick ice-supersaturated silty to sandy Ice Complex deposits. Holocene thermokarst deposits have been found in alasses, thermoerosional valleys and in places discordantly superimposing the Ice Complex (Grosse et al., 2006).
10
The hinterland of the coast is gently inclined towards the Laptev Sea coast in the north
with a mean slope of 0.1◦and incised by a dendritic network of thermo-erosional
val-leys (Schirrmeister et al., 2008). Coastline length between the end points in this study near capes Lygi and Terpyai Tumus is 95 km, 56 km of which are studied for coastal dy-namics. The remaining part of the coastline consists of river mouths with small deltaic
15
accumulation cones, alluvial marshy bays, and marine terraces and sand spits, without visible erosion (e.g. Fig. 2). Although the coastline is generally straightened by thermo-abrasion, it features a wavy pattern with convex protrusions and concave indentations on a mesoscale of tens of kilometers. Klyuev (1970) describes alongshore coastal ma-terial drift from west to east for this region, resulting in the large sand accumulation
20
zone at the outer margin of Terpyai Tumus. The high ground ice volume renders this
coastline exceptionally well suited to high cliffretreat rates.
2.3 Buor Khaya
The central study site is the western coast of the Buor Khaya Peninsula (Fig. 1). Bor-dered by two grabens that dissipated north of the Buor Khaya Cape (Imaeva et al.,
25
BGD
10, 2705–2765, 2013Coastal
thermo-erosion in the Laptev Sea
F. G ¨unther et al.
Title Page
Abstract Introduction
Conclusions References
Tables Figures
◭ ◮
◭ ◮
Back Close
Full Screen / Esc
Printer-friendly Version Interactive Discussion
Discussion
P
a
per
|
Dis
cussion
P
a
per
|
Discussion
P
a
per
|
Discussio
n
P
a
per
|
this region consist of silty fine sand with peaty inclusions. The western coastline of the Buor Khaya Peninsula reveals a high heterogeneity of geomorphological units, such as tapped lake basins, alasses (9–14 m above mean sea level (a.m.s.l.)), yedoma hills (up to 37 m a.m.s.l.) and transition zones between the latter two. The hinterland is inclined
towards north with a mean slope of 0.05◦, and is characterized by thermokarst relief.
5
Isolated yedoma remnants cover only 15 % of the area, which are dissipated by coa-lesced thermokarst basins. Dunaev and Nikiforov (2001) describe alongshore material drift from south to north, manifested in the 30 km long Buor Khaya spit, the product of lit-toral processes. The length of the Buor Khaya west coast between the outermost points
of this study (71◦20′41′′N 132◦3′23′′E and 71◦56′49′′N 132◦45′44′′E) is 73 km, of
10
which 48 km were studied for coastal erosion dynamics.
2.4 Oyogos Yar
The third study region belongs to the Yana-Indigirka lowland and extends along the Oyogos Yar mainland coast of the Dmitry Laptev Strait from Cape Svyatoi Nos in the West to the Kondratyeva River mouth in the East (Fig. 1). Cape Svyatoi Nos is an
iso-15
lated cretaceous granite dome (433 m a.m.s.l.), where the beach of the rocky coast is characterized by large sized boulders (Are et al., 2002). In the vincity of Svyatoi Nos, yedoma hills with Ice Complex remnants are degradaded by closely spaced thermo-erosional valleys, become less frequent further east and are again found at the outer eastern margin of the coastline segment. The stratigraphy at the Oyogos Yar coast
in-20
cludes Eemian lacustrine deposits followed by late Pleistocene Ice Complex deposits as well as Holocene thermokarst sequences (Wetterich et al., 2009). Most of the coast cuts through thermokarst depressions. According to Opel et al. (2011), alas bottoms reach elevations of about 8–12 m a.m.s.l. and consist of poorly sorted silt with peat in-clusions and syngenetic ice wedges. The very gently inclined steplike landscape inland
25
(Schirrmeister et al., 2011b) is drained by several thermoerosional valleys. The direc-tion of surface currents in the Dmitry Laptev Strait, the gateway to the East Siberian
BGD
10, 2705–2765, 2013Coastal
thermo-erosion in the Laptev Sea
F. G ¨unther et al.
Title Page
Abstract Introduction
Conclusions References
Tables Figures
◭ ◮
◭ ◮
Back Close
Full Screen / Esc
Printer-friendly Version Interactive Discussion
Discussion
P
a
per
|
Dis
cussion
P
a
per
|
Discussion
P
a
per
|
Discussio
n
P
a
per
|
141◦30′51′′E and 72◦39′20′′N 143◦50′36′′E) is 81 km, all of which are included in
this analysis.
3 Methods
3.1 Remote sensing data fusion approach
In order to provide a consistent picture of coastal erosion rates for our study sites,
5
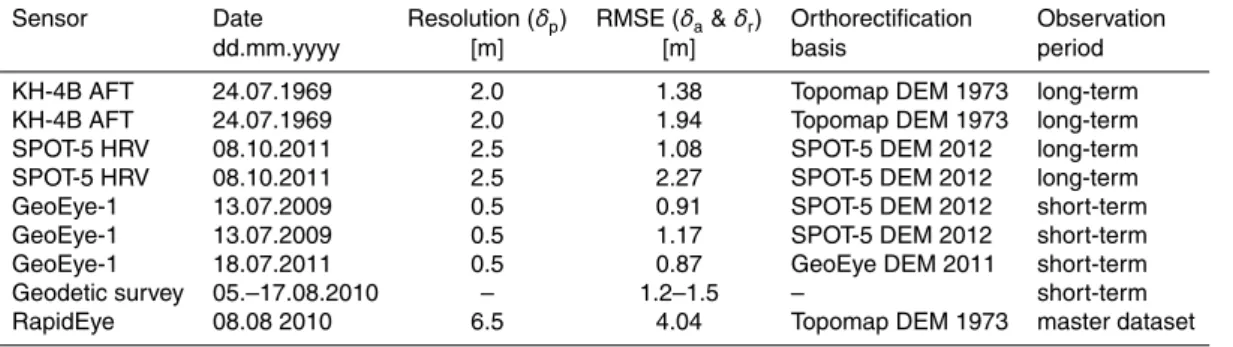
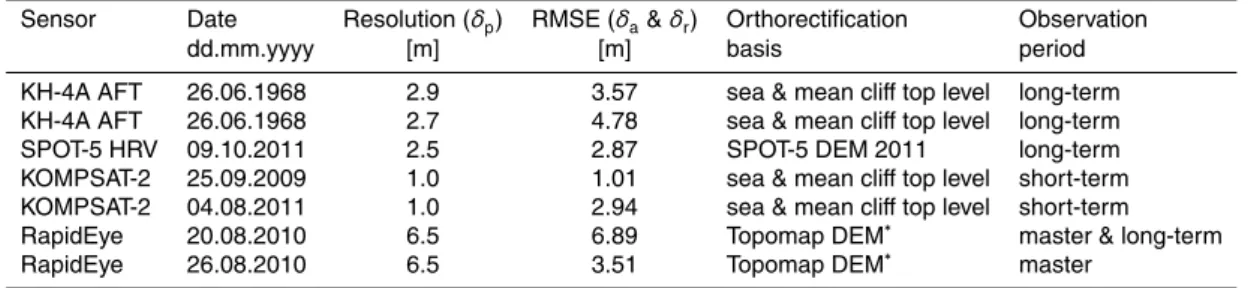
we applied a common best-practice strategy of data collection, fusion, examination and analysis to all three sites. Accurate monitoring of coastline changes using multi-temporal, multi-platform remotely sensed data requires consideration of various dis-tortions, including distortions associated with the platform, the map projection, and shape of the Earth’s surface. In this study we use high and very high spatial
reso-10
lution CORONA KH-4A and KH-4B, ALOS PRISM, KOMPSAT-2, SPOT-5, RapidEye
and GeoEye space-borne imagery with differing geometric characteristics (Tables 1,
2, and 3). For coastline digitalization we used images of similar high spatial resolution
(0.5–2.5 m). All images used were acquired at different times, and at different oblique
viewing and azimuth angles.
15
Conventional 2-D polynomial image rectification functions for image co-registration do not correct for relief induced and image acquisition system distortions. Toutin (2004) points out that 2-D ground control points (GCPs) correct for local distortions at the GCP location and are very sensitive to input errors. Consequently, this approach should be avoided for precise geometric multi-source/multi-format data integration. Our object of
20
interest, the coastline, is always outside a cloud of GCPs on land. Therefore, the accu-racy of our measurements relies heavily on correct terrain approximation and physical
BGD
10, 2705–2765, 2013Coastal
thermo-erosion in the Laptev Sea
F. G ¨unther et al.
Title Page
Abstract Introduction
Conclusions References
Tables Figures
◭ ◮
◭ ◮
Back Close
Full Screen / Esc
Printer-friendly Version Interactive Discussion
Discussion
P
a
per
|
Dis
cussion
P
a
per
|
Discussion
P
a
per
|
Discussio
n
P
a
per
|
3.2 Georeferencing and ortho-rectification
Registration of multiple source imagery is one of the most important issues when deal-ing with remote sensdeal-ing data (Le Moigne et al., 2011). Change detection over time requires multitemporal data calibration through georeferencing, that is explicit assign-ment of geodata with absolute position information of a co-ordinate system. The initial
5
georeferencing basis for multispectral optical GeoEye and RapidEye image data is a network of GPS GCPs of well identifyable immobile features, such as small ponds, collected in the field. The GCPs which were incorporated into the tacheometric surveys
are known with high absolute accuracy of≤1 m. Other single GCPs were collected in
the field using the GPS waypoint averaging function to achive good positional
accu-10
racy of 2–4 m. Polygon ponds studied by Wetterich and Schirrmeister (2008), served as GCPs in the Oyogos Yar region. This selection of GCPs was then localized in the imagery and used for manual image registration. The potential georeferencing accu-racy improves when ground resolution of the imagery increases. With the aid of addi-tional parameter models as Fraser and Ravanbakhsh (2009) describe, georeferencing
15
of GeoEye imagery (Geo & GeoStereo level) showed very good results, often with sub-metre accuracy. For areas with no GeoEye coverage, RapidEye serves as master dataset for further registration purposes. Having RapidEye (Level 1B) wide area im-agery that come with the full internal and external orientation parameters and rational
polynomial coefficients (RPC), we were able to filter out inaccurate GCPs and to
es-20
tablish for all sites a common and comparable high resolution reference data set with
large areal coverage and absolute root mean square errors (RMSE δa) within pixel
size (Tables 1, 2, and 3). It was used as a basis of equal quality for georeferencing all imagery for long-term observations, covering areas where no direct ground survey data were available. All input and reference scenes were projected using the respective
25
UTM zone (50N, 53N and 54N) on a WGS-84 model.
BGD
10, 2705–2765, 2013Coastal
thermo-erosion in the Laptev Sea
F. G ¨unther et al.
Title Page
Abstract Introduction
Conclusions References
Tables Figures
◭ ◮
◭ ◮
Back Close
Full Screen / Esc
Printer-friendly Version Interactive Discussion
Discussion
P
a
per
|
Dis
cussion
P
a
per
|
Discussion
P
a
per
|
Discussio
n
P
a
per
|
for observing long-term changes, (Grosse et al., 2005). A challenging task is the rec-tification of panoramic CORONA KH-4A and KH-4B imagery for mapping purposes.
Sohn et al. (2004) describe several distortion overlap effects, which are maximized
to-wards the ends of each photograph. Fragments of our sites lie at the margins of the
film strips and are therefore strongly affected by perspective distortions. Following
Piec-5
zonka et al. (2011), we use Remote Sensing Graz (RSG, 2011) software for processing CORONA data of the years 1965, 1968, and 1969, which were obtained from the U.S. Geological Survey as four image tiles at 7 µm scan resolution. Stitching image tiles
and subsequent subsetting of a region of interest was done in Adobe® Photoshop®
CS5.5, to retain the subset position within the full film strip dimensions. Using RSG
10
with an implemented parametric sensor model, we were able to reconstruct inner and
outer orientation parameters of the image acquisition in order to calculate the effective
ground resolution of each subset. The geometric resolution (δp) in m of each CORONA
subset was calculated from:
δp= h
ck·∆ηs (1)
15
where h is flight height, ck focal length, and ηs digitizing distance. Ground
resolu-tion ranged from 2.0 to 2.9 m (Tables 1, 2, and 3). Neighboring and laterally overlap-ping scenes we handled as joint photogrammetric image blocks for subsequent ortho-rectification. For mapping purposes within ortho-images, the scenes of the CORONA AFT (backward looking) camera were preferred, as the CORONA FWD (forward
look-20
ing) camera scenes showed either lower radiometric quality or less favourable overlap situation. We ortho-rectified CORONA data using digital elevation models (DEMs) cre-ated from CORONA along-track stereoscopic images acquired at the same time (Ma-montov Klyk study site), from topographic maps with an contour equidistancy of 10 m that were produced based on aerial surveys from 1973 (Buor Khaya study site), or
25
from several ellipsoid-based ortho-image series using sea level or varying cliffheights
BGD
10, 2705–2765, 2013Coastal
thermo-erosion in the Laptev Sea
F. G ¨unther et al.
Title Page
Abstract Introduction
Conclusions References
Tables Figures
◭ ◮
◭ ◮
Back Close
Full Screen / Esc
Printer-friendly Version Interactive Discussion
Discussion
P
a
per
|
Dis
cussion
P
a
per
|
Discussion
P
a
per
|
Discussio
n
P
a
per
|
The Panchromatic Remote-Sensing Instrument for Stereo Mapping (PRISM) on board the Advanced Land Observing Satellite (ALOS) had a forward, backward, and nadir channel. They formed an along-track triplet scene with 2.5 m resolution. We cor-rected PRISM data (Level 1B1) from 2007 and 2009 for the Mamontov Klyk study site using DEM’s that we generated from triplets (OBS1 data) and stereo scenes of
5
backward and nadir looking scenes (OBS2 data). Prior to DEM extraction and ortho-rectification we reduced JPEG noise from PRISM data using the software of Kamiya (2008). Panchromatic data obtained by SPOT5-HRS (High Resolution Stereoscopic), provided also imagery at comparable ground resolution of 2.5 m. We corrected SPOT-5 data (Level 1A) for Buor Khaya and Oyogos Yar using DEMs that we generated from
10
1-day interval across-track stereo pairs of the same datasets. In combination with the CORONA datasets, PRISM and SPOT-5 data span our long-term observation periods of several decades up to 43 yr.
To determine recent short-term coastal erosion rates we used a time series of multi-ple GeoEye and KOMPSAT-2 very high resolution images. In case of a spatial overlap,
15
these images were geo-referenced to each other, making it easier to find common GCPs close to the coastline. We applied pan-sharpening (Ehlers et al., 2010) to all KOMPSAT-2 and GeoEye-1 imagery, used for short-term measurements. All
process-ing of recent remote sensprocess-ing data was done usprocess-ing PCI Geomatic’s© Geomatica 2012
OrthoEngine.
20
3.3 Field work
Field sites were surveyed during joint Russian-German expeditions “Eastern Laptev Sea – Buor Khaya Peninsula 2010” (Wetterich et al., 2011) and “Western Laptev Sea – Mamontov Klyk 2011”. During field work we produced a basic dataset of precise topo-graphic reference measurements for better interpretation of remote sensing products,
25
BGD
10, 2705–2765, 2013Coastal
thermo-erosion in the Laptev Sea
F. G ¨unther et al.
Title Page
Abstract Introduction
Conclusions References
Tables Figures
◭ ◮
◭ ◮
Back Close
Full Screen / Esc
Printer-friendly Version Interactive Discussion
Discussion
P
a
per
|
Dis
cussion
P
a
per
|
Discussion
P
a
per
|
Discussio
n
P
a
per
|
6.7 km coastline distributed over six key sites was surveyed on Buor Khaya, and 2.1 km around Cape Mamontov Klyk. No measurements were made at Oyogos Yar. However, for this site we rely on existing literature about the Dmitry Laptev Strait region, which has been the subject of research on permafrost deposits (Wetterich et al., 2009), on the formation of subsea permafrost (Grigoriev, 2008), disappearing islands (Gavrilov
5
et al., 2003) and coastal erosion (Pizhankova and Dobrynina, 2010).
3.4 Coastline digitalization
Cliffbottom and clifftop coastlines were manually digitalized separately using ESRI®
ArcGIS™ 10 software. Delineating the same section of shoreline at different spatial
scales results in different coastline lengths and therefore also different volumes for
10
sediment flux (Lantuit et al., 2009). Depending on the complexity of the coastline and on-screen specific image contrast we used fine mapping scales from 1 : 500 to 1 : 2000 in this study. We used the Digital Shoreline Analysis System (DSAS) of Thieler et al.
(2009), available as an extension to ArcGIS™, to calculate shoreline position changes
between two dates, a method previously used for example for assessing coastal
ero-15
sion on the Beaufort Sea coast (Jones et al., 2009) as well as thermokarst lake shore erosion on the Seward Peninsula in Alaska (Jones et al., 2011). An arbitrary
base-line located offshore and following the coastline was created by buffering the oldest
seaward-most coastline, 100 m offthe coast. Every 50 m along this baseline, transects
perpendicular to the coastline were used for separate determination of cliffbottom and
20
clifftop line retreat, regarded as TA and TD, respectively (Fig. 2). With the aid of DEM’s
and all available imagery, we visually classified transects as either yedoma hill or alas basin. Coastal retreat was measured as absolute displacement distance metrics over a known period of time. Therefore, coastal erosion rate was calculated using:
r=−1·(x1−x2)
t1−t2 (2)
BGD
10, 2705–2765, 2013Coastal
thermo-erosion in the Laptev Sea
F. G ¨unther et al.
Title Page
Abstract Introduction
Conclusions References
Tables Figures
◭ ◮
◭ ◮
Back Close
Full Screen / Esc
Printer-friendly Version Interactive Discussion
Discussion
P
a
per
|
Dis
cussion
P
a
per
|
Discussion
P
a
per
|
Discussio
n
P
a
per
|
wherex1andx2are coastline positions relative to the baseline at timest1andt2. The
factor of−1 is used in order to define erosion as negative.
3.5 Uncertainty assessment
Uncertainty in planimetric coastline positions has numerous sources. To limit geomet-ric distortions, we work with a geometgeomet-rically consistent dataset of ortho-images. To
5
quantify uncertainties we consider:
1. georeferencing to an absolute frame of a coordinate system (δa),
2. relative georeferencing of two data sets to each other (δr),
3. the geometric resolution of the data set (δp) and
4. relief-induced horizontal displacement as a result of ortho-rectification (δz).
10
The sources of uncertaintyδa and δr depend on the method of image to image
geo-referencing. Data sets used for long-term measurements are referenced to a common reference data set, where the reference itself is not used for measurements. Here the
georeferencing uncertainty is the geometric mean of the RMS errorsδrandδafor each
data set. For short-term measurements we neglectδaof the initial reference data set,
15
because for relative coastline positions derived from second order derivates of data processing the respective referencing basis provides itself a coastline position. That
means, for data sets geo-referenced to each other,δr is the RMS error of the mutual
georeferencing. The uncertainty deriving from the spatial resolution of the data set is
taken to be half of the spatial resolution. δz arises out of a combination of errors in
20
topographic approximation and the tilt angle associated with oblique image data acqui-sition, where both are unique to and are calculated from the underlying DEM data set. Relief-induced error is calculated from:
BGD
10, 2705–2765, 2013Coastal
thermo-erosion in the Laptev Sea
F. G ¨unther et al.
Title Page
Abstract Introduction
Conclusions References
Tables Figures
◭ ◮
◭ ◮
Back Close
Full Screen / Esc
Printer-friendly Version Interactive Discussion
Discussion
P
a
per
|
Dis
cussion
P
a
per
|
Discussion
P
a
per
|
Discussio
n
P
a
per
|
whereαis the tilt angle of the spacecraft and∆zthe vertical accuracy of the DEM. The
cumulative uncertainty in coastline position for long-term measurements is then given by the quadratic sum:
δx=
s q
δa2·δr2
+δp2+δz2 (4)
and for short-term measurements accordingly by:
5
δx=
q
δr2+δp2+δz2 (5)
The cumulative uncertainty in coastline position is given asδx1andδx2for positions at
timest1andt2, respectively. Uncertainties for acquisition times (t) are less than 0.01 %
and are neglected. Assuming that the cumulative uncertainties in coastline position are random and independent, we calculate uncertainty in coastline position change rate
10
as:
δr=
q δx2
1+δx
2 2
t1−t2 (6)
Uncertainties in change rate calculation may also arise from the discrepancy between taking the continuous time range between two dates as a basis or the factual ice-free
period of time. This effect applies for detection of short term changes and especially
15
for comparison of those between the study sites.
3.6 Normalized Difference Thermo-erosion Index (NDTI)
Since we aim at evaluating spatial patterns of thermo-erosion, we did not quantify shore sections dominated by accumulation. Based on our multitemporal remote sensing data stable coasts included segments with extensive beaches and segments with inactive
BGD
10, 2705–2765, 2013Coastal
thermo-erosion in the Laptev Sea
F. G ¨unther et al.
Title Page
Abstract Introduction
Conclusions References
Tables Figures
◭ ◮
◭ ◮
Back Close
Full Screen / Esc
Printer-friendly Version Interactive Discussion
Discussion
P
a
per
|
Dis
cussion
P
a
per
|
Discussion
P
a
per
|
Discussio
n
P
a
per
|
cliffs that did not change within our measurement uncertainties of a particular transect.
Along segments where a cliffposition was blurred, i.e. by undisturbed vegetation cover,
we did not track cliffpositions over time.
For ice-rich permafrost coasts, we assume that movement of the top of the coastal
cliff is attributable to TD, and the movement of the cliff bottom is attributable to TA,
5
as defined above (Fig. 2). Different relative intensities of these two processes create
a large variety of coastal slope profiles (Sovershaev, 1992) and must be considered
in measurements. Here, we apply the concept of the Normalized Difference
Thermo-erosion Index (NDTI) of G ¨unther et al. (2012), that qualitatively describes the shape of coastal change and as a proxy allows for interpretation of planimetric erosion rates.
10
NDTI is calculated from:
NDTI=thermodenudation−thermoabrasion
thermodenudation+thermoabrasion =
TD−TA
TD+TA (7)
TD and TA values in the equation can be either absolute shoreline movement or rates over time. As a ratio of two numbers which have the same units, NDTI is a
dimension-less quantity. NDTI values range from−1 (only TA) to+1 (only TD). Weaknesses of the
15
NDTI approach are outlined in G ¨unther et al. (2012) and mostly comprise the missing consideration of thermo-erosional niche development.
4 Results
4.1 Coastal thermo-erosion at Mamontov Klyk
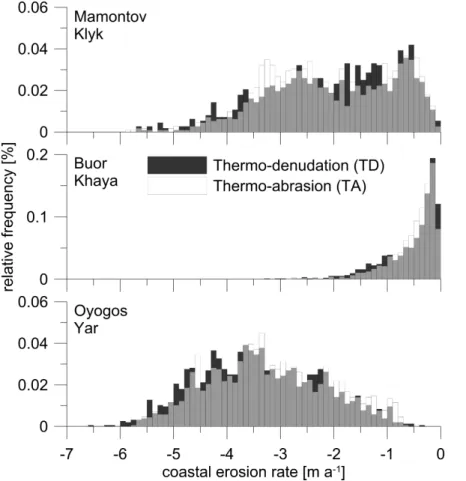
Along the western study site coast mean long-term TD and TA both were−2.1 m a−1
20
with a standard deviation of±1.2. The Mamontov Klyk coast features low, medium, and
high coastal erosion rates with nearly equal frequency (Fig. 3), except for very rapid
rates (≤3.5 m a−1). Differentiation of coastal erosion into TD and TA shows a bimodal
BGD
10, 2705–2765, 2013Coastal
thermo-erosion in the Laptev Sea
F. G ¨unther et al.
Title Page
Abstract Introduction
Conclusions References
Tables Figures
◭ ◮
◭ ◮
Back Close
Full Screen / Esc
Printer-friendly Version Interactive Discussion
Discussion
P
a
per
|
Dis
cussion
P
a
per
|
Discussion
P
a
per
|
Discussio
n
P
a
per
|
thermo-erosion along the whole coastline. Coastal erosional patterns along the Ma-montov Klyk coast exhibit a break in west-east direction (Fig. 4). From Cape Lygi in the
west, to the Urasalakh River mouth, mean TD and TA were−1 m a−1, while coastline
sections further east around capes Mamontov Klyk and Terpyai Tumus had TD and TA
values around−2.9 m a−1 and −2.5 m a−1, respectively. Numerous regional sediment
5
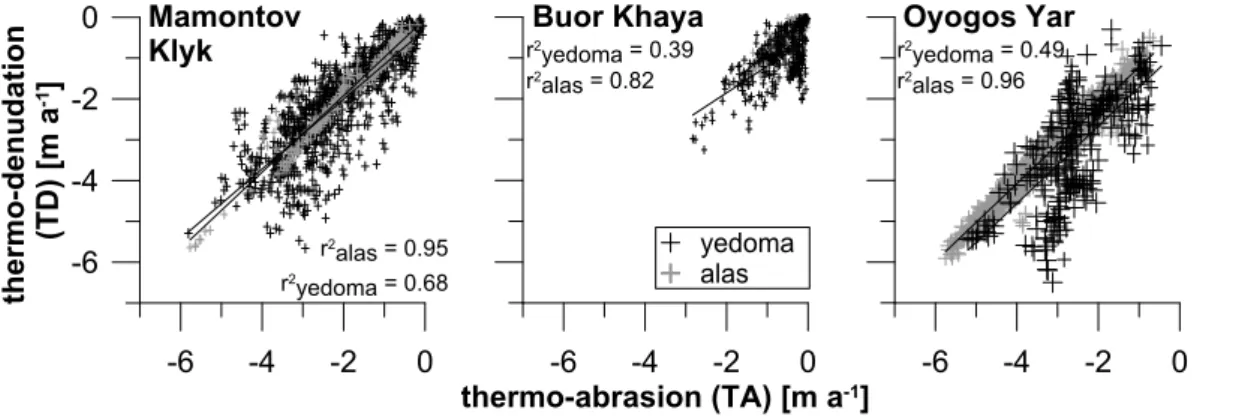
traps and non-eroding stable segments are interspersed among eroding segments of the Mamontov Klyk coast. The highest observed long-term TD rates on Mamontov Klyk
yedoma coasts were about−5.7 m a−1, which was not necessarily connected with TA
rates of the same order, while TD and TA rates for alas coasts were proportional to each other (Fig. 5). Although measurements of TD and TA rates on Mamontov Klyk
10
exhibit the strongest correlation (r2=0.68) for yedoma across all three study sites,
they lagged behind the high correlation of TD and TA along alas coasts (r2=0.95).
On the Mamontov Klyk coast, we observed the least variation in coastal erosion rates
between different coastline types, where TD and TA rates for alas are in the range of
only 10–15 % lower than for yedoma transects. NDTI data revealed long-term values
15
of 0.14 and −0.12 for TD and TA dominated coasts, respectively. Figure 6 shows an
equal distribution of NDTI for the Mamontov Klyk coast, where TA is observed slightly more frequently.
The temporal variability of coastal erosion rates along the Mamontov Klyk coast
is reflected in recently more rapid mean TD (−4.5 m a−1±1.2) and mean TA
short-20
term rates (−4.6 m a−1±1.2), compared to long-term observations of −2.8 m a−1 and
−2.9 m a−1, respectively (Fig. 7). Most outliers (≥ −21 m a−1) are to more rapid erosion
events (rather than slower) of TD in short-term measurements at capes Mamontov Klyk and Terpyai Tumus. Short-term NDTI values have a broader spectrum (Fig. 6), which
is reflected in a higher standard deviation of±0.23 compared to long-term ±0.14, but
25
BGD
10, 2705–2765, 2013Coastal
thermo-erosion in the Laptev Sea
F. G ¨unther et al.
Title Page
Abstract Introduction
Conclusions References
Tables Figures
◭ ◮
◭ ◮
Back Close
Full Screen / Esc
Printer-friendly Version Interactive Discussion
Discussion
P
a
per
|
Dis
cussion
P
a
per
|
Discussion
P
a
per
|
Discussio
n
P
a
per
|
4.2 Coastal thermo-erosion at Buor Khaya
Long-term coastal erosion along the west coast of the Buor Khaya Peninsula is
−0.55 m a−1 (±0.5) for TD and −0.5 m a−1 (±0.4) for TA. Distributions of both were
skewed towards small erosion rates (Fig. 3). At site-specific greater erosion rates
(≤1 m a−1), as well as at very slow rates, TD is observed more often than TA. On
5
Buor Khaya, long-term thermo-erosion was spatially highly variable along the coastline
(Fig. 8). A thermokarst lagoon at 71◦47′N forms the center of a weakly pronounced
elongated concave coastline section where no erosional activity was observed. Our re-sults indicate that, north of the thermokarst lagoon the coast is influenced by prevailing TA, while TD is the dominant process north and south of the Orto-Stan River mouth
10
at 71◦34′N. However, the largest contrasts in erosional patterns are not observed on
a regional scale, but rather associated with variations in coastal geomorphology. Based on the geomorphological classification of transects, alas lagged behind yedoma coasts
with−0.3 m a−1compared to−1 m a−1 for TD, and 0.4 m a−1compared to 0.7 m a−1for
TA. Figure 5 shows clustering of long-term TD and TA values at a low level, with some
15
exceptions of high TD in conjunction with high TA rates, but for yedoma coasts.
Co-herence of TD and TA for alas coasts (r2=0.82) at Buor Khaya is lowest of the three
sites, and in particular for yedoma coasts this correlation is only weak (r2=0.39). NDTI
varied widely from−0.25 to 0.95 (Fig. 6), suggesting that, in contrast to the other sites,
TD has dominated over the long-term at Buor Khaya.
20
During the short-term period, a major shift of TD and its associated variability to
more rapid erosion rates (−7.7 m a−1±4.4) was observed on Buor Khaya (Fig. 7).
How-ever TA rates were more rapid as well, but remained slower (−1.2 m a−1±0.7).
Conse-quently, short-term NDTI is highly skewed to positive values, indicating that TD has dominated at an even higher intensity here over the past few years, compared to the
25
BGD
10, 2705–2765, 2013Coastal
thermo-erosion in the Laptev Sea
F. G ¨unther et al.
Title Page
Abstract Introduction
Conclusions References
Tables Figures
◭ ◮
◭ ◮
Back Close
Full Screen / Esc
Printer-friendly Version Interactive Discussion
Discussion
P
a
per
|
Dis
cussion
P
a
per
|
Discussion
P
a
per
|
Discussio
n
P
a
per
|
4.3 Coastal thermo-erosion at Oyogos Yar
The entire Oyogos Yar coast has been continuously eroding at mean long-term TD and
TA rates of−3.4 m a−1 (±1.1) and−3.2 m a−1 (±1.1), respectively. Figure 3 shows TD
and TA equally centered around these mean rates with a wide distribution. At slower rates, TA is observed more frequently, while at more rapid than mean rates TD
pre-5
vailed. There were a few transects at yedoma coasts east of the Kondratyeva River
mouth, where rates of≤ −6.5 m a−1were observed as the most rapid long-term coastal
erosion rate across all three study sites. In general, the coastal erosion pattern of Oyo-gos Yar could be characterized as a constant increase in eastern direction of TD and TA from the west towards the middle of the study site, and then a slight decrease
to-10
wards the eastern end (Fig. 9). In contrast to the other study sites, TD values along alas
coasts of Oyogos Yar were somewhat higher than those for yedoma (−3.4 compared
to−3.2 m a−1), while TA (−3.3 m a−1 for alas) was more rapid than long-term coastal
retreat rates along yedoma coasts (−2.5 m a−1). Figure 5 shows that TD and TA along
alas coasts had a linear relationship (r2=0.96), while thermo-erosion of yedoma along
15
Oyogos Yar takes a medium position of all three study sites, resulting in a weak coupling
of TD and TA (r2=0.49). At Oyogos Yar, NDTI values are densely centered around 0,
with a narrow frequency distribution (Fig. 6). This is consistent with low mean NDTI
values of 0.06 and −0.04, for TD and TA-dominated coastal transects respectively.
However, long-term TD outpaced TA along 80 % of all yedoma transects, which is also
20
reflected in a clearly positive NDTI of 0.18.
In contrast, there is a negative shift in short-term NDTI relative to long-term NDTI, with values spread over a broader value domain. In the recent past, TA has dominated TD at 75 % of the short-term transects with a mean short-term NDTI at Oyogos Yar of
−0.27 (Fig. 6). In fact, both short-term erosion rates are more rapid with mean TD rates
25
BGD
10, 2705–2765, 2013Coastal
thermo-erosion in the Laptev Sea
F. G ¨unther et al.
Title Page
Abstract Introduction
Conclusions References
Tables Figures
◭ ◮
◭ ◮
Back Close
Full Screen / Esc
Printer-friendly Version Interactive Discussion
Discussion
P
a
per
|
Dis
cussion
P
a
per
|
Discussion
P
a
per
|
Discussio
n
P
a
per
|
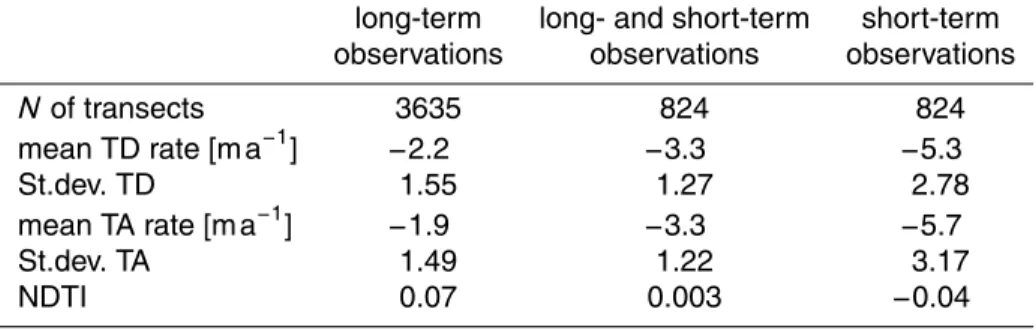
4.4 Coastal thermo-erosion in the Laptev Sea region
A total of 3635 transects along 182 km of coastline (for all three sites) were ana-lyzed and quantified on a long-term scale of 39 to 43 yr. Over a mean interval of 41.7 yr across the long-term study over all three sites, mean absolute TD was 93.3 m
(±65), while mean absolute TA was 89.3 m (±63.1). This equals a mean TD rate of
5
−2.2 m a−1(±1.55) and a mean TA rate of−2.1 m a−1(±1.49). Uncertainties were about
δr±0.14 m a−1 for TD andδr±0.12 m a−1 for TA. Table 4 lists characteristic values of
coastal thermo-erosion over time. For most transects and nearly at all intensities of
coastal retreat, TD and TA were proportional to one another (Fig. 3). Slight differences
in magnitude of TD and TA occured at small and large erosion rates. The majority
10
of outliers were due to TD rates exceeding TA. We found that mean long-term TD rates, as well as their variation, were nearly identical to TA rates for each site, when considered as a whole, although maps of thermo-erosion reveal spatially highly vari-able erosion along the studied coastline (Figs. 4, 8, and 9). Our long-term NDTI data
show mean values of 0.12 and −0.13 for coastlines tending to retreat (based on our
15
sampling) under either prevailing TD or TA, respectively. TD exceeded TA at 55 % of all transects and TA outpaced TD at 45 %, suggesting a slightly thermo-denudational coastal erosion regime. Figure 6 shows the skewed distribution of negative and positive NDTI values obtained from long-term measurements. When examined over a long time scale, including all transect data from Table 4, mean NDTI for TD and TA-dominated
20
transects was 0.05 and−0.08, respectively. Figure 5 demonstrates that TD along alas
coasts was directly linked to TA, while thermo-erosion on yedoma cliffs showed greater
variability, as evident from associated correlation coefficients between TA and TD of
r2=0.82 (yedoma) andr2=0.99 (alas), when analyzed across all three sites.
Recent erosion rates in the Laptev Sea region are at least 1.6 times more rapid than
25
the 42 yr long-term mean. For comparison purposes, both short-term TD and TA were
determined at 824 of the 3635 coastal transects, although there are differences in this
BGD
10, 2705–2765, 2013Coastal
thermo-erosion in the Laptev Sea
F. G ¨unther et al.
Title Page
Abstract Introduction
Conclusions References
Tables Figures
◭ ◮
◭ ◮
Back Close
Full Screen / Esc
Printer-friendly Version Interactive Discussion
Discussion
P
a
per
|
Dis
cussion
P
a
per
|
Discussion
P
a
per
|
Discussio
n
P
a
per
|
of short-term measurements sample is sufficient for comparison to long-term values,
recent TA was 2.4 times and recent TD 3.0 times more rapid than long-term means.
Short-term rates of erosion, whether the top or the bottom of the cliff is used as the
coastline, were more rapid (−5.3 to −5.7 m a−1 for short-term vs. −2.1 to −2.2 m a−1
for long-term) and have a greater variation (2.8 to 3.2 m a−1 vs. 1.5 to 1.6 m a−1 for
5
long-term), than long-term rates (Table 4). This is true for each site and for all three sites considered as a group (Fig. 7). When examined for all transects where both short and long-term observations were carried out, the coast is currently retreating under
prevailing TA with NDTI−0.04. This shift is primarily due to the stronger increase of TA
compared to TD (Table 4).
10
4.5 Carbon mass fluxes
Ice Complex deposits contain a significant carbon pool (Schirrmeister et al., 2011a). Strauss et al. (2012) calculate the volumetric carbon content of Ice Complex deposits by combining measured total organic-carbon (TOC) with bulk density values. The bulk density of Ice Complex sequences varies primarily due to ground-ice content rather
15
than TOC content (Strauss et al., 2012). Ice Complex deposits on Mamontov Klyk are generally ice-supersaturated, with 160–220 % by weight (Schirrmeister et al., 2008). Segregated gravimetric ground ice content on Buor Khaya is on average 93 % and 48 % by weight for Ice Complex and alas deposits, respectively (Strauss and Schirrmeister, 2011). According to Schirrmeister et al. (2011b), Ice Complex sediments at Oyogos
20
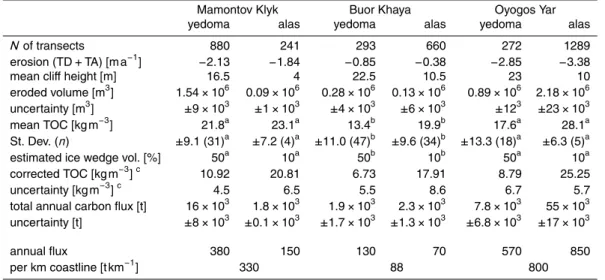
Yar are ice-supersaturated with ice contents up to 200 wt%. For the results shown in Table 5, we use volumetric ice contents of 10 % for thermokarst deposits in alas basins and 50 % for Ice Complex deposits constituting yedoma hills, and site specific organic carbon contents measured on coastal outcrops, based on Strauss (2013, personal communication) and Schirrmeister et al. (2011b). Extracting the backshore elevation
25
on the landward side of our transects, we determined mean cliffheight for each study
BGD
10, 2705–2765, 2013Coastal
thermo-erosion in the Laptev Sea
F. G ¨unther et al.
Title Page
Abstract Introduction
Conclusions References
Tables Figures
◭ ◮
◭ ◮
Back Close
Full Screen / Esc
Printer-friendly Version Interactive Discussion
Discussion
P
a
per
|
Dis
cussion
P
a
per
|
Discussion
P
a
per
|
Discussio
n
P
a
per
|
2.5-D approach to determine annual eroded volumes as:
V[m3]=1
2(TD+TA)·h·50·n (8)
where TD and TA are annual rates of clifftop and cliffbottom retreat in m a−1,his mean
cliffheight in [m], 50 the coastline length covered by one coastal transect in [m], and
nthe number of coastal transects. Table 5 shows values used to calculate carbon flux
5
rates that result from the erosion observed in this study.
We obtained a total annual carbon flux, based on a volume of eroded material of 5.1×
106±0.1×10⁶m3, of 85.6×10³±0.7×10³t for a total coastline length of 182 km. 28 % of
this total originates from the erosion of yedoma, and 72 % from alas coasts, although 50 % of the eroded volume derives from yedoma coasts. Higher TOC contents and
10
lower ice volumes explain the higher carbon flux from alas coasts. The mean annual
land-to-sea carbon flux therefore is 471±32.9 t per km of coastline per year. Current
estimate of Laptev Sea coastline length is 7500 km (Grigoriev et al., 2006). Grigoriev (2008) estimates 25 % of the Laptev Sea coast to belong to Ice Complex deposits, including alas. Based on our observations, we found that only 74 % of the studied Ice
15
Complex coasts are actually retreating. Assuming this fraction to be representative for the rest of the Ice Complex coast, eroding Ice Complex coasts are then 1400 km. As a result, total annual carbon flux released from eroding Ice Complex coasts is about
0.66×10⁶±0.05 t.
5 Discussion
20
Coastal cliffs in the Laptev Sea region are influenced by the lithology and
topogra-phy of the hinterland. Their erosion rates are determined by exposure to TD and TA, and the morphological resilience of the material cropping out at the waterline. Despite the potentially strong influence of exogeneous factors such as prevailing wind direc-tion and storminess (Solomon, 2005; Lantuit et al., 2011a) and sea-ice dynamics (Are
BGD
10, 2705–2765, 2013Coastal
thermo-erosion in the Laptev Sea
F. G ¨unther et al.
Title Page
Abstract Introduction
Conclusions References
Tables Figures
◭ ◮
◭ ◮
Back Close
Full Screen / Esc
Printer-friendly Version Interactive Discussion
Discussion
P
a
per
|
Dis
cussion
P
a
per
|
Discussion
P
a
per
|
Discussio
n
P
a
per
|
et al., 2008), we propose that endogeneous factors, such as ground ice distribution and backshore height (Rachold et al., 2000), also cause variations in coastal erosion.
5.1 Spatial variations of coastal thermo-erosion rates
One source of the heterogeneity of spatial coastal erosional patterns of our sites is the variable thermokarst relief that advancing erosion encounters (Romanovskii et al.,
5
2000). Grouping of our transects into yedoma (hills) and alas (basins) shows diff
er-ent exter-ents of permafrost degradation between sites along the coast and may help to explain this spatial heterogeneity. While yedoma segments along the Mamontov Klyk coast made up 78 % of the coastline analyzed, this value was 31 % at Buor Khaya, and along the Dmitry Laptev Strait mainland coast only 17 %. Although this estimation
10
does not include unstudied intervening sections, the proportions are generally of this magnitude. Generally, the possibility of variation in the relative intensities of TD and
TA along alas coasts is limited by low cliffheights (≤12 m) and low ground ice content
(Fig. 5). For yedoma coasts the interdependence of TD and TA is more complicated,
because environmental forcing plays a much more important role and affects TD and
15
TA differently, due to the large ground ice contents. Although intra-site specific erosion
rates varied between yedoma and alas coasts, unexpectedly this was not pronounced across our study site transect, with an increased proportion of permafrost degradation landforms from west to east, mainly because of the comparatively slow rates along the Buor Khaya coast.
20
Erosion rates along the Mamontov Klyk coastline from Cape Lygi to the Urasalakh River mouth are much slower than around the capes Mamontov Klyk and Terpyai Tu-mus. External factors like the proximity of Terpyai Tumus and Mamontov Klyk to the
warm waters of the Olenyok river may account for this difference. In contrast,
Lan-tuit et al. (2011a) find relatively slow mean coastal erosion rates of−0.6 m a−1 on the
25
BGD
10, 2705–2765, 2013Coastal
thermo-erosion in the Laptev Sea
F. G ¨unther et al.
Title Page
Abstract Introduction
Conclusions References
Tables Figures
◭ ◮
◭ ◮
Back Close
Full Screen / Esc
Printer-friendly Version Interactive Discussion
Discussion
P
a
per
|
Dis
cussion
P
a
per
|
Discussion
P
a
per
|
Discussio
n
P
a
per
|
that probably align with former thermokarst lagoons. TA between Cape Lygi and the Urasalakh River mouth is therefore less intensive because of the sheltered sector along
a concave coastline. Rapid coastal erosion rates (−3.4 m a−1) around Cape
Mamon-tov Klyk formed a steep 25 m high cliff, exposing homogeneous Ice Complex deposits
across the whole profile (see photograph, Fig. 2). However, near the navigation mark
5
on Cape Mamontov Klyk, where the backshore elevation is 33 m, Ice Complex deposits are underlain by sands with low ground ice content up to 10 m a.s.l. (Schirrmeister
et al., 2008). Here, mean long-term TA is only −1 m a−1 and TD −2 m a−1,
suggest-ing that poorly stratified coastal cliffs exhibit more complex erosional patterns, where
upper ice-rich parts may recede faster, forming thermo-terraces, often on geological
10
unconformities (Are et al., 2005).
Along the whole Buor Khaya coast north of the Omoloy River mouth, large sandy beaches up to 2.5 m a.s.l. high and 50 m wide, protect the shore face from the devel-opment of thermo-erosional niches. In addition, allochtonous gravel was found on the beach which is probably transported by the Orto-Stan and Omoloy rivers. This initially
15
fluvially supplied beach material probably gradually becomes mixed along the coast
with sediment from TD on coastal cliffs and TA in the nearshore zone. Unlike the other
two sites, the Buor Khaya coast is west facing and hence particularly affected by
pre-vailing westerly winds, so that swash dominates over backwash, resulting in positive
budgets of beach material. Slope debris at the cliffbottom along the entire coast
illus-20
trates the episodic character of coastal thermo-erosion on Buor Khaya, where simulta-neous reworking of products from TD through TA is hampered by beach morphology. Driftwood is present along much of the beach, reflecting proximity to the Lena River, but also the role of high water events in depositing material high on the beach. Based on our field observations we agree with Are (2012), who finds that the bright color of
25
BGD
10, 2705–2765, 2013Coastal
thermo-erosion in the Laptev Sea
F. G ¨unther et al.
Title Page
Abstract Introduction
Conclusions References
Tables Figures
◭ ◮
◭ ◮
Back Close
Full Screen / Esc
Printer-friendly Version Interactive Discussion
Discussion
P
a
per
|
Dis
cussion
P
a
per
|
Discussion
P
a
per
|
Discussio
n
P
a
per
|
from thawing Ice Complex) have been found in the field at sea level. Probably the lower Ice Complex boundary can be found here below sea level, favoring TA through a higher subsidence potential of the shore platform when thawing occurs, with subsequential increase and maintenance of higher wave energy when it is not compensated by sedi-ment accumulation. G ¨unther et al. (2011) report a two times steeper shoreface profile
5
across the northern coast section compared to another study site 50 km southwards. The prevailingly positive NDTI of the southern Buor Khaya coast might therefore also be
related to different angles of shoreface inclination. Shallow coastal waters in the
south-ern part of the Buor Khaya Gulf lower wave energy at the beach, hampering abrasional
material removal from the cliffbottoms. Dividing the spatial erosional pattern on Buor
10
Khaya into a TA-dominated north and TD-dominated south, the thermokarst lagoon ex-hibits a gently concave shaped inland coastline, characteristic for areas of subsidence
(Romanovskii et al., 2000). For the Buor Khaya Peninsula, Are et al. (2000) report cliff
top (TD) retreat rates on two yedoma cliffs of−1.7 m a−1 and−1.9 m a−1 over a 25 yr
period (1974–1999). Our 43 yr long-term record for these particular two sites show
15
the same values, although when examined across all eroding yedoma coasts on Buor
Khaya, TD is only−1 m a−1.
Most of the Oyogos Yar coastline erodes via formation of thermo-erosional niches and block failure along ice-wedge polygons, as is typical for flat, low-lying alas coasts.
According to Are et al. (2002), the morphology of coastal cliffs composed of yedoma
20
hills largely depends on high ice contents. The yedoma hills of Oyogos Yar adjacent to the Kondratyeva River mouth simply thaw away under the influence of TD (Are et al., 2005), leaving not even baidzharakhs and resulting in large positive NDTI val-ues (Fig. 9). Additionally, the lower Ice Complex boundary is a.s.l. and TA may be slower due to the low ground ice content in underlying layers. Kaplina (2011) report
25