www.biogeosciences.net/11/6573/2014/ doi:10.5194/bg-11-6573-2014
© Author(s) 2014. CC Attribution 3.0 License.
Estimated stocks of circumpolar permafrost carbon with quantified
uncertainty ranges and identified data gaps
G. Hugelius1, J. Strauss2, S. Zubrzycki3, J. W. Harden4, E. A. G. Schuur5,6,7, C.-L. Ping8, L. Schirrmeister2, G. Grosse2, G. J. Michaelson8, C. D. Koven9, J. A. O’Donnell10, B. Elberling11, U. Mishra12, P. Camill13, Z. Yu14, J. Palmtag1, and P. Kuhry1
1Department of Physical Geography and Quaternary Geology, Stockholm University, 106 91 Stockholm, Sweden 2Alfred Wegener Institute Helmholtz Centre for Polar and Marine Research, Periglacial Research Unit Potsdam,
Telegrafenberg A43, 14473 Potsdam, Germany
3Institute of Soil Science, Center for Earth System Research and Sustainability (CEN), Universität Hamburg, Allende-Platz 2,
20146 Hamburg, Germany
4U.S. Geological Survey, Menlo Park, CA 94025, USA
5Department of Biology, University of Florida, Gainesville, FL 32611, USA
6Center for Ecosystem Science & Society, Northern Arizona University, Flagstaff, AZ 86001, USA 7Biological Sciences, Northern Arizona University, Flagstaff, AZ 86001, USA
8Palmer Research Center, University of Alaska Fairbanks, 1509 S. Georgeson Drive, Palmer, AK 99645, USA 9Lawrence Berkeley National Lab, Berkeley, CA, USA
10Arctic Network, National Park Service, 4175 Geist Rd. Fairbanks, AK 99709, USA
11CENPERM (Center for Permafrost), Department of Geosciences and Natural Resource Management,
University of Copenhagen, Øster Voldgade 10, 1350 Copenhagen, Denmark
12Environmental Science Division, Argonne National Laboratory, 9700 South Cass Avenue, Argonne, IL 60439, USA 13Earth and Oceanographic Science Department and Environmental Studies Program, Bowdoin College, Brunswick,
ME 04011, USA
14Department of Earth and Environmental Sciences, Lehigh University, 1 West Packer Avenue, Bethlehem, PA 18015, USA
Correspondence to:G. Hugelius ([email protected])
Received: 17 March 2014 – Published in Biogeosciences Discuss.: 26 March 2014
Revised: 26 September 2014 – Accepted: 30 September 2014 – Published: 1 December 2014
Abstract. Soils and other unconsolidated deposits in the northern circumpolar permafrost region store large amounts of soil organic carbon (SOC). This SOC is potentially vul-nerable to remobilization following soil warming and per-mafrost thaw, but SOC stock estimates were poorly con-strained and quantitative error estimates were lacking. This study presents revised estimates of permafrost SOC stocks, including quantitative uncertainty estimates, in the 0–3 m depth range in soils as well as for sediments deeper than 3 m in deltaic deposits of major rivers and in the Yedoma region of Siberia and Alaska. Revised estimates are based on sig-nificantly larger databases compared to previous studies. De-spite this there is evidence of significant remaining regional data gaps. Estimates remain particularly poorly constrained
soils in deltaic alluvium of major Arctic rivers is estimated as 91±52 Pg. In the Yedoma region, estimated SOC stocks below 3 m depth are 181±54 Pg, of which 74±20 Pg is stored in intact Yedoma (late Pleistocene ice- and organic-rich silty sediments) with the remainder in refrozen thermokarst de-posits. Total estimated SOC storage for the permafrost re-gion is ∼1300 Pg with an uncertainty range of ∼1100 to 1500 Pg. Of this, ∼500 Pg is in non-permafrost soils, sea-sonally thawed in the active layer or in deeper taliks, while
∼800 Pg is perennially frozen. This represents a substantial
∼300 Pg lowering of the estimated perennially frozen SOC stock compared to previous estimates.
1 Introduction
As permafrost warming and thaw occurs, large pools of soil organic carbon (SOC) that were previously protected by sub-zero temperatures may become available for mineralization, leading to increased greenhouse gas fluxes to the atmosphere (Schuur et al., 2008). Incorporating permafrost-related soil processes into Earth System Models (ESMs) has demon-strated that permafrost C and associated climate feedbacks have been underestimated in previous modelling studies and that high-latitude soil processes may further accelerate global warming (Koven et al., 2011; Schaefer et al., 2011; Burke et al., 2012a, b; Schneider von Deimling et al., 2012).
At high latitudes, low soil temperatures and poor soil drainage have reduced decomposition rates of soil organic matter (SOM) (Davidson and Janssens, 2006). Over mil-lennial timescales, processes such as cryoturbation, accu-mulation of peat and repeated deposition and stabilization of organic-rich material (alluvium, proluvium, colluvium or wind-blown deposits) have led to accumulation of permafrost SOC in mineral soils, peat deposits (organic soils), silty late-Pleistocene syngenetic organic- and ice-rich deposits (Yedoma), deltaic deposits and other unconsolidated Quater-nary deposits (e.g. Ping et al., 1998; Tarnocai and Stolbovoy, 2006; Schirrmeister et al., 2011a, b; Ping et al., 2011; Strauss et al., 2012). Using the Northern Circumpolar Soil Carbon Database (NCSCD), a digital soil map database linked to ex-tensive field-based SOC storage data, Tarnocai et al. (2009) estimated the 0–0.3 and 0–1 m SOC stocks in the northern circumpolar permafrost region to be 191 and 496 Pg, respec-tively. Based on limited field data, but in recognition of the key pedogenic processes that transport C to depth in per-mafrost soils, Tarnocai et al. (2009) provided a first-order SOC mass estimate for 0–3 m soil depth of 1024 Pg. This 0–3 m estimate was based on 46 pedons in Canada and was not included into the spatially distributed NCSCD. Hugelius et al. (2013a) recently compiled an updated pedon data set for soils in the northern circumpolar permafrost region extending down to 2 and 3 m depths (n=524 and 356, respectively), which were incorporated into an updated NCSCDv2 which is
now available to improve characterization of the 1–3 m SOC stocks.
A first-order estimate of SOC stocks in Yedoma terrain of 450 Pg (Zimov et al., 2006) was calculated from a small-scale map of Yedoma extent (Romanovskii, 1993), using general-ized data of Yedoma deposit thickness, massive ice content, organic C% and bulk density. This estimate was recalculated to 407 Pg to avoid double counting of SOC stocks in the top 3 m of deposits when included into a summative circumpolar estimate of Tarnocai et al. (2009). Schirrmeister et al. (2011a) suggested that Yedoma SOC stocks may be 25–50% lower than previously reported because of overestimated mean bulk density values in Yedoma deposits. Using newly compiled data on deposit thickness, spatial extent of thermokarst, bulk density, segregated ice content and massive wedge-ice con-tent, Strauss et al. (2013) provide an updated estimate of 211 Pg SOC (with an uncertainty range from 58 to 371 Pg) stored in permafrost sediments of the Yedoma region (includ-ing intact Yedoma and refrozen thermokarst sediment with Holocene cover deposits of Siberia and Alaska, not including active layer, thawed sediments underlying lakes and rivers or areas covered by deltaic or fluvial sediments).
Based on field data from the Mackenzie River delta, Tarnocai et al. (2009) estimated SOC storage in the deltaic deposits of seven selected Arctic river deltas to be 241 Pg. Since this first-order estimate demonstrated the potential importance of deltaic permafrost deposits, new knowledge has become available regarding deeper SOC stores in Arc-tic deltas. Field-studies from the Alaskan Beaufort Sea coast (Ping et al., 2011) and the Siberian Lena River delta (Schirrmeister et al., 2011b; Zubrzycki et al., 2013) provide new information on SOC stocks in near-surface deltaic de-posits. There is also additional information regarding the spatial extent and depth of deltaic deposits (Walker, 1998; Aylsworth et al., 2000; S. L. Smith et al., 2005; Johnston and Brown, 1965; Taylor et al., 1996; Schwamborn et al., 2002). Tarnocai et al. (2009) provided a total estimate of cir-cumpolar SOC storage in soils (0–3 m depth), Yedoma and deltaic deposits of 1672 Pg, of which 1466 Pg is stored in per-mafrost terrain. This is about twice as much C as what is cur-rently stored in the atmosphere (Houghton, 2007). While it is recognized that this pool of SOC stored in permafrost regions is large and potentially vulnerable to remobilization follow-ing permafrost thaw, estimates are poorly constrained and quantitative error estimates are lacking (Mishra et al., 2013). Tarnocai et al. (2009) assigned qualitative levels of confi-dence for different components of the permafrost region SOC stock estimate. In recognition of the limited field observa-tions on which estimates are based, estimates for SOC stocks stored in deep soil (1–3 m), Yedoma and deltaic deposits were assigned the lowest degree of confidence.
and Yedoma region deposits. Compared to previous studies (Tarnocai et al., 2009; Zimov et al., 2006), the number of in-dividual field sites or pedons available for calculations has increased by a factor of 11 for 1–2 m soils, a factor of 8 for 2–3 m soils and deltaic alluvium and a factor of 5 for Yedoma region deposits. The first ever spatially distributed, quantified estimates for the 0–3 m depth range in soils are up-scaled based on regional soil maps in the NCSCDv2. These estimates are calculated are calculated by separating physio-graphic regions of thick and thin sedimentary overburden, corresponding to lowland and highland areas, respectively (Heginbottom et al., 1993; Brown et al., 2002). In recogni-tion of limited soil development in some high-latitude re-gions (Horwath Burnham and Sletten, 2010), SOC stocks in thin soils of the High Arctic bioclimatic zone are upscaled separately. A revised estimate of SOC stocks in deltaic de-posits is based on new field data and updated information to calculate the spatial extent and depth of deltaic alluvium. For the Yedoma region, the estimate of Strauss et al. (2013) is recalculated by implementing an updated methodology for estimating uncertainty ranges and removing spatial overlap with SOC stored in surface soils. The different components of the permafrost region SOC stocks are summarized and presented together with quantitative uncertainty estimates. A primary goal of this study is to quantify uncertainties associ-ated with permafrost SOC stocks estimates, and to improve understanding of the permafrost SOC pool size and distri-bution for model simulations of the permafrost–carbon feed-back on the climate system.
2 Methods
Below we present a summary of methods used to obtain our estimates. More detailed descriptions of methods, including the data sets used for different calculations, are available in the online supplemental material.
2.1 Calculating 0–3 m SOC stocks
Calculation of SOC stocks (absolute amount of SOC reported as either kg or Pg SOC) based on thematic soil maps is done in three steps (Hugelius, 2012). First, the SOC storage (SOC amount per area unit, given in kg C m−2) for individual
pe-dons (a pedon is a three-dimensional body of soil as sampled, described and classified in soil studies) is calculated to the se-lected reference depths. Second, the pedon data are grouped into suitable thematic upscaling classes, and mean SOC stor-age (with confidence intervals) for each class and reference depth is calculated. Finally, the mean SOC storage of each class is multiplied with estimates of the areal coverage of thematic upscaling classes to calculate total SOC stocks (in-cluding uncertainty ranges) for different classes and refer-ence depths.
For this study, SOC stocks were estimated separately for the 0–0.3, 0–1, 1–2 and 2–3 m depth ranges using the NC-SCDv2. The NCSCDv2 is a polygon-based digital database adapted for use in Geographic Information Systems (GIS), which has been compiled from harmonized national or re-gional soil classification maps. Map data on soil coverage have been linked to pedon data with SOC storage from the northern permafrost regions to estimate geographically up-scaled total SOC stocks (Hugelius et al., 2013b).
The SOC stocks estimates for the 0–0.3 and 0–1 m depth ranges were calculated separately in each NCSCDv2-region (i.e. Alaska, Canada, Contiguous USA, Europe, Greenland, Iceland, Kazakhstan, Mongolia, Russia and Svalbard) fol-lowing the methodology of Tarnocai et al. (2009) but using the revised and gap-filled data sets described by Hugelius et al. (2013a, b). Separate SOC stock estimates were calcu-lated for the High Arctic region. Outside the High Arctic, estimates of 1–3 m SOC stocks are based on a geographical subdivision following physiography. This spatial subdivision was chosen because it is expected to reflect different impor-tant pedogenic processes occurring across the studied region. Pedons and mapped soil areas in the northern circumpolar permafrost region were separated following physiographic regions of thick and thin sedimentary overburden (Fig. 1; see Heginbottom et al., 1993). Areas of thick sedimentary over-burden are described as “areas of lowlands, highlands and intra- and inter-montane depressions characterised by thick overburden, wherein ground ice is expected to be generally fairly extensive” (Heginbottom et al., 1993). Areas of thin sedimentary overburden are described as “areas of moun-tains, highlands, and plateaus characterised by thin overbur-den and exposed bedrock, where generally lesser amounts of ground ice are expected to occur” (Heginbottom et al., 1993). The upscaled SOC stock estimates for the 0–0.3 and 0–1 m depth ranges were calculated separately for each soil order, following USDA Soil Taxonomy (Soil Survey Staff, 1999), within the separate NCSCDv2-regions. Permafrost-affected soils (Gelisol soil order) are further differentiated for upscal-ing into its three suborders: Turbels (cryoturbated permafrost soils), Histels (organic permafrost soils) and Orthels (non-cryoturbated permafrost-affected mineral soils).
For the 1–2 and 2–3 m depth ranges, a reduced the-matic resolution with aggregated upscaling classes was used. Stocks were calculated separately for the Turbel, Histel and Orthel suborders of the Gelisol soil order and for the Histosol soils order (organic soils without permafrost). All remaining soil orders were grouped as non-permafrost mineral soils.
The SOC storage (kg C m−2) values for the 0–0.3 and
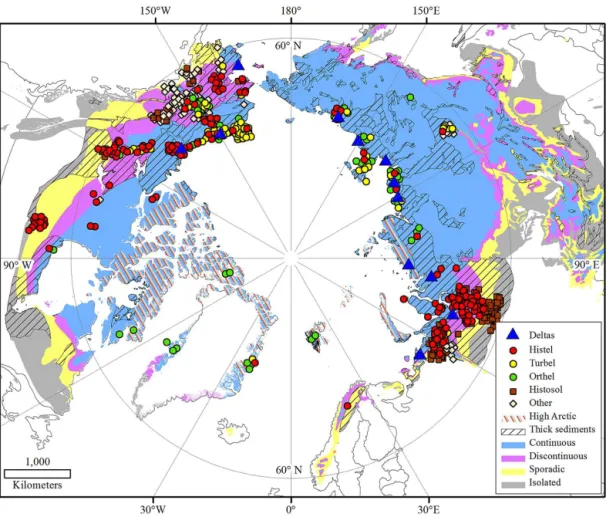
Figure 1. Geographical distribution of regions with thick sedimentary overburden and permafrost zonation in the northern circumpolar permafrost region (Brown et al., 2002). Map shows locations of the included Arctic river deltas as well as pedons with data in the 0–3 m depth range (pedon data set 2), grouped according to NCSCDv2 upscaling classes. Exact pedon locations have been manipulated for cartographic representation; projection: Azimuthal Equidistant, datum: WGS84. Adapted from Hugelius et al. (2013a).
includingdetailsregarding which soil orders were supple-mented with information from Batjes (1996), can be found in the Supplementary Table S1 of the supplementary on-line materials. For further details regarding the NCSCD GIS database and the methods for pedon sampling and calculation of 0–0.3 and 0–1 m SOC stocks, see Hugelius et al. (2013b). For the deeper soil layers (1–2 and 2–3 m depth ranges) a newly compiled pedon database which has been integrated into the NCSCDv2 was used (Fig. 1; Table 1). From this pe-don compilation we included 518 pepe-dons that extend down to 2 m and 351 pedons that extend down to 3 m (this pedon data set is hereafter called pedon data set 2). Table 1 summarizes the number of individual deep pedons available from differ-ent geographical regions and areas of thick/thin sedimdiffer-entary overburden in pedon data set 2. More detailed information regarding this pedon data set can be found in Table S1 of the supplementary online materials.
2.2 Calculating deltaic SOC stocks
Deltaic SOC stocks in this study are estimated following the to a methodology that builds on that of Tarnocai et al. (2009) who used data on the mean depth of alluvium, mean delta lake coverage/depth and mean alluvium SOC density (kg C m−3) from the Mackenzie River delta (Canada)
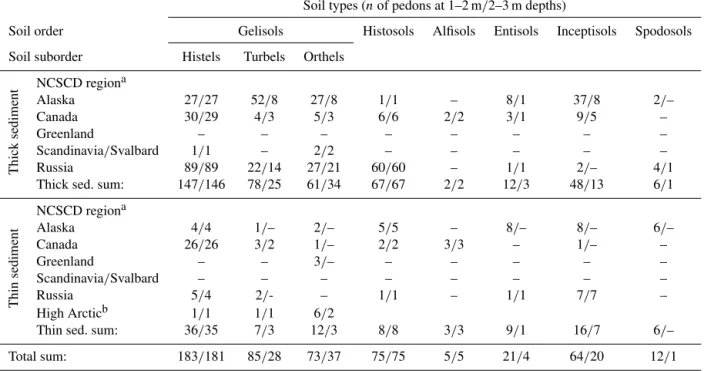
Table 1.Summary of number of available pedons (with data below 1 m) in areas with thick and thin sedimentary overburden for soil taxa from different regions (regional subdivision following NCSCD database structure) in the northern circumpolar region.
Soil types (nof pedons at 1–2 m/2–3 m depths)
Soil order Gelisols Histosols Alfisols Entisols Inceptisols Spodosols
Soil suborder Histels Turbels Orthels
Thick
sediment
NCSCD regiona
Alaska 27/27 52/8 27/8 1/1 – 8/1 37/8 2/–
Canada 30/29 4/3 5/3 6/6 2/2 3/1 9/5 –
Greenland – – – – – – – –
Scandinavia/Svalbard 1/1 – 2/2 – – – – – Russia 89/89 22/14 27/21 60/60 – 1/1 2/– 4/1 Thick sed. sum: 147/146 78/25 61/34 67/67 2/2 12/3 48/13 6/1
Thin
sediment
NCSCD regiona
Alaska 4/4 1/– 2/– 5/5 – 8/– 8/– 6/–
Canada 26/26 3/2 1/– 2/2 3/3 – 1/– –
Greenland – – 3/– – – – – –
Scandinavia/Svalbard – – – – – – – –
Russia 5/4 2/- – 1/1 – 1/1 7/7 –
High Arcticb 1/1 1/1 6/2
Thin sed. sum: 36/35 7/3 12/3 8/8 3/3 9/1 16/7 6/–
Total sum: 183/181 85/28 73/37 75/75 5/5 21/4 64/20 12/1
aThere are no pedons in the NCSCD regions: Contiguous USA, Mongolia, Iceland or Kazakhstan.
bA total of eight Gelisol pedons from thin sediment regions were used separately to upscale soils of High Arctic tundra soils (five from Greenland and three from Canada).
estimates for this region. When the total volume of allu-vium was calculated, the total SOC stock of each delta was estimated using field data of mean alluvium SOC density (kg C m−3). In all cases, mean values from other deltas were
used when there was no direct data for any specific variable in a delta. Table 5 summarizes all input data used to estimate deltaic alluvium volume and SOC stocks. More detailed de-scriptions of calculations are available in the Supplement.
2.3 Calculating permafrost SOC stocks in the Yedoma region
For the purpose of these calculations, the Yedoma region was subdivided into areas of intact Yedoma deposits (late Pleistocene ice- and organic-rich silty sediments) and per-mafrost deposits formed in thaw-lake basins (generalized as thermokarst deposits) which may be either mineral soils, lake sediment or peat deposits. Volumes of unfrozen sediment un-derlying water bodies and areas covered by deltaic or flu-vial sediments were excluded. Twenty-two Yedoma and ten thermokarst deposit profiles were studied and sampled from river or coastal bluffs exposed by rapid thaw and erosion (Strauss et al., 2013). Total SOC stocks in intact Yedoma and perennially frozen thermokarst deposits below 3 m are cal-culated based on individual observations of: deposit thick-ness (n=20 and 8, respectively), organic C content (weight %, n=682 and 219), bulk density (n=428 and 117), and
wedge-ice content (volume %,n=10 and 6). The upper 3 m of sediment were excluded to avoid spatial overlap with esti-mates of storage in 0–3 m soils based on the NCSCDv2. For details regarding calculations of the spatial extent of differ-ent sedimdiffer-ents, data collection and spatial distribution of field observations see Strauss et al. (2013). Because of high inher-ent (spatial) heterogeneity and non-normal distributed input parameters, the SOC stock calculations are based on boot-strapping techniques using resampled observed values (simi-lar to Strauss et al., 2013). The applied methodology differed from that of Strauss et al. (2013) in several ways. The num-ber of resampling steps for each parameter was connected to the original number of observations of the different parame-ters deposit thickness, C%, bulk density, and wedge-ice. We did 10 000 separate bootstrapping runs and the total mean SOC stock size estimate was derived afterward for every bootstrapping run. This resulted in an overall mean value cal-culated from 10 000 observation-based bootstrapping means. Because organic C% and bulk density of individual sediment samples are correlated, paired values were used in the resam-pling process. Computations were performed using R soft-ware (boot package) (R core team, 2012).
2.4 Estimating SOC stock uncertainties
an empirical connection between map classes and the inves-tigated variable can be established through point sampling (Hugelius, 2012). Sources of upscaling uncertainty in such thematic mean upscaling can be divided into database un-certainty arising from insufficient field-data representation to describe natural soil variability within an upscaling class and spatial uncertainties caused by areal misrepresentation of classes in the upscaling map (Hugelius, 2012). Database uncertainty can be estimated based on the standard error (re-flects variance and number of independent replicates) and the relative contribution towards the total stock of each upscal-ing class. This procedure assumes that the available sample is sufficiently replicated to accurately reflect the natural vari-ability within a class. If this is not the case, the uncertainty arising from this so-called representation error can be esti-mated. Spatial errors in individual upscaling classes can be assessed if dedicated, comprehensive ground truth data sets to assess map accuracy are available, which is not the case in this study. All uncertainty estimates in this study assume that the spatial extent of different soil orders, deltas and the Yedoma region within the northern circumpolar permafrost region are correctly mapped.
Calculations of uncertainty ranges for the different depth ranges and regions of 0–3 m soil SOC stocks and deltaic al-luvium are based on the methodology described by Hugelius (2012), modified to also include the estimated representa-tion error in those cases where estimates for one region were based on small statistical samples. The uncertainty ranges are 95 % confidence interval (CI) ranges calculated from the standard deviation (SD) and proportional areal/volumetric contribution of each upscaling class. The relative contribu-tion to total uncertainty by individual soil classes is de-fined as the proportion of combined SD and proportional areal/volumetric contribution of that class.
The uncertainty ranges for Yedoma region deposits are the 5 and 95th percentiles of bootstrapped observations (based on the methodology of Strauss et al., 2013). These ranges are considered equivalent to 95 % CI ranges. The uncertainty ranges of the different SOC stock components are combined using a formula for additive error propagation of covarying variables (Roddick, 1987). More detailed descriptions of all calculations, including formulas and a schematic overview of uncertainty calculations (Supplementary Fig. S1), are avail-able in the Supplement.
2.5 Statistical tests of significance
Because different pedon data sets were used to calculate 0–1 m SOC stocks (pedon data set 1) and 1–3 m SOC stocks (pedon data set 2), there was a concern that these two data sets may not accurately reflect the same statistical popu-lations (Hugelius, 2012). Therefore, the circumpolar mean 0–1 m SOC storage (kg C m−2) between the two databases
was compared using Student’sttest withα=0.05 (test from parameters, software PAST v2.17b; Hammer et al., 2001).
These tests were performed at the reduced thematic resolu-tion used to calculate deeper SOC stocks. Because the in-dividual pedon observations and coordinates are no longer available for pedon data set 1, the tests could not be done sep-arately for the different physiographic regions (mean, stan-dard deviation stanstan-dard deviation and the number of individ-ual observations in pedon data set 1 pedon data set 1 for the separate regions are not known).
For each soil upscaling class (at reduced thematic resolu-tion), SOC storage (kg C m−2) in the individual depth ranges
(0–1, 1–2 and 2–3 m) were also compared across physio-graphic regions of thick and thin sedimentary overburden using a two-tailed Student’st test withα=0.05 (software PAST v2.17b).
3 Results
3.1 Mean 0–3 m SOC storage and depth distribution in soil classes across regions
3.1.1 Mean pedon SOC storage used for upscaling Table 2 summarizes the SOC storage (kg C m−2) and
uncer-tainty ranges (95 % CI) for the different soil classes used in upscaling. More detailed information regarding the databases used to calculate mean SOC storage of different soil upscal-ing classes in all depth ranges can be found in Table S1 of the Supplement. In general, the highest mean SOC storages are in the organic soils (Histosols and Histels), followed by Turbels, Orthels and non-permafrost mineral soils. Organic soils and permafrost-affected soils also store more SOC be-low 1 m depth (except Orthels in regions of thin sediment overburden). Storage of SOC in poorly developed permafrost soils of the High Arctic is considerably lower than other per-mafrost soils. Estimates for soils of the High Arctic and phys-iographic regions of thin sedimentary overburden are associ-ated with wide uncertainty ranges.
The mean SOC storage estimates used for upscaling (Table 2) are based on two different pedon data sets (pedon data set 1 above 1 m depth and data set 2 for deeper soils). However, both data sets have data for the top metre of soil. These two pedon data sets represent independent samples for estimating SOC storage (kg C m−2) in the top metre of soils
in the northern circumpolar permafrost region. If both data sets are assumed to be unbiased representative samples of SOC storage, they should provide similar estimates. There-fore, inter-comparisons of these estimates are informative. Comparing the 0–1 m SOC storage (kg C m−2) values from
pedon data set 2 (t test, p <0.05). Histosols have signifi-cantly lower SOC in pedon data set 2 (ttest,p <0.05).
3.1.2 Comparison of SOC storage across regions and depths
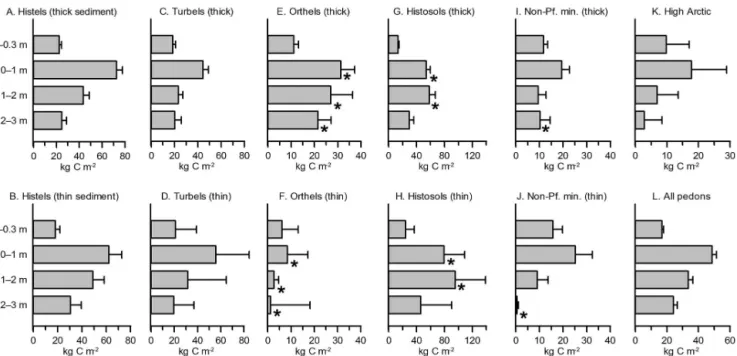
Pedon data set 1 has no data below 1 m depth and for con-sistency in comparisons only pedon data set 2 is referred to regarding all descriptions or comparisons of SOC stor-age across regions or depth distribution of SOC within soil classes. The vertical distribution of SOC through the pro-file varies greatly between soil orders (Fig. 2). In most soil classes the upper 1 m of soil stores more SOC than the deeper depth ranges but for Histosols, the highest estimated SOC storage is in the 1–2 m depth range (Fig. 2g and h). In Or-thels in regions of thin sediment overburden, non-permafrost mineral soils and soils of the High Arctic, a large fraction (30–50%) of total 0–3 m SOC is stored in the top-soil (up-per 0.3 m; Fig. 2e, i, j and k). Outside of the High Arctic, organic soils, Turbels and Orthels in thick sediment regions store∼50 % or more of SOC below 1 m depth.
Statistical comparison of SOC storage between physio-graphic regions of thick and thin sediment overburden shows significantly higher SOC in thick sediment regions across all depth ranges for Orthels and for non-permafrost mineral soils in 2–3 m depth (Fig. 2e, f, i and j;ttest,p <0.05). At depths down to 2 m, Histosol SOC storage is significantly higher in thin sediment regions (Fig. 2g and h; t test, p <0.05). Other soil upscaling classes show no significant differences between physiographic regions.
3.2 Upscaled soil area and SOC stocks across regions The estimated soil area of the northern circumpolar permafrost region is 17.8×10⁶km2 (excluding exposed bedrock, glaciers and ice-sheets and water bodies). This also includes the full areal extent of regions where permafrost coverage is non-continuous so that a significant fraction of the area is not in permafrost terrain. Physiographic regions with thick sedimentary overburden occupy 35 % and re-gions with thin sedimentary overburden 65 % of the soil area (Table 3). The North American continent (including Green-land) accounts for 39 % of the soil area and Eurasia for 61 % of the soil area.
Total estimated northern circumpolar permafrost region SOC stocks (±95 % CI) are 217±12 Pg for the 0–0.3 m depth and 472±27 Pg for the 0–1 m depth (Table 3). Estimated deeper SOC stocks are 355±81 Pg for the 1–2 m depth and 207±42 Pg for the 2–3 m depth (Table 2). The summarized SOC stocks for 0–2 m depth are 827±108 Pg and for 0–3 m depth are 1035±150 Pg.
Thick sediment areas have lower total SOC stocks than thin sediment areas in the 0–0.3, 0–1 and 1–2 m depth ranges (corresponding to a significantly smaller areal coverage). However, in the 2–3 m depth range the total SOC stocks are
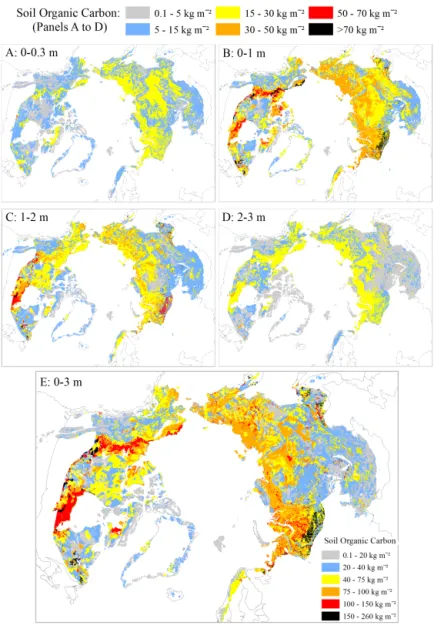
higher in areas of thick sediments, reflecting the very low es-timated SOC contents below 2 m depth for some soil classes which have significant areal extent in thin sediment regions (i.e. Orthels and non-permafrost mineral soils; Fig. 2 and Table S1). There is a clear trend of wider uncertainty ranges in thin sediment regions, caused by variable mean SOC stor-age (Fig. 2) and a low number of available pedons for this very large region (Table 1). Maps of estimated SOC content (Fig. 3) show clear differences in estimated SOC stocks, with higher numbers in thick sediment regions than in the thin sed-iment regions.
The High Arctic region occupies 6 % of the northern cir-cumpolar permafrost region and stores an estimated 34±
16 Pg SOC in the 0–3 m depth range (3 % of total permafrost region 0–3 m SOC stocks). Most of this is in the upper metre of the soil with 10±3 and 24±8 Pg SOC in the 0–0.3 and 0–1 m depth ranges, respectively. Estimates of SOC stocks in deeper soil layers in the High Arctic are lower, 7±5 and 3±3 Pg SOC in the 1–2 and 2–3 m depth ranges, respectively. Permafrost-affected soils dominate SOC storage in the permafrost region with 70 % of total stocks (Table 4). Turbels outside of the High Arctic region, which account for 31 % of the soil area, store 41 % of total 0–3 m SOC stocks (Table 4), and is the single dominant upscaling class across all depth ranges and regions (Table S1). In the 1–2 m depth range, the organic soils (Histels and Histosols) contribute more to the total SOC stocks, due to higher mean SOC storage in that depth interval (Fig. 2). Histosols are especially impor-tant in regions of thick sedimentary overburden where the mean depth of peat deposits (data not shown) and mean SOC stocks are greater. Outside of continuous permafrost cover-gae, non-permafrost mineral soils cover 38 % of the northern circumpolar permafrost region, but accounts for only 15 % of the SOC mass.
Figure 2.Mean SOC storage (kg C m−2) with error bars showing 95 % confidence intervals of the mean, for different soil upscaling classes calculated using pedon data set 2. Panels(a)to(j)show SOC storage estimates for the different depth ranges in areas of thick and thin sedimentary overburden, respectively. Panels(k)and(j) show mean SOC storage for the High Arctic region and for all pedons grouped together. Asterisks mark depth intervals in soil upscaling classes where SOC storage is significantly different from the equivalent interval in the other region (ttest,p <0.05).
Table 2.Summary of mean SOC storage in different depth ranges of the soil upscaling classes for the upscaling regions applied in this study. Numbers for soils above 1 m depth are based on pedon data set 1 while numbers for soils from 1–3 m depth are based on pedon data set 2. Note that for soils below 1 m depth all non-permafrost mineral soils (non-pf. min.) are combined in one upscaling class. Per our definition of High Arctic soils, these soils are not found in physiographic regions with thick sedimentary overburden.
Region: Circumpolar Thick sediment Thin sediment
Depth range: 0–0.3 m 0–1 m 1–2 m 2–3 m 1–2 m 2–3 m Soil class: SOC storage±95 % CI (kg C m−2)
Alfisols 4.7±0.4 7.9±0.7 Entisols 1.1±0.8 7.7±1.7 Inceptisols 4.9±0.2 9.5±0.4 Spodosols 11.7±2 21.3±5 Natric soils 2.9±0.6 10.6±2.2 Aquic soils 9.2±0.4 16.8±0.7 Vertisols 5.7±2.1 13.5±4.9 Mollisols 6.4±0.4 12.2±0.7 Aridisols 1.6±1.8 1.7±5.4 Andisols 11.4±0.4 25.4±0.2 Ultisols 5.1±1.2 9.4±3.2
Figure 3.Map of estimated 0–3 m SOC storage (kg C m−2) in the northern circumpolar permafrost region. Panels show 0–0.3 m and 0–1 m
SOC calculated subdivided following NCSCD regions while 1–2 m and 2–3 m SOC is calculated subdivided for areas of thick thin sedimen-tary overburden. Projection: Azimuthal Equidistant, datum: WGS84.
Table 3.Summary of estimated soil area and SOC stocks (with±95 % CI where available) subdivided into physiographic regions of thick and thin sedimentary overburden (following Brown et al., 2002), the High Arctic region and summarized for the northern circumpolar permafrost region.
Thick sediments Thin sediments High Arctic region Circumpolar Soil area (km2): 6.2×10⁶(35 %) 10.6×10⁶(59 %) 1.0×10⁶(6 %) 17.8×10⁶
SOC stocks (Pg):
0–0.3 m 90 117 10±3 217±12
0–1 m 213 235 24±8 472±27
1–2 m 161±14 187±79 7±5 355±81 2–3 m 119±16 86±39 3±3 207±42
0–2 m 374 422 31±13 827±108
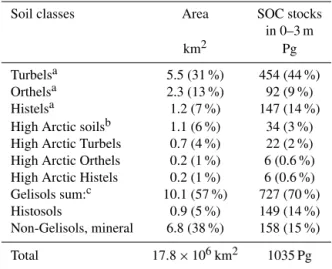
Table 4.Summary of areal coverage (% of total permafrost region coverage) and total estimated SOC stocks (with % of total) of soil upscaling classes with reduced thematic resolution.
Soil classes Area SOC stocks in 0–3 m km2 Pg
Turbelsa 5.5 (31 %) 454 (44 %) Orthelsa 2.3 (13 %) 92 (9 %) Histelsa 1.2 (7 %) 147 (14 %) High Arctic soilsb 1.1 (6 %) 34 (3 %) High Arctic Turbels 0.7 (4 %) 22 (2 %) High Arctic Orthels 0.2 (1 %) 6 (0.6 %) High Arctic Histels 0.2 (1 %) 6 (0.6 %) Gelisols sum:c 10.1 (57 %) 727 (70 %) Histosols 0.9 (5 %) 149 (14 %) Non-Gelisols, mineral 6.8 (38 %) 158 (15 %)
Total 17.8×10⁶km2 1035 Pg
aApplies to Gelisol suborders outside of the High Arctic region. bA very small fraction (<1%) of the High Arctic is mapped as
non-Gelisols but these soils are equally subdivided to Gelisol suborders here. cNote that this class is not used in upscaling and is included here for summative purposes only.
3.3 SOC stocks below 3 m depth in deltaic deposits Table 5 summarizes data sources, the different parameters used to estimate the volume and SOC content of deltaic al-luvium and calculated results for the individual deltas. The total estimated area of major river deltas in the northern cir-cumpolar permafrost region is 75 800 km2. This estimate in-cludes 12 deltas ranging in size from 500 to 32 000 km2. The combined estimated alluvium volume below 3 m depth in these deltas is ca. 3500 km3 (stored between 3 and 60 m depth, mean alluvium depth is 54 m). Field-based observa-tions of alluvium depth are very limited and estimates are based on only one observation for the Lena River delta and five different observations for the Mackenzie River delta. Es-timates for mean alluvium SOC density are available from the literature for five different delta units and range from 8.3 to 56.2 kg C m−3. For deltas where no direct observations are
available, alluvium depth and SOC content is estimated from the mean values of those deltas that have data.
Estimated SOC stocks in deltaic alluvium below 3 m depth are 91±52 Pg. Because of high mean alluvium SOC den-sity total stocks in the Mackenzie River delta (34 Pg) are higher than those of the Lena River delta (23 Pg), which is considerably larger and accounts for 44 % of the total esti-mated volume of alluvium. The Yana River delta stores an estimated 7 Pg and alluvial deposits of the remaining nine deltas store the remaining 27 Pg (≤5 Pg each). Between 51 and 92 % (mean 84 %) of deltaic alluvium is stored in per-mafrost. Estimated SOC stocks in perennially frozen allu-vium are 69±38 Pg. For most of the deltas included in this estimate, no field-observations of alluvium depth or SOC
content are available. Calculated CI intervals indicate that uncertainties arising from limited observations of alluvium depth (±49 Pg) are greater than uncertainties from poorly es-timated alluvium SOC density (±18 Pg).
3.4 Storage of permafrost SOC in the Yedoma region The combined area of the Yedoma core region in Siberia (Romanovskii, 1993) and Alaska (Jorgenson et al., 2008) is 1 387 000 km2. Of this 416 000 km2 (30 %) is consid-ered intact Yedoma and 775 000 km2 (56 %) is comprised of permafrost deposits that have previously gone through thermokarst cycling (refrozen sediments accumulated in thaw-lake basins, including mineral soil, lake sediment or peat deposits) (Grosse et al., 2013; Strauss et al., 2013). Within this Yedoma core region, thawed sediments under-lying lakes and rivers (150 000 km2) and areas covered by deltaic or fluvial sediments (47 000 km2) are excluded from calculations.
The estimated stocks of permafrost SOC below 3 m depth in the Yedoma region is 181 Pg with an uncertainty range of 130–239 Pg (hereafter approximated to±54 Pg). Of this an estimated 74 Pg with an uncertainty range of 55–94 Pg (here-after approximated to ±20 Pg) is stored in intact Yedoma while 107 with an uncertainty range of 60–161 Pg (here-after approximated to±50 Pg) is stored in perennially frozen thermokarst basin deposits.
The estimated total stocks of permafrost SOC in the Yedoma region is 213 Pg with an uncertainty range of 164–267 Pg (hereafter approximated to±52 Pg). Of this an estimated 83 Pg with an uncertainty range of 64–104 Pg (hereafter approximated to ±20 Pg) is stored in in-tact Yedoma while 130 Pg with an uncertainty range of 85–180 Pg (hereafter approximated to ±45 Pg) is stored in perennially frozen thermokarst basin deposits.
4 Discussion
Hugelius
et
al.:
Cir
cumpolar
stocks
of
permafr
ost
carbon
6583
map that reports ranges of data, the values used for calculations are given in brackets. For the estimated volume of alluvium, the fraction of alluvium that is perennially frozen is given in parentheses.
River name Delta Depth of Water Permafrost extenth Ground-ice Alluvium SOC density Volume of alluvium, Alluvium SOC stock,
areaa alluvium bodies (% value used content mean±SD, kg C m−3 km3 Pg (±95 % CI)
(km2) (m) coverage for calculations) (% value used (n, sampling depth range) (% in permafrost)
(%) for calculations)
Lena 32 000
Active floodplain 13 203g 60 31k Continuous (90) >20 (25) 11.6±7.6 651 (92) 8
(n=7, 50–100 cm)k
First terrace 7117g 60 31k Continuous (90) >20 (25) 29.9±15.1 351 (92) 10
(n=22, 50–100 cm)k
Second terrace 9120g 60b 31k Continuous (90) >20 (25) 8.3±6.9 450 (92) 4
(n=3, 0–409 cm)j
Third terrace 2560g 40f NAo Continuous (90) >20 (25) 8.3±6.9n 97 (90) 0.8
Mackenzie 13 000 48d 41i 35–65 %c(50) 5–15 (10)c 56.2±8.4e 609 (51) 34
(n=5, 2–200 cm)
Yana 6600 54l 36l Continuous (90) >20 (25) 25.8±18.8l 285 (91) 7
Indigirka 5000 54l 36l Continuous (90) >20 (25) 25.8±18.8l 216 (91) 5
Yenisey 4500 54l 36l Continuous (90) 10–20 (15) 25.8±18.8l 201 (91) 5
Kolyma 3200 54l 36l Continuous (90) >20 (25) 25.8±18.8l 138 (91) 4
Ob 3200 54l 36l Continuous (90) 10–20 (15) 25.8±18.8l 143 (91) 4
Pechora 3200 54l 36l Continuous (90) <10 (5) 25.8±18.8l 148 (90) 4
Yukon 3000 54l 36l Continuous (90) 10–20 (15) 25.8±18.8l 134 (91) 3
Pyasina 1000 54l 36l Continuous (90) >20 (25) 25.8±18.8l 43 (91) 1
Colville 600 54l 36l Continuous (90) <10 (5) 21.2±3.8 28 (90) 0.6
(n=4, 55–270 cm)m 28 (90) 0.6
Olenek 500 54l 36l Continuous (90) >20 (25) 25.8±18.8l 22 (91) 0.5
Sum/mean 75 800 km2 54 m 34 % 83 % 19 % 26.0 kg Cm−3 3514 (84 %) 91±52 Pg
aIf nothing else is stated, delta areas are from Walker (1998). Refers to sub-aerial delta area. Note that subsea deltaic deposits or deltaic deposits covered under other deposits are not included in the current estimate.
bSchwamborn et al. (2000, 2002).
cHeginbottom (2000).
dMean calculated between the depth range 10–30 m (Aylsworth et al., 2000),≥56m (S. L. Smith et al., 2005), 50 m (Tarnocai et al., 2009), 55 m (Johnston and Brown, 1965) and 58 m (Taylor et al., 1996).
eTarnocai et al. (2009).
fAssumed to be 60 m (Schwamborn et al., 2002) minus a 20 m ice complex coverage (Schirrmeister et al., 2011b).
gCalculated based on proportional cover of geomorphic units reported by Zubrzycki et al. (2013) and references therein, assuming uniform water surface area distribution across the delta.
hIf nothing else is stated, permafrost extent and ground ice contents are from Brown et al. (2002). Ground ice content refers to segregation ice, injection ice and reticulate ice. Values are assumed to be valid for the upper 15 m of
alluvium below which there is assumed to be no massive ice.
iS. L. Smith (2011).
jSchirrmeister et al. (2011b).
kZubrzycki et al. (2013).
lCalculated mean from those delta regions where data is available.
mCalculated based on data from Ping et al. (2011).
nThe fluvial sands underlying the third terrace Ice Complex deposit are assumed to have similar characteristics to the fluvial deposits in the second terrace (Schirrmeister et al., 2011b).
oNot applicable, surface is covered by Ice Complex and not included in calculations.
.biogeosciences.net/11/6573/2014/
Biogeosciences,
11,
6573–
6593
,
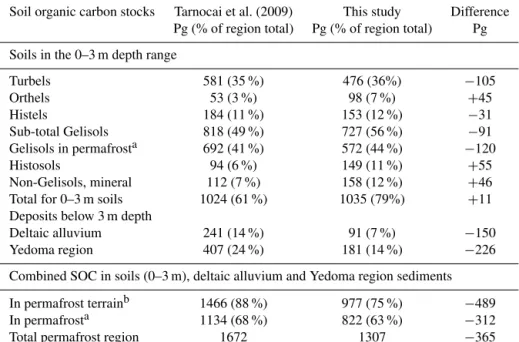
Table 6.Summative comparison of permafrost SOC stocks between the previous estimates in Tarnocai et al. (2009) and this study.
Soil organic carbon stocks Tarnocai et al. (2009) This study Difference Pg (% of region total) Pg (% of region total) Pg
Soils in the 0–3 m depth range
Turbels 581 (35 %) 476 (36%) −105 Orthels 53 (3 %) 98 (7 %) +45 Histels 184 (11 %) 153 (12 %) −31 Sub-total Gelisols 818 (49 %) 727 (56 %) −91 Gelisols in permafrosta 692 (41 %) 572 (44 %) −120 Histosols 94 (6 %) 149 (11 %) +55 Non-Gelisols, mineral 112 (7 %) 158 (12 %) +46 Total for 0–3 m soils 1024 (61 %) 1035 (79%) +11 Deposits below 3 m depth
Deltaic alluvium 241 (14 %) 91 (7 %) −150 Yedoma region 407 (24 %) 181 (14 %) −226
Combined SOC in soils (0–3 m), deltaic alluvium and Yedoma region sediments
In permafrost terrainb 1466 (88 %) 977 (75 %) −489 In permafrosta 1134 (68 %) 822 (63 %) −312 Total permafrost region 1672 1307 −365
aEstimated assuming an active layer depth of 30 cm or more in all Gelisols/High Arctic soils, following the methodology of Kuhry et al. (2013).
bDefined as storage in Gelisols/High Arctic soils and in permafrost in Yedoma or permafrost deltaic deposits below 3 m depth.
layer depth of 30 cm or more in all Gelisols and High Arctic soils).
4.1 Differences to previous estimates
The methodological approach of this estimate is similar to that taken by Tarnocai et al. (2009) who provided a previous depth-integrated estimate of permafrost region SOC stocks. Revised databases and methodology lead to substantial re-ductions of estimated total SOC stocks (Table 6), especially below 3 m depth. There is a considerable reduction in esti-mates of SOC stored in permafrost terrain and in permafrost. The updated estimates of northern circumpolar permafrost region SOC stocks in 0–0.3 and 0–1 m depth are largely based on the same data as the equivalent estimates of Tarnocai et al. (2009). Differences between estimates (+26 and−24 Pg, respectively) are due to gap-filling procedures and updating of the NCSCD spatial framework (see Hugelius et al., 2013a, b) and to new SOC estimates for the High Arctic region. The updated pedon database used to estimate SOC between 1 and 3 m depth includes spatial representa-tion across the northern circumpolar permafrost region and about a tenfold increase in the number of pedons compared to that of Tarnocai et al. (2009). While the relative changes in the total 0–3 m SOC stocks are small, there are consider-able differences between individual soil orders. The revised estimates are considerably lower for Turbels and Histels but higher for Orthels, Histosols and non-permafrost mineral soils (Table 6). This results in a 120 Pg reduction of SOC
stored in permafrost in the 0–3 m depth range compared to the previous estimate. Note that the estimates of the fraction of SOC stored in permafrost are highly uncertain as they are based on an assumption that the average active layer depth in all Gelisols is 0.3 m or more (see Kuhry et al., 2013).
Using a subset of pedon data set 2 and soil (sub)order cov-erage from the NCSCD, Harden et al. (2012) estimated to-tal northern Gelisol SOC stocks to be 1060 Pg, compared to 727 Pg in this estimate. The major cause for this difference is that Harden et al. (2012) did not subdivide the upscaling following physiographic regions, which leads to higher esti-mated mean SOC storage in Gelisol soil orders for regions of thin sedimentary overburden.
In recognition of the limited soil development in high-latitude areas with thin sediments, the High Arctic region was treated separately in upscaling. A previous study estimated active layer SOC stocks for this region to be 12 Pg (Horwath Burnham and Sletten, 2010), which falls within current SOC estimates of 10±3 and 24±8 Pg in the 0–0.3 and 0–1 m depth ranges, respectively.
The previous estimate of deltaic SOC stocks by Tarnocai et al. (2009) was extrapolated based on field data from the Mackenzie River delta only. The revised, substantially lower, estimate presented here builds on this same basic methodology but with some additional sources of data from the literature. The difference between estimates is mainly caused by lower estimates of mean alluvium SOC den-sity (kg C m−3) when including new data from the Colville
al., 2011b; Zubrzycki et al., 2013). There are smaller dif-ferences in the estimated total volume of deltaic alluvium. This is calculated based on areal extent and depth of allu-vium, accounting for the volume of water bodies (assuming a mean water depth of 5 m) and volumetric massive ice con-tent. While the areal extent of deltas for the updated esti-mate is based on an entirely different source (Walker, 1998) and includes a larger subset of individual deltas, the differ-ence in total estimated sub-aerial delta surfaces is relatively small. The estimated depth of alluvium in deltas is also sim-ilar to the original estimate. Tarnocai et al. (2009) consider all deltaic alluvium below 3 m to be in permafrost and do not consider any reduced alluvium volume caused by occur-rences of massive ice. If no massive ice content is assumed in this study, the equivalent estimate would increase from 91±52 to 98±54 Pg.
The updated estimate of permafrost SOC storage below 3 m depth in the Yedoma region is based on the same data set as the estimate for the total permafrost SOC stocks in this region developed by Strauss et al. (2013). Removing depth overlap with the 0–3 m soil estimate resulted in a re-duction from 213 to 181 Pg. The substantial rere-duction com-pared to the previous depth-integrated estimate by Tarnocai et al. (2009) is mainly caused by a twofold reduction of es-timated bulk density, a reduction of eses-timated deposit thick-ness, and different assumptions regarding the characteristics of intact Yedoma compared to refrozen thermokarst sedi-ments (see Fig. 3 in Strauss et al., 2013).
4.2 Distribution patterns of SOC stored in 0–3 m soil 4.2.1 SOC distribution by regions
When compiling pedon data set 2 for upscaling of SOC stocks in the 1–3 m depth range Hugelius et al. (2013a) sub-divided pedons and upscaled SOC stocks based on a conti-nental subdivision (North America vs. Eurasia) as opposed to the upscaling based on physiographic regions used in this study. A first version of this study included both continen-tal and physiographic upscaling (Hugelius et al., 2014). This study is based only on physiographic upscaling as we ar-gue that this approach reflects a more accurate assessment of SOC distribution than subdivision by continent. The physio-graphic regions reflect differences between upland and low-land areas across the northern circumpolar permafrost region (Heginbottom et al., 1993) and are better suited to reflect dif-ferent soil types and important pedogenic processes. This is also consistent with other studies that have utilized physiog-raphy and its influence on soil drainage to upscale soil prop-erties (Harden et al., 2003; Yi et al., 2009). A map of mean SOC storage (Fig. 3) upscaled using physiography shows important patterns that were lacking in continent-based up-scaling (Hugelius et al., 2014). For example, in the 1–2 m depth range, mountainous regions in Siberia emerge as hav-ing low SOC stocks below 1 m. This estimate upscaled based
on physiographic regions reflects differences between up-land and lowup-land areas across the northern circumpolar per-mafrost region (Heginbottom et al., 1993). In thin sediment areas (“areas of mountains, highlands, and plateaus charac-terised by thin overburden and exposed bedrock”) we would generally expect conditions to be less favourable for accu-mulation of large SOC stocks than in areas of thick sedi-ment overburden (“areas of lowlands, highlands and intra-and inter-montane depressions characterised by thick over-burden”). The overall upscaled SOC stock estimates follows this pattern of higher stocks in thick sediment areas, but some individual soils classes do not. Our estimates for thin sedi-ment areas are characterized by large variability, poor pedon representation, and wide uncertainty ranges (see Sect. 4.3.1). We emphasize that this dichotomous subdivision into two distinct physiographic landscape types is not realistic at a lo-cal slo-cale where transitions are more discrete. For studies at finer scales we would not recommend the use of this rela-tively coarse subdivision.
4.2.2 SOC distribution by soil types
In general, the permafrost soils and organic soils dominate 0–3 m SOC storage in the northern circumpolar permafrost region, especially at depths below 1 m depth. This is in ac-cordance with previous results from this region (e.g. Ping et al., 2008; Tarnocai et al., 2009) and reflects current under-standing of the processes that lead to accumulation of SOC in permafrost region soils (cryoturbation, accumulation of peat and repeated deposition and stabilization of organic-rich ma-terial).
Because of their substantial areal extent and high mean SOC storage (kg C m−2), cryoturbated mineral soils are
im-portant SOC reservoirs. Turbels south of the High Arctic region store 41 % of SOC stocks with 31 % areal coverage (Table 4). There are no significant differences in mean Turbel SOC storage between physiographic regions of thick and thin sedimentary overburden regions but there is notable variabil-ity in the data at all depths. Especially in areas of thin sed-iment overburden, low data availability (Table 1) combined with great natural variability leads to wider relative uncer-tainty ranges of estimates.
The mean SOC storage (kg C m−2) is highest in organic
additional field observations are needed to further evaluate this result. This high estimated mean SOC storage of His-tosols in thin sediment regions is heavily influenced by a few very SOC-rich pedons and should be interpreted with cau-tion.
Mineral permafrost soils unaffected by cryoturbation (Or-thels) differ greatly across regions. In areas with recurring deposition and stabilization of organic-rich sediment (allu-vium, prolu(allu-vium, colluvium or wind-blown deposits) very large SOC stocks have accumulated over long timescales (Schirrmeister et al., 2011b). In other cases, shallow, non-cryoturbated permafrost soils in e.g. mountain regions store little SOC (Ping et al., 1998). In this study, Orthels in regions with thin sediments (corresponding to upland or montane ar-eas) store little SOC while Orthels in regions with thick sed-iment have accumulated significant SOC stocks down to 3 m depth (Fig. 2).
In regions of discontinuous permafrost cover (commonly in areas of boreal forest), a large portion of the landscape is covered by non-permafrost mineral soils which also store significant amounts of SOC. Non-permafrost mineral soils cover 38 % of the total permafrost region area and stores 15 % of total 0–3 m SOC stocks. In the upper metre, up-scaling is based on the 11 different non-permafrost min-eral soil orders mapped in the NCSCDv2. Estimated mean SOC storage in this depth interval shows significant vari-ability in estimates with a range from 1.7 to 25.2 kg C m−2
(Table 2). In the 1–2 m depth interval estimated SOC stor-age is ∼10 kg C m−2 in both thick and thin sediment
re-gions. This remains unchanged below 2 m in thick sediment regions while there is significantly less SOC in thin sedi-ment regions. A large fraction of SOC in these latter soils is stored in the top-soil within O and A horizons where high SOC storage may indicate accumulation of humified organic matter, charcoal, or char-mediated sorption in fire-prone bo-real forests. Beneath O and A soil horizons, important mech-anisms for stabilizing SOC in permafrost-free mineral soils include deep rooting, sorption of leached dissolved organic C to clay particles or formation of complexes with iron and/or aluminium. Lower SOC storage in deeper horizons reflects that these soils are less affected by C stabilization processes such as cryoturbation or repeated deposition typically found in permafrost or organic soils. The very low storage in non-permafrost mineral soils of region with thin sediments is due to the influence from pedons in Alpine terrain with lim-ited soil development where bedrock is typically encountered within the upper 3 m.
4.3 Estimated uncertainties and data gaps
This study presents the first quantitative uncertainty ranges for estimates of SOC stocks in northern circumpolar per-mafrost region. The widest uncertainty ranges are associated with those same components that also Tarnocai et al. (2009) identified as being most uncertain. That study assigned low
to very low confidence for estimates of SOC stocks stored in deep soil (1–3 m), Yedoma region deposits and deltaic de-posits.
For 0–3 m soils and deltaic deposits the uncertainty ranges were calculated based on within-class variability of pedons (or alluvial deposit thickness) and areal/volumetric cover-age of classes. For Yedoma region SOC stocks, the uncer-tainty ranges correspond to the 5 and 95th percentiles of bootstrapped estimates. The former approach integrates all individual soil-horizons to the pedon level and assumes a (log)normal data distribution while the latter allows non-normality, but also differs in that it does not integrate individ-ual sediment layers or horizons at the site/pedon level. These updated estimates are based on collaborative databases where efforts have been made to collect data from across regions and from different research groups. Despite this, substantial regional data gaps remain such as in the High Arctic, central Siberia and many river deltas.
4.3.1 Spatial distribution of pedons
The spatial distribution of pedons used to estimate SOC stocks in the 1–3 m depth range is highly clustered (Fig. 1). For example, parts of Alaska and western Russia are well represented, but there are significant data gaps in central Asia, Scandinavia, Greenland, Svalbard and eastern Canada. There is a clear possibility that the available pedons are not truly representative for those areas where field data are lacking. This source of uncertainty is not addressed in this study but we acknowledge that adding more field-based data from under-sampled regions could substantially improve es-timates. A previous comparisons between estimates of 0–1 m SOC stocks based on the NCSCD and local-scale studies re-vealed pronounced differences, especially for Turbels and or-ganic soils (Kuhry et al., 2010). A way to potentially address this source of uncertainty in future studies is to assess the upscaled estimates against independent validation data sets. Such approaches could be applied across scale to address un-certainties from site scale to regional scales.
estimates in Alaska and Canada, where 1–2 or 2–3 m soil layers are sometimes estimated to hold more SOC than the upper metre of soils. This applies to some areas in the west-ern Hudson Bay lowlands and parts of the Canadian Arctic archipelago outside of the High Arctic zone. Clear trends of decreased SOC storage with depth (Fig. 2) indicate that these vertical patterns in SOC storage are not realistic.
The upscaling approach applied here relies on the assump-tion that our pedon data sets are accurate and unbiased sam-ples of permafrost region soils (Hugelius, 2012). For some regions, the degree of replication in individual soil classes is very low (Table 1). To correct for potential errors arising from incomplete sample representation in regions of thin sed-imentary overburden and the High Arctic region the repre-sentation error was estimated and included in the summative uncertainty ranges. The representation error of any class in an under-sampled region is estimated by extracting the vari-ability from repeated subsampling of larger samples avail-able from other regions. For example, we thus assume that Turbels in thick sediment regions are roughly equally vari-able as Turbels in thin sediment regions.
In the High Arctic region, there are very limited pedon data available and the current estimate is based on only eight pedons (six Orthels, one Histel and one Turbel), which were grouped together as Gelisols for calculations. Because of low SOC stocks, this region does not contribute much to the over-all uncertainty of total estimates. However, due to the very limited field data and the large degree of generalization in some High Arctic soil maps (e.g. Svalbard and Greenland, see Hugelius et al., 2013b) these estimates must be regarded as preliminary and highly uncertain. Storage of SOC in cry-oturbated and organic soils is often highly variable, and sam-ple sizes of at least>30 is recommended (Hugelius, 2012). In the current estimate of SOC below 1 m depth, there is very poor representation of Turbels for thin sediment re-gions outside of the High Arctic (n=6 and 2 for the 1–2 and 2–3 m depths, respectively). Based on currently avail-able data, we cannot provide robust estimates of SOC storage in physiographic regions of thin sedimentary overburden or the High Arctic region. This is also reflected in wide uncer-tainty ranges for SOC stocks in these regions. Considering their large areal extent it is nevertheless important to provide assessments based on what little data are available. Further field sampling and/or data compilation will hopefully pro-vide opportunities to refine these estimates.
4.3.3 Differences between soil pedon databases and sampling biases
For the 0–1 m depth interval, two independent sources of pe-don data to estimate SOC storage (kg C m−2) are available
(pedon data set 1 used to calculate 0–1 m SOC stocks and pedon data set 2 used to calculate 1–3 m SOC stocks). While pedon data set 2 was not actually used in the quantification of 0–1 m SOC stocks, estimates are available for that depth
range. If we assume that the two independent data sets are accurate samples of 0–1 m SOC stocks, there should be no significant differences between the data sets. We therefore infer that the significant differences in 0–1 m SOC storage between pedon data sets 1 and 2 could be an indication of sampling biases. Near-surface pedon SOC storage is corre-lated to SOC storage below 1 m depth (Hugelius et al., 2014) and any biases in 0–1 m SOC could therefore also affect our estimates for stocks below 1 m depth. Summarized for the whole permafrost region, there are no significant differences between the data sets for the Orthel and Histel classes, while Turbels and non-permafrost mineral soils may be biased high and Histosols biased low in pedon data set 2. Because data for pedon data set 1 are only available aggregated to the whole permafrost region, no statistical comparisons can be made at regional levels. Detailed comparisons reveal that in North America, pedon data set 2 is consistently estimating higher values than pedon data set 1 (data not shown). In other regions, there are no clear patterns and results differ across soil classes.
There is an indicated bias towards high SOC in Turbels of pedon data set 2. Closer examination of regional patterns reveals that this is largely due to very high SOC storage for Turbels in North America (at all depths). For Eurasian Turbels the pattern is opposite with higher estimates in pedon data set 1. When subdivided following physiographic regions differences between the two data sets are small. The bulk of available North American Turbels are from the North Slope of Alaska (Fig. 1), where previous studies have also shown high mean SOC storage in cryoturbated soils (Michaelson et al., 1996; Ping et al., 1998; Johnson et al., 2011). In gen-eral, the available data in pedon data set 2 are geographically clustered (Fig. 1; Hugelius et al., 2013a) and more dispersed samples of pedons from across regions could reduce any bi-ases introduced by clustered sampling.
values and mean extrapolation depth of pedons). The use of sites where data on mineral sub-soils was extrapolated may be one factor contributing to the indicated low-bias of His-tosols in pedon data set 2 when compared to pedon data set 1. It is difficult to assess the potential bias between pedon data sets 1 and 2 for non-permafrost mineral soils. There is a much larger replication for these soils in pedon data set 1. However, estimated SOC storage for many pedons in data set 1 are from the global scale ISRIC database (Batjes, 1996; Table S1) including all Eurasian permafrost-free soils and North American Aridisols, Andisols and Ultisols. Because of this, the data used for much of the non-permafrost mineral soils in data set 1 are likely not truly representative of soils in the permafrost region.
4.3.4 Data availability and uncertainty estimates for deltaic deposits
The updated estimate of deltaic SOC storage confirms that a substantial stock of permafrost SOC is stored in these de-posits, but it is also clear that more field observations are needed to produce robust estimates. The calculated CI ranges indicate that uncertainties are larger concerning alluvium depth than mean SOC storage value, but the observational base for both estimates are very small and from most major deltas no field observations are available (Table 5). The es-timated uncertainty ranges include an approximation of rep-resentation errors caused by the limited sample sizes. How-ever, these estimates cannot fully account for the fact that most deltas lack field data altogether. Because of these very limited databases these estimates must be considered as pre-liminary for those deltas where no data are available. Further, the estimates rely on the assumption that alluvial SOC con-tents measured in the near surface can be extrapolated to full depth and the reported uncertainty ranges assume a correct spatial extent of deltas and correct volumetric extent of wa-ter bodies and massive ice.
4.3.5 Uncertainties and data gaps of estimates for Yedoma region deposits
SOC stocks in intact Yedoma and perennially frozen thermokarst deposits are calculated based on bootstrapped analyses of data on deposit thickness, organic C%, bulk den-sity (including segregated ice %), and wedge-ice volume gathered from a total of 22 study areas sampled/described in the field. This approach reflects the variability of indi-vidual observations (i.e. analyses of discrete sediment sam-ples or individual depth measurements), which is an effec-tive way of estimating stocks with large inherent (spatial) variability. By estimating one mean based on 10 000 single observation-based bootstrapping means, our single estima-tor’s uncertainty is remarkably lower compared to Strauss et al. (2013). To further improve SOC stock calculation, sen-sitivity analysis revealed that enhanced data on ice wedge
Figure 4.Histograms illustrating the depth-distribution of peat de-posits (organic soil material) in Histosols and Histels of pedon data set 2 (bins = 40 cm depth). The graph shows separate histograms for pedons that were extrapolated to reach the full 3 m depth required for upscaling and pedons where no extrapolation was needed.
volume (Ulrich et al., 2014) and Yedoma deposit thickness will reduce uncertainties significantly.
Another potential source of uncertainty is the geograph-ical extent of the Yedoma region, which is challenging to define discretely. As described in Strauss et al. (2013), the definition of the Yedoma region used here is based on esti-mates from Romanovskii (1993) for Siberia and Jorgenson et al. (2008) for Alaska. Moreover, we added∼65 000 km2for regions with smaller known Yedoma occurrences (e.g. south of Taymyr Peninsula and Chukotka in Russia and the Yukon Territory in Canada). To describe the spatial fragmentation of Yedoma deposit remnants, we used a fragmented Yedoma coverage in the region of 30 %, whereas thermokarst basins with refrozen sediments cover 56 %. Existing thermokarst lakes and rivers were excluded, covering 14 % of the re-gion. To improve this simplified approach, an uncertainty reduction could be reached by implementing spatially ex-plicit data of intact Yedoma distribution based on geological maps for Siberia (Grosse et al., 2013). Nevertheless, data for thermokarst deposit coverage and intact Yedoma coverage in the Taymyr lowlands, Chukotka, parts of Alaska and north-western Canada are currently not available.
4.3.6 Potential error sources not included in uncertainty estimates
uncertainties. A regional study of the Northern Usa River basin (Russian Arctic) showed that uncertainties from map errors were similar in magnitude as uncertainties from in-sufficient pedon representation or natural variability (95 % CI ranges both estimated at ±8 % for 0–1 m SOC stocks; Hugelius, 2012). Because no dedicated ground-truthing data set is available to assess the NCSCD soil maps that form the spatial base of upscaling SOC in 0–3 m soils, we cannot di-rectly quantify this error. Small-scale maps (covering large geographic regions) do not necessarily have lower mapping accuracy than large-scale maps (covering small geographic regions), but because of the necessary generalization inher-ent in map-making, large-scale maps from local studies (such as the land cover maps used by Hugelius, 2012) are expected to have higher mapping precision. We would thus expect un-certainty from spatial errors in the maps used in this study to be equal to or greater than those found for the Northern Usa River basin (i.e. a 95 % CI of±8 % or more). If we as-sume an uncertainty of±10 % from spatial error component in all estimates, the propagated uncertainty range of the com-bined estimate of 1307 Pg SOC would increase by∼ ±30 to
∼ ±200 Pg. However, to properly assess the spatial errors in permafrost region SOC stock estimates, comprehensive ground-truthing data sets for circumpolar soil classification maps, deltaic extent and Yedoma region extent are needed.
Imprecision in field or laboratory measurements (e.g., sample volume, bulk density or C content) are not accounted for in this study. The relative importance of such errors is expected to differ between different studies, scales and land-scape types. Goidts et al. (2009) provide a comprehensive analysis and discussion of different sources of uncertainty in SOC stock estimates and their propagation in upscaling. They conclude that following upscaling to landscape scale, imprecision in laboratory measurements of rock mass frag-ments (>2 mm), SOC concentration (%) and bulk density may propagate and cause substantial uncertainty in estimates. However, as this circumpolar estimate study combines field and laboratory data collected from a multitude of different sources over several decades, quantifying this uncertainty is currently not possible.
4.4 Deposits with significant SOC stocks below 3 m depth
This estimate of SOC stocks in the northern circumpolar permafrost region includes 0 to 3 m soils as well as deeper deltaic deposits and permafrost deposits in the Yedoma re-gion. Other deposits with significant SOC stocks below 3 m depth have not been included. In many organic soils of the permafrost region, peat deposits extend below 3 m depth (e.g. Sheng et al., 2004; Tarnocai et al., 2005; Hugelius and Kuhry, 2009; Yu, 2012). Of the organic soils included in pedon data set 2 in this study, 17 % sites have peat deposits extending be-low 3 m depth (Fig. 4) and these peat deposits are expected to
store substantial SOC stocks in addition to what is included here.
The current estimate for deltaic deposits includes the 12 major deltas in the permafrost region (selection based on Walker, 1998), but all intermediate or small deltas are ex-cluded. Presently, there is no data set summarizing the aerial extent of deltaic deposits in the northern circumpolar per-mafrost region, but a geospatial characterization of Arctic permafrost coastlines (Lantuit et al., 2012) shows significant occurrences of deltas along the Arctic coastline besides those included here. New data also reveal that, besides deltas and the Yedoma region, there are significant SOC stocks in other unconsolidated deeper Quaternary deposits of the permafrost region (Hugelius et al., 2011; Schirrmeister et al., 2011a; Ping et al., 2011; among others). Following the physio-graphic subdivision, 6.2×10⁶km2of the permafrost region is characterized by thick sedimentary overburden (sediments deeper than 5–10 m; Brown et al., 2002). Deltaic deposits and the Yedoma region included in this study together cover ca. 1.5×10⁶km2. Any SOC stored in deposits below 3 m depth in the remaining ca. 5×10⁶km2of thick sedimentary over-burden remains unaccounted for.
4.5 Potential vulnerability and remobilization of permafrost region SOC stocks
The substantial SOC stocks of the northern permafrost region are vulnerable to thaw remobilization following permafrost degradation (Schuur et al., 2008, 2013). Key processes of permafrost degradation include active layer deepening, talik or thermokarst formation and thermal erosion (Schuur et al., 2008; Grosse et al., 2011). While active layer deepening mainly affects near-surface soils (Harden et al., 2012), taliks, thermokarst and thermal erosion can cause remobilization and potential mineralization of SOC stored at greater depths. Local-scale studies indicate that both active layer deepen-ing and thermokarst (or thermoerosion) can affect substantial fractions of permafrost landscapes over decadal timescales (Jones et al., 2011, 2013; Hugelius et al., 2011, 2012; Sannel and Kuhry, 2011).
Both active layer SOC and permafrost is highly suscep-tible to impacts from wildfire (Harden et al., 2000), which has increased in severity and areal extent with recent warm-ing (Turetsky et al., 2011). SOC stocks in the permafrost re-gion may be reduced directly via combustion, or indirectly due to post-fire increases in soil temperature and decompo-sition (Harden et al., 2006; Mack et al., 2011). Fire-driven reductions in organic-horizon thickness also decreases sub-soil insulation and cause active layer deepening, which can increase the amount of SOM susceptibly to decomposition in the unfrozen phase (O’Donnell et al., 2011).