GENETIC STRUCTURE OF NATURAL POPULATIONS OF
CRYPTOCARYA MOSCHATA NEES (LAURACEAE) FROM
SOUTHEASTERN BRAZILIAN ATLANTIC RAIN FOREST
1 Post-doctoral scholarship (FAPESP 99/05004-5); 2 research grant (BIOTA/FAPESP 99/05818-2); 3 Departamento de
Botânica, UNICAMP, P.O. Box 6109, 13083-970, Campinas, SP, Brazil; 4 Laboratório de Melhoramento de Plantas, CENA/
USP, P.O. Box 96, 13400-970, Piracicaba, SP, Brazil Author for correspondence: E-mail: [email protected]
Abstract
[Genetic structure of natural populations of Cryptocarya moschata Nees (Lauraceae) from southeastern Brazilian Atlantic rain forest]. This study was accomplished on a more comprehensive basis to evaluate previous questions that were raised from a preliminary article about the genetic structure of Cryptocarya moschata populations. Thus, through the analysis of 40 polymorphic allozyme loci, allele frequencies were estimated from 335 individuals of 11 natural populations of C. moschata from six hydrographic basins of São Paulo state and Serra da Estrela, Rio de Janeiro, Brazil. Estimates of Wright’s F statistics were done through the analysis of variance, presenting average values of Fˆ = 0.352, ˆθP= 0.285 and
fˆ= 0.097. These results indicated that individuals within populations must be panmitic, and that the diversity among populations is fairly high, being superior to what would be expected for groups of plants having a full-sib family structure. From estimates of θˆPobtained for populations taken two at a time, the model of isolation by distance was tested; data did not fit the model, showing that ˆθPdid not increase by the respective increasing of the geographic distance. The estimated gene flow of 0.55 migrants per generation corroborated the pronounced populational differentiation, indicating that drift effects should be more important than the selection ones. The effective population sizes found from the sampled popula-tions showed that there was an adequate genetic representativeness of the samples for those with relatively low values of
fˆ . Though, under a metapopulation context, the effective population size was 17.07 individuals, indicating that sampling
performed for the species corresponded to 88.44% of the maximum effective size obtained from 11 populations with a θˆPof 0.285, equivalent to only 5.09% individuals for the total sampled. Management and conservation strategies aimed at preserving high intrapopulation genetic variation in C. moschata would imply in the maintenance of populations with great number of individuals. Moreover, for the preservation of the species as a whole, the maintenance of many such populations would be mandatorily recommended, which denotes that the conservation of large areas of Atlantic rain forest should be necessary to hold its evolutionary dynamics.
Key words: allozymes, Lauraceae, genetic structure, Neotropics, Cryptocarya moschata, Atlantic rain forest, Brazil
Biota Neotropica v4 (n1) – http://www.biotaneotropica.org.br/v4n1/pt/abstract?article+BN00404012004
Pedro Luís Rodrigues de Moraes1,3 & Maria Teresa Vitral de Carvalho Derbyshire2,4
Resumo
Estrutura genética de populações naturais de Cryptocarya moschata Nees (Lauraceae) na Mata Atlântica do sudeste brasileiro]. Este estudo foi realizado, de forma mais abrangente, para avaliar questões prévias que foram levantadas a partir de um artigo preliminar sobre a estrutura genética de populações de Cryptocarya moschata. Assim, pela análise de 40 locos alozímicos polimórficos, estimaram-se as freqüências alélicas para 335 indivíduos adultos de 11 populações naturais de Cryptocarya moschata, de seis bacias hidrográficas do estado de São Paulo e da Serra da Estrela, no Rio de Janeiro. Obtiveram-se estimativas das estatísticas F de Wright, estimadas pelo método da análise da variância, que apresentaram valores de Fˆ= 0,352, θˆP= 0,285 e fˆ= 0,097, indicando que os indivíduos dentro das populações devem ser panmíticos, que a diversidade entre as mesmas é bastante alta, superior à esperada para famílias com estruturação de irmãos-completos. Calculando θˆP com as populações tomadas duas a duas, testou-se o modelo de isolamento pela distância, sendo que os dados não aderiram ao modelo, mostrando não haver aumento de θˆPcom o respectivo aumento da distância geográfica. O fluxo gênico estimado em 0,55 indivíduos por geração corrobora a pronunciada diferenciação populacional encontrada, indicando que efeitos de deriva devem ser mais importantes do que os de seleção. Os tamanhos efetivos populacionais estimados a partir das populações amostradas mostraram que houve uma adequada representatividade genética das amostras para aquelas com valores de fˆrelativamente baixos. Contudo, sob um contexto metapopulacional, o tamanho efetivo populacional foi de 17,07 indivíduos, indicando que a amostragem realizada para a espécie correspondeu a 88,44% do tamanho efetivo máximo obtido a partir de 11 populações com um θˆP de 0,285, correspondendo a apenas 5,09% dos indivíduos amostrados. As estratégias de manejo e conservação necessárias para a preservação da alta variabilidade genética intrapopulacional de C. moschata implicam na manutenção de populações com número grande de indivíduos. Além disso, para a preservação da espécie como um todo, a manutenção de muitas populações se faz necessária, o que denota que a conservação de grandes áreas de Mata Atlântica deva ser necessária para manter sua dinâmica evolutiva.
3 Moraes, P. L. R. & Derbyshire, M. T. V. de C. - Biota Neotropica, v4 (n1) - BN00404012004
1. Introduction
The allozyme variability in natural populations of plants has been intensively studied (Gottlieb 1977, Nevo 1978, Brown 1979, Hamrick et al. 1979, Hamrick & Godt 1990, Rocha & Lobo 1998, Sousa 2001). In tree species, the allozyme variability is related to longevity, ample geographic distribution, and the potential for a considerable gene flow, characteristics which, when combined, can contribute to an increase of the effective population size (Sousa 2001).
According to Rocha & Lobo 1998, the knowledge of populational structure is important so that one can avoid additional losses of genetic diversity in populations which are threatened by logging activities, deforestation and habi-tat fragmenhabi-tation (Hall et al. 1994, Nason et al. 1997). It fol-lows that the fragmentation of areas of forest, caused by agriculture and other anthropic activities, leads to the isola-tion of subpopulaisola-tions and, consequently, to genetic drift and endogamy (Robinson 1998).
The information about the genetic variability in natu-ral populations is fundamental to the progress of two cur-rent issues of major interest: speciation in tropical forests and conservation of genetic resources (Buckley et al. 1988). Nevertheless, the present knowledge of the Atlantic Rain Forest (sensu lato; see Joly et al. 1999) is still rather insig-nificant, mainly in what concerns the populational genetic structure of its species and suitable sampling procedures aiming at conservation and management.
On a previous work, Moraes et al. (1999) had studied 214 individuals of four Cryptocarya moschata Nees natural populations hailed from two regions (south and north coast) of São Paulo state, through 18 allozyme loci. The authors pointed out that the strategies of management and conser-vation, which are needed for the preservation of the high intrapopulational genetic variability found in C. moschata, would entail the maintenance of populations with a high number of individuals. Furthermore, for the preservation of the species as a whole, the maintenance of a large number of populations was suggested. For those adult populations of C. moschata, the divergences obtained through FˆST
es-timates also suggested the existence of significant genetic drift and/or natural selection effects among populations. However, the lack of divergence between neighbouring populations of the northern coastal region, which had no physical isolation, indicated weaker genetic drift and/or natural selection effects when compared to southern popu-lations, which presented potential physical isolation. This made reasonable to consider the stepping-stone as a pos-sible model for the genetic variability organization within this species. Moreover, the coancestry coefficient for re-gions did not show any additional allele frequencies differ-ences between individuals owed to the regions component, suggesting lower levels of gene flow than that found
be-tween neighbouring populations without isolation. An es-timated gene flow of 0.9 migrants per generation corrobo-rated the pronounced divergence found among populations. Additionally, assuming that the species was compounded by infinite populations, the effective population size was 10.05 individuals from the 214 sampled, which had indicated that the sampling procedure corresponded to 73.43% of the maximum effective size obtained from four populations with a FˆSTof 0.140, equivalent to only 5.00% individuals for the
total sampled. These previous results showed that the high value of FˆSTand the low of Nˆmhad indicated a restricted
gene flow among the populations, which were distanced about ten to hundreds of kilometers from each other.
Based mainly on the results obtained by Moraes et al. (1999), a more comprehensive sampling of the species in association with an expressive large number of allozyme loci have been used in the present study to verify if the slight tendency found before, of increase in populational diversity with distance, could be explained by the model of isolation by distance per se. Another issue that has been considered was to analyze how was the improvement in the genetical representativeness of the species, taken from Nˆm,
under a better sampling strategy.
This study aims at the characterization of the genetic structure of Cryptocarya moschata Nees populations, by means of Wright’s F statistics estimates, through the vari-ance analysis method. Estimates of indirect gene flow for the populational set were obtained, as well as intra and metapopulational effective sizes and neighbourhood sizes. Additionally, based on unbiased FST estimate, the isolation by distance model was assessed.
2. Materials and Methods
2.1. Cryptocarya moschata Nees
4 Moraes, P. L. R. & Derbyshire, M. T. V. de C. - Biota Neotropica, v4 (n1) - BN00404012004
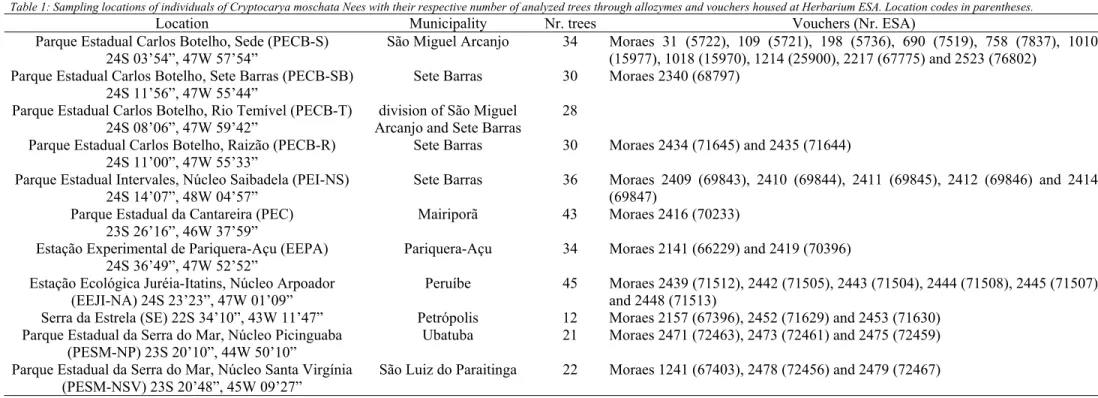
Alves 2002, Moraes et al. 2002; from fruit collections of PECB-S). Moraes & Monteiro (2002) presented the multilocus outcrossing rate estimate (tˆm= 0.884 ± 0.034), which indicated a predominant outcrossing mating system for the analyzed population of PECB-S. Still, from Ritland’s “sibling-pair” model (correlated mating model), the results showed that there was variation in selfing rates among dif-ferent trees, also indicating that when there was inbreeding, most seeds in the trees were likely full-sibs. The chromo-some number is 2n = 24 (Moraes & Gardingo 1996). This species is rich in alkaloids, styryllpyrones, and flavonoids (Cavalheiro & Yoshida 2000). Its bark, bitter and scented, is considered to be stomachical and helpful in fighting colic and diarrhea, in folk medicine (Vattimo 1957). The tea from its seeds is used against stomachache, and its crushed leaves against aches and colic; the fruit is carminative, and widely consumed by primate populations [brown howler monkeys (Alouatta fusca), brown capuchins (Cebus apella), and “muriquis” (woolly spider monkeys, Brachyteles arachnoides)], and cracids (Pipile jacutinga and Penelope obscura); its wood is used in canoes manufacture (Moraes et al. 2002). C. moschata has a widespread geographic dis-tribution, mainly in the Atlantic rain forest of Brazil (Coe-Teixeira 1965, Kostermans 1937, 1938, Vattimo 1966), rang-ing from the state of Rio Grande do Sul to Pernambuco. Species identification was done from dried specimens housed at Herbarium ESA, Piracicaba - SP, whose vouchers are listed in table 1.
2.2. Plant collections and sampling
A foliar stem bearing mature leaves was collected from adult trees of Cryptocarya moschata, which was packed in plastic bags, and stored in stiff foam-boxes with ice for the transportation to the laboratory. In the laboratory, they were kept at ≅ 5oC, and the third mature leaf from the stem
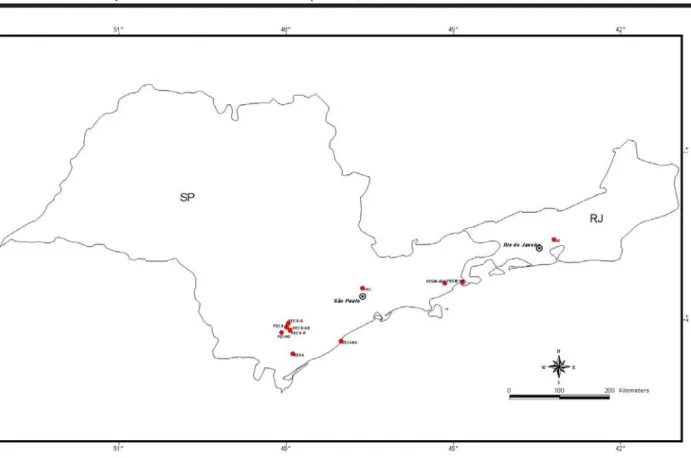
apex was selected and extracted for electrophoresis, after two days on average. Table 1 and figure 1 present the loca-tions where populaloca-tions were sampled, with, at least, 20 individuals being collected, whenever possible.
2.3. Allozymes
Through allozyme markers revealed by starch gel elec-trophoresis, the genetic characterization of the analyzed populations was done according to procedures described by Alfenas et al. (1991).
The choice of allozyme systems for the genetic analy-sis of samples was preceded by a set of tests, which was carried out at the Laboratory of Plant Improvement (LAMP - CENA/USP), with the same procedures described by Moraes & Derbyshire (2002).
Thirty one enzyme systems were assayed. Among them, nineteen were selected for populational analyses due
to good resolution of bands and polymorphism. From zy-mograms obtained, 40 putative loci were used in genetic analyses, such as: acid phosphatase (Acph-1, Acph-2, Acph-3), alkaline phosphatase (Alph-1, Alph-2), cathalase (Cat-1 and Cat-2, method of Alfenas et al. 1991), cathalase (Cat-1, Cat-2 and Cat-3, method of Scandalios 1965), dia-phorase (Dia-1, Dia-2, Dia-3), α-esterase (α-Est-1, α-Est-2),
β-esterase (β-Est-1, β-Est-2), glutamic dehydrogenase (Gdh), glutamate-oxaloacetate transaminase (Got), isocitrate dehy-drogenase (Idh), malic dehydehy-drogenase (Mdh-1, Mdh-2), nicotinamide adenine dinucleotide dehydrogenase (Nadhdh), nicotinamide adenine dinucleotide phosphate dehydrogenase (Nadphdh), 6-phosphogluconic dehydro-genase (6Pgdh-1, 6Pgdh-2, 6Pgdh-3), phosphoglucose isomerase (Pgi-1, Pgi-2), polyphenoloxidase (Ppo-1, Ppo-2), peroxidase (Prx-1, Prx-2, Prx-3, Prx-5), shikimate dehydroge-nase (Skdh-1, Skdh-2), and superoxide dismutase (Sod-1, Sod-2 and Sod-3). Different loci for the same enzyme were sequentially numbered, with the most anodally migrating locus being given the lowest number, and so on. Likewise, within each locus the most frequent migrating band was designated allele 1, and each successively slower band was numbered 2, 3, etc.
2.4. Data analyses
From the interpretation of zymograms and the follow-ing definition of genotypes for each individual analysed, the allelic frequencies of each population studied were cal-culated and also the main genetic variability measures: A = mean number of alleles per locus, Ap = effective number of alleles per locus, P = percent polymorphic loci (95% crite-rion) , and H = gene diversity or expected heterozygosity (Nei 1987).
Deviations from Hardy-Weinberg expectations (HWE) were described using fixation indexes ( Fˆ(IS), Wright 1978)
for each population, and their significance was evaluated by exact tests using a conventional Monte Carlo method, as proposed by Guo & Thompson (1992), performed by TFPGA 1.3 program (Miller 1997).
Nested analyses of molecular variance were done for a three-level sampling hierarchy, through the program GenAlEx v.5.04 (Peakall & Smouse 2001), to verify related-ness of pairs of alleles by virtue of being within individuals, between individuals within populations, or between popu-lations within regions. The three degrees of relatedness were
popula-5 Moraes, P. L. R. & Derbyshire, M. T. V. de C. D. - Biota Neotropica, v4 (n1) - BN00404012004
Table 1: Sampling locations of individuals of Cryptocarya moschata Nees with their respective number of analyzed trees through allozymes and vouchers housed at Herbarium ESA. Location codes in parentheses.
Location Municipality Nr. trees Vouchers (Nr. ESA)
Parque Estadual Carlos Botelho, Sede (PECB-S) 24S 03’54”, 47W 57’54”
São Miguel Arcanjo 34 Moraes 31 (5722), 109 (5721), 198 (5736), 690 (7519), 758 (7837), 1010 (15977), 1018 (15970), 1214 (25900), 2217 (67775) and 2523 (76802)
Parque Estadual Carlos Botelho, Sete Barras (PECB-SB) 24S 11’56”, 47W 55’44”
Sete Barras 30 Moraes 2340 (68797)
Parque Estadual Carlos Botelho, Rio Temível (PECB-T) 24S 08’06”, 47W 59’42”
division of São Miguel Arcanjo and Sete Barras
28
Parque Estadual Carlos Botelho, Raizão (PECB-R) 24S 11’00”, 47W 55’33”
Sete Barras 30 Moraes 2434 (71645) and 2435 (71644)
Parque Estadual Intervales, Núcleo Saibadela (PEI-NS) 24S 14’07”, 48W 04’57”
Sete Barras 36 Moraes 2409 (69843), 2410 (69844), 2411 (69845), 2412 (69846) and 2414 (69847)
Parque Estadual da Cantareira (PEC) 23S 26’16”, 46W 37’59”
Mairiporã 43 Moraes 2416 (70233)
Estação Experimental de Pariquera-Açu (EEPA) 24S 36’49”, 47W 52’52”
Pariquera-Açu 34 Moraes 2141 (66229) and 2419 (70396)
Estação Ecológica Juréia-Itatins, Núcleo Arpoador (EEJI-NA) 24S 23’23”, 47W 01’09”
Peruíbe 45 Moraes 2439 (71512), 2442 (71505), 2443 (71504), 2444 (71508), 2445 (71507) and 2448 (71513)
Serra da Estrela (SE) 22S 34’10”, 43W 11’47” Petrópolis 12 Moraes 2157 (67396), 2452 (71629) and 2453 (71630) Parque Estadual da Serra do Mar, Núcleo Picinguaba
(PESM-NP) 23S 20’10”, 44W 50’10”
Ubatuba 21 Moraes 2471 (72463), 2473 (72461) and 2475 (72459)
Parque Estadual da Serra do Mar, Núcleo Santa Virgínia (PESM-NSV) 23S 20’48”, 45W 09’27”
6 Moraes, P. L. R. & Derbyshire, M. T. V. de C. D. - Biota Neotropica, v4 (n1) - BN00404012004
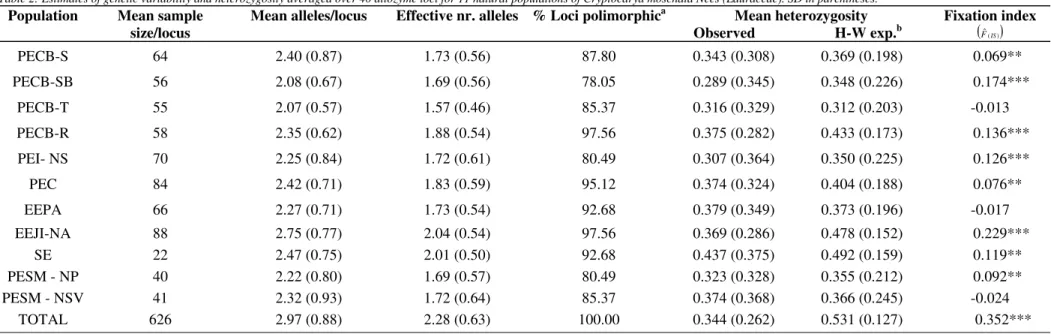
Table 2: Estimates of genetic variability and heterozygosity averaged over 40 allozyme loci for 11 natural populations of Cryptocarya moschata Nees (Lauraceae). SD in parentheses.
Population Mean sample size/locus
Mean alleles/locus Effective nr. alleles % Loci polimorphica Mean heterozygosity Observed H-W exp.b
Fixation index
( )Fˆ(IS)
PECB-S 64 2.40 (0.87) 1.73 (0.56) 87.80 0.343 (0.308) 0.369 (0.198) 0.069**
PECB-SB 56 2.08 (0.67) 1.69 (0.56) 78.05 0.289 (0.345) 0.348 (0.226) 0.174***
PECB-T 55 2.07 (0.57) 1.57 (0.46) 85.37 0.316 (0.329) 0.312 (0.203) -0.013
PECB-R 58 2.35 (0.62) 1.88 (0.54) 97.56 0.375 (0.282) 0.433 (0.173) 0.136***
PEI- NS 70 2.25 (0.84) 1.72 (0.61) 80.49 0.307 (0.364) 0.350 (0.225) 0.126***
PEC 84 2.42 (0.71) 1.83 (0.59) 95.12 0.374 (0.324) 0.404 (0.188) 0.076**
EEPA 66 2.27 (0.71) 1.73 (0.54) 92.68 0.379 (0.349) 0.373 (0.196) -0.017
EEJI-NA 88 2.75 (0.77) 2.04 (0.54) 97.56 0.369 (0.286) 0.478 (0.152) 0.229***
SE 22 2.47 (0.75) 2.01 (0.50) 92.68 0.437 (0.375) 0.492 (0.159) 0.119**
PESM - NP 40 2.22 (0.80) 1.69 (0.57) 80.49 0.323 (0.328) 0.355 (0.212) 0.092**
PESM - NSV 41 2.32 (0.93) 1.72 (0.64) 85.37 0.374 (0.368) 0.366 (0.245) -0.024
TOTAL 626 2.97 (0.88) 2.28 (0.63) 100.00 0.344 (0.262) 0.531 (0.127) 0.352***
a
A locus was considered polymorphic if the frequency of the most common allele did not exceed 0.95 b
7 Moraes, P. L. R. & Derbyshire, M. T. V. de C. D. - Biota Neotropica, v4 (n1) - BN00404012004
θθ
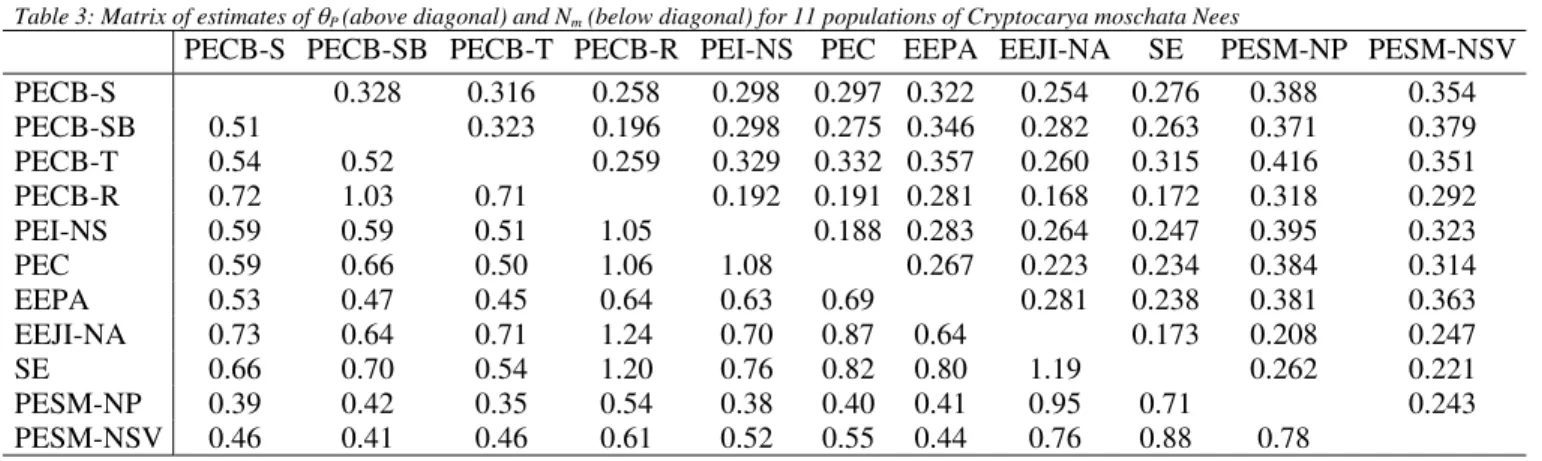
Table 3: Matrix of estimates of θP (above diagonal) and Nm (below diagonal) for 11 populations of Cryptocarya moschata Nees
PECB-S PECB-SB PECB-T PECB-R PEI-NS PEC EEPA EEJI-NA SE PESM-NP PESM-NSV
PECB-S 0.328 0.316 0.258 0.298 0.297 0.322 0.254 0.276 0.388 0.354
PECB-SB 0.51 0.323 0.196 0.298 0.275 0.346 0.282 0.263 0.371 0.379
PECB-T 0.54 0.52 0.259 0.329 0.332 0.357 0.260 0.315 0.416 0.351
PECB-R 0.72 1.03 0.71 0.192 0.191 0.281 0.168 0.172 0.318 0.292
PEI-NS 0.59 0.59 0.51 1.05 0.188 0.283 0.264 0.247 0.395 0.323
PEC 0.59 0.66 0.50 1.06 1.08 0.267 0.223 0.234 0.384 0.314
EEPA 0.53 0.47 0.45 0.64 0.63 0.69 0.281 0.238 0.381 0.363
EEJI-NA 0.73 0.64 0.71 1.24 0.70 0.87 0.64 0.173 0.208 0.247
SE 0.66 0.70 0.54 1.20 0.76 0.82 0.80 1.19 0.262 0.221
PESM-NP 0.39 0.42 0.35 0.54 0.38 0.40 0.41 0.95 0.71 0.243
PESM-NSV 0.46 0.41 0.46 0.61 0.52 0.55 0.44 0.76 0.88 0.78
Table 4: Sample sizes with respective estimates of effective population sizes (Ne) for populations of Cryptocarya moschata Nees.
População N f = FIS Nea
PECB-S 34 0.070 31.78
PECB-SB 30 0.174 25.55
PECB-T 28 -0.013 28.37
PECB-R 30 0.136 26.41
PEI-NS 36 0.126 31.97
PEC 43 0.076 39.96
EEPA 34 -0.017 34.59
EEJI-NA 45 0.229 36.61
SE 12 0.119 10.72
PESM-NP 21 0.092 19.23
PESM-NSV 22 -0.024 22.54
TOTAL 335 0.097 17.07b
a
for a population without genetic structure: Nˆe=N/(1+ fˆ);
N 2 / ) ˆ 1 ( )]
N + +F
b
for many populations in a model of infinite
8 Moraes, P. L. R. & Derbyshire, M. T. V. de C. - Biota Neotropica, v4 (n1) - BN00404012004
9 Moraes, P. L. R. & Derbyshire, M. T. V. de C. - Biota Neotropica, v4 (n1) - BN00404012004
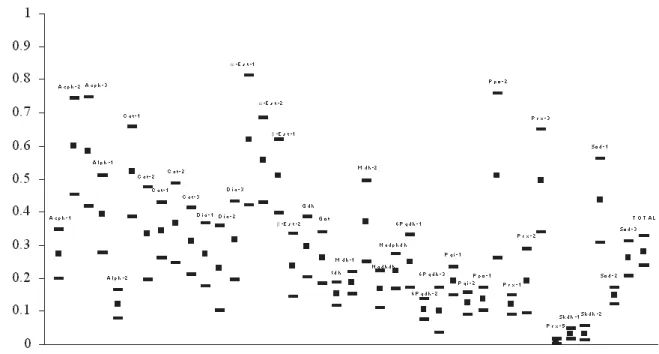
Figure 3:
θ
P mean estimates by allozyme loci from 11 natural populations of Cryptocarya moschata Nees. Confidence intervals obtained by numeric resampling: jackknife over samples; for the total, bootstrap over loci.10 Moraes, P. L. R. & Derbyshire, M. T. V. de C. - Biota Neotropica, v4 (n1) - BN00404012004
Figure 5: Log(
N
ˆ
m
) against log(distance in km) for populations of Cryptocaryamoschata Nees.11 Moraes, P. L. R. & Derbyshire, M. T. V. de C. - Biota Neotropica, v4 (n1) - BN00404012004
tions PECB-S and PECB-T; Ribeira do Iguape: PECB-R, PECB-SB, PEI-NS, and EEPA; Baixada Santista: EEJI-NA; Paraíba do Sul: PESM-NSV; Litoral Norte: PESM-NP; Alto Tietê: PEC; and Serra da Estrela, RJ: SE), different altitudes (around 800 m: S and T; around 300 m: PECB-R; around 60-100 m: PECB-SB, PEI-NS, PESM-NP, EEPA, EEJI-NA, and SE; around 900-1000 m: PEC and PESM-NSV), geographic proximity, and by a combination of them.
Similarly, but with no hierarchy of populations within regions, for each allele, Wright’s F statistics were calcu-lated through Cockerham-Weir’s estimators (the overall
in-breeding coefficient F = Wright’s FIT; the coancestry
θ
ˆ
P = Wright’s FST; and f = Wright’s FIS; Cockerham & Weir 1993), with permutation tests to verify their significance, done by FSTAT 2.9.3.2 program (Goudet 1995, 2002). Confidence in-tervals were calculated through resampling procedures like bootstrapping over loci, for their mean, and jackknifing over samples, for each locus.For indirect estimation of Nm, the formula Nm = 0.25(1 - FST)/FST (Wright 1969) was applied, using the estimator
θ
ˆ
PforF
ˆ
ST , as demonstrated by Cockerham & Weir (1993), for the fact it is less biased. This model as-sumes equilibrium between the homogenizing effects of gene flow and the disruptive effects of genetic drift and it also assumes that parameters such as population size and mi-gration rate are uniform and constant over space and time (Sork et al. 1999). From Nm estimate, the neighbourhood size (Nb) was calculated from the formula proposed by Slatkin & Barton (1989): Nb=2πNm (Eguiarte et al. 1993).In this way, considering the density of reproductive indi-viduals per area (d), the neighbourhood area is defined as A = Nb/d (Eguiarte et al. 1993), which was calculated for the populations that presented available estimates of densities. Information on densities of individuals, which were utilized to calculate neighbourhood areas, was obtained from phytosociological studies already concluded and developed in some of the sampling areas of C. moschata of the present study. So, for PECB-S population, the density found was of 12 adult individuals.ha-1 (A.C. Dias, unpublished data); for
PEI-NS, it was of 15.4 adult ind.ha-1 (R.J. Almeida-Scabbia,
unpublished data); 10 adult ind.ha-1 for EEPA (N.M.
Ivanauskas, unpublished data); 17.3 adult ind.ha-1 for PEC
(F.A.R.D.P. Arzolla, unpublished data); 7.5 adult ind.ha-1 for
PESM-NP (M. Sanchez, unpublished data); and 2 adult ind.ha-1 for PESM-NSV (M. Tabarelli, unpublished data).
The model of isolation by distance was tested ac-cording to Slatkin (1993), making use of a Mantel’s test (Mantel 1967, see Manly 1985, Sokal 1979, and Sokal & Rohlf 1995), applying the Pearson’s correlation coefficient (r). This test was performed by the following programs: GENEPOP 3.3 (Raymond & Rousset 1995); FSTAT 2.9.3.2 (Goudet 1995,
2002); and GENETIX 4.04 (Belkhir et al. 1996-2002), which
calculate
θ
ˆ
pand the number of migrants per generation (Nm) between pairs of populations.The effective population size was obtained through variance components, according methodology presented by Vencovsky (1997) and carried out by Moraes et al. (1999) and Moraes & Derbyshire (2002).
3. Results and Discussion
The main indexes of gene diversity, as well as the observed and expected heterozygosities are shown on table 2. The C. moschata populations displayed high rates of gene diversity, similar to the highest ones found in other tropical tree species. The PECB-T, EEPA and PESM-NSV populations proved to be consistent with the HWE propor-tions, in spite of the fact that the negative values of the intrapopulation fixation index (f = FIS) indicated an exces-sive number of heterozygotes, although at non-significant levels. The remaining populations presented significant to highly significant intrapopulational endogamy. The total fixa-tion index to the 11 populafixa-tions grouped was highly signifi-cant, with a deficit of heterozygotes. These results per se can only point to the existence of differences among the populations in what regards allelic frequencies and levels of diversity, hinting at a divergence among them. In the absence of inbreeding or population genetic subdivision (FIT = 0), f is equal to the probability that a randomly chosen gamete from individual i and a randomly chosen gamete from individual j carry alleles that are identical by descent. This probability is, by definition, the inbreeding coefficient of a hypothetical offspring of i and j so that f has expected values of 0.25 and 0.125 for full and half-sibling family struc-ture, respectively. From table 2, it can be observed that popu-lation EEJI-NA showed a full-sib pattern of genetic struc-ture, whereas populations PECB-SB, PECB-R, PEI-NS, SE, and PESM-NP, and PECB-S and PEC have indicated kinship at approximately the level of half-sibs and first cousins, re-spectively. The estimates of gene and heterozygote vari-ability to the C. moschata populations were slightly higher than those found among the analysed populations of C. aschersoniana by Moraes & Derbyshire (2002), utilizing the same set of allozymes used in the present study.
From the analyses of variance for three-level hierar-chy, in all but one of the cases, results showed non
12 Moraes, P. L. R. & Derbyshire, M. T. V. de C. - Biota Neotropica, v4 (n1) - BN00404012004
addition, the values of
θ
ˆ
P andF
ˆ
were 0.257 and 0.285,respectively. Thus, the smallness of the average fixation index for the 40 loci among the above regions indicated relatively weak differentiation among large areas and, con-sequently, the apparent genetic structure among regions was not given further consideration. Since the greatest en-vironmental differences are related to the different regions, it is probable that selective differences were of little or no importance and that the fixation indexes were essentially measures of random drift due to endogamous mating in popu-lations (P.L.R. Moraes, unpublished data), and probably ac-cidental differences in the founding individuals among the populations which are largely smoothed out in the regions, as discussed by Wright (1978).
According to figure 2, in which the f (FIS) mean esti-mates by allozyme loci are shown, based on 11 natural popu-lations of Cryptocarya moschata, 22 loci (55%) presented significant positive deviations (heterozygote deficit, en-dogamy) in relation to the HWE proportions, while 11 (27,5%) presented significant negative deviations (excess of het-erozygotes, systematic avoidance of consanguine mating within subdivisions) and 7 loci (17,5%) presented themselves in equilibrium (random matings). As pointed out by Weir (1996), values of f can be nulls, as in the case of loci under HWE, positives, as in the case of loci under Wright’s ge-netic equilibrium (which results from the same conditions that promote the HWE, but the outcrossing rates that can be smaller than 1), or even negatives, as in the case of loci under favourable selection to heterozygotes.
Nowadays, according to Coelho (2002), there are co-pious publications that present the genetic characterization of natural populations, with many of them using estimated values of the intrapopulation fixation index from data of different loci. Generally, the evaluation of those results has demonstrated that the values are highly variable among loci even when measured in the same group of individuals, sug-gesting that other factors, besides those described in Wright’s genetic equilibrium, must be operating. Several authors have proposed an explanation for this phenomenon. Charlesworth (1991), for instance, ascribed such variations to effects of genotypic disequilibria present among loci in populations of mixed mate system, with intermediate levels of endogamy (f values between 0 and 1), joined to different selective forces in different genomic regions.
Likewise, in figure 3 the
θ
P (FST) mean estimates arepresented for the 11 populations. It has been observed that all loci (40) proved to be significantly positive. This high divergence can be attributed to the Wahlund effect, as pointed out for C. aschersoniana by Moraes & Derbyshire
(2002). The overall estimate of
θ
P (0.285) was typical ofanimal-pollinated, mixed selfing and outcrossing plant spe-cies (mean FST = 0.22; Frankham et al. 2002), which is the case for C. moschata (Moraes & Monteiro 2002).
According to figure 4, in which the mean values of
F (FIT) to the C. moschata populations are displayed, it can be proved that 28 loci (70%) presented FIT values that were significantly positive, pointing to systematic subdivision, whether into demes (FIS = 0 and FIT = FST) or into inbred groups, while 6 (15%) presented significantly negative val-ues, indicating little or no systematic subdivision and pre-vailing avoidance of consanguine mating (Wright 1969), and another 6 loci showed values not significantly different from zero. Among the various factors that can promote an F es-timate different from zero, endogamy, assortative matings, populational subdivision and selection are the most impor-tant according to Nei (1987). The analysis of population structure indicated that the subpopulations did not form a single panmitic unit with free gene flow throughout the geo-graphic range of the sampled populations.
The estimate of the number of migrants per
genera-tion for the populagenera-tional set resulted in Nˆmof 0.55, with a
neighbourhood size (
N
ˆ
b) of 3.46 individuals, from thefor-mula to a stepping-stone model (Slatkin & Barton 1989). The values of Nm and Nb determine if the genetic drift per se can produce substantial genetic variability among loca-tions. If Nm is greater than 1.0, the gene flow will be high enough to avoid a differentiation due to the drift, as the ones found for some pairs of populations (R and PECB-SB [1.03], PECB-R and PEI-NS [1.05], for example), on table 3. In this study, the mean number of migrants per gen-eration (Nˆm) was significantly inferior to 1.0, indicating that the gene flow is not enough to avoid a populational differentiation due to genetic drift, and can be considered relatively low when compared to the values obtained from other tropical Angiosperm trees. The number of parents that exchange genes randomly is approximately 3.5 indi-viduals, whereas a lower number of individuals in the same area unit (surface) would entail an increase in the diver-gence between neighbourhoods. These estimated param-eters were also smaller than those calculated by Moraes et al. (1999) from PECB-S, PECB-SB, PESM-NP and PESM-NSV populations, since the divergence among present popula-tions was considerably higher.
13 Moraes, P. L. R. & Derbyshire, M. T. V. de C. - Biota Neotropica, v4 (n1) - BN00404012004
(1979) demonstrated that perennial, longevous tree species had showed the highest levels of isoenzymatic variability. According to the authors, longevity could guarantee that many generations would be represented in those popula-tions., since each generation would be related to different selection pressures, from which a great variety of geno-types could be maintained. Although the spatial genetic structure would be a result of natural selection, Wright (1951) and others had showed that a genetic subdivision would be caused by a restricted gene flow and a small effective popu-lation size. From the Shifting Balance Theory (Wright 1932), a populational subdivision into small groups (demes), with low gene flow in their midst, would result in a fast differen-tiation due to drift. However, as pointed out by Sork at al. (1999), this approach for estimating indirectly the gene flow from FST provides little insight into the landscape-level pro-cesses that differentially may affect spatial patterns of ge-netic structure and rates of gene flow among individual populations, because FST is a summary statistic for a set of populations.
From the estimate values of Nb, the neighbourhood areas were estimated for the populations with data on den-sity of individuals, arriving at an average for the species, based on the afore mentioned areas. The area was 2,883 m2,
for PECB-S, taking a density of 12 reproductive individuals.ha-1 into account. As for PEI-NS the area was
2,247 m2, with a density of 15.4 ind.ha-1. For EEPA the area
was 3,460 m2, with a density of 10 ind.ha-1. For PEC the area
was 2,000 m2, with a density of 17.3 ind.ha-1. For PESM-NP
the area was 4,613 m2, with a density of 7.5 ind.ha-1 and, for
PESM-NSV, the area was 17,300 m2, with a density of 2
ind.ha-1. Consequently, the area of average neighbourhood
found was 5,417.17 m2, from
θ
ˆ
P. It means that circa 6.4 reproductive individuals.ha-1 would be necessary tomain-tain the actual genetic structure for the populations of C. moschata investigated, in mean terms (corresponds to the calculation of the harmonic mean of density).
The values of
θ
ˆ
P, calculated among the pairs of popu-lations, can be found on table 3 and are all significantlydifferent from zero. One can conclude that several
θ
ˆ
P val-ues are discrepant in relation to what could be expected from the geographical distances among the pairs of popula-tions. By the two-dimensional stepping-stone model (i.e., nearest neighbor dispersal), it might reasonably be expected that subpopulations which never exchange migrants should not exhibit much higher FST values than those that do (Rousset 1997), as what was found for the T andPECB-R (
θ
ˆ
P=0.259) and PECB-T and PESM-NP (θ
ˆ
P=0.416) popu-lations, for example. Likewise, based on a classical isolation by distance model, where gene flow is considered solely interms of gene exchange during mating, an increase of
θ
ˆ
P would be expected with the increase of the distance among the pairs (Raybould et al. 1996).Unlike the island model, the isolation by distance model incorporates spatial information and thus permits tests of hypotheses about relationships between the effective migration rate and spatial patterns of interpopulation con-nectivity (Sork et al. 1999). In order to test the isolation by distance model, a nonparametric test of the two matrixes of distances was carried out. For the C. moschata populations, the value obtained for the Mantel coefficient (Z) among the logarithms matrixes of the geographic distances and the number of migrants per generation (Nm) was -46.60, with the probability (P = 0.6338) of error in rejecting the null hy-pothesis of independence, based on 10,000 permutations, thus indicating that there is no isolation by distance among the populations of C. moschata analysed. In the same way, based on the graph in logarithm scale for Nˆmversus the
geographic distance (figure 5), an approximately linear re-gression was expected for a population in equilibrium, with restricted dispersion. However, the regression coefficient was -0.025, with the Y intercept explaining no more than 0.75% of the log (Nˆm) total variance, through regression,
demonstrating once again that the pattern obtained does not point to a tendency of the species to present isolation by distance, being in equilibrium with migration and drift.
14 Moraes, P. L. R. & Derbyshire, M. T. V. de C. - Biota Neotropica, v4 (n1) - BN00404012004
different to any of the proposed models that can be found in literature. It is also worth to mention that these estimates of indirect gene flow from FST are historical and do not re-flect contemporary variation in gene exchange among popu-lations or current changes to dispersal processes (Sork et al. 1999).
On table 4, it is observed that, in an intrapopulational context, for the sampling of C. moschata individuals from PECB-S, 34 sampled individuals represented an Ne of 31.78 individuals. Likewise, the effective sizes found for the sam-plings of the remaining populations showed that there was an adequate genetic representativeness of the samples ob-tained, from the allele frequencies of the analysed loci, from those with low values of fˆ. Therefore, from the formula
) ˆ 1 /( N
ˆ
e fN
= + , one can also observe that endogamyre-duces the effective population size, and the negligible value
found for fˆcauses
N
ˆ
e to be practically the same as thenumber of individuals sampled, as presented by Vencovsky (1997).
In a metapopulation context, taking the 11 popula-tions sampled for the species (populapopula-tions as sampling units), considering it consists of infinite populations, the effective population size that resulted was of 17.07 indi-viduals, for the 335 sampled. For the limit, with CP = 0 and N being sufficiently large, Ne→ (0,5 P)/θ, equaled 19.29 indi-viduals. Thus the sampling carried out for the species cor-responded to 88.44% of the maximum effective size obtained
from the 11 populations with a
θ
ˆ
P of 0.285, representing only 5.09% of the individuals sampled. However, it is clear that the effective size obtained for the species was consid-erably small, given that the divergence among populations was relatively high, showing that the sampling of different populations is an important strategy, even when the diver-gence among them is relatively small, as pointed out by Vencovsky (1997) and analysed for the C. moschata popu-lations by Moraes et al. (1999) and for the C. aschersoniana populations by Moraes & Derbyshire (2002).In summary, the present study of genetic structure of natural populations of Cryptocarya moschata revealed a higher interpopulation genetic diversity than what was ob-tained previously, and it was suggested that this is because restricted gene flow which has promoted that the correla-tion among allelic frequencies from different individuals of
the same population (
θ
P) was basically a measure of ran-dom drift due to endogamous mating in populations, and probably random differences in the founding individuals within and among populations (Wahlund effect). Moreover, both isolation by distance and stepping stone models wereinadequate to explain the results, which suggested that a random model of gene flow, or a classical metapopulation model, could be more suitable. Overall, populations that presented relative high intrapopulational fixation indexes ( fˆ) showed losses in genetic representativeness from 11%
(SE) to almost 19% (EEJI-NA). Although there was an in-crease of 15% in genetic representativeness of the sam-pling procedure related to the maximum effective popula-tion size for the species as a whole, there was an improve-ment of only 0.09% in genetic representativeness for the total number of individuals sampled, compared to what was obtained from the previous work. Thus, it was demonstrated that the high genetic divergence found among C. moschata populations could be a current characteristic of the species evolutionary dynamics, which indicates that the in situ con-servation of the species must encompass large areas of Atlantic rain forest. This scenario has been probably real-ized in the extensive reserves of the State Parks of São Paulo. However, since the smallest populations have also showed genetic diversities as high as the largest ones, their man-agement in the future should be also important in order to avoid detrimental effects and losses of variability caused by endogamy and/or genetic drift.
4. Acknowledgements
To “Instituto Florestal de São Paulo”, “Fundação Florestal”, “Instituto Agronômico de Campinas” and to “Superintendência da IMBEL”, for permission of collection in the respective areas, in their custody. To Marco Aurélio Nalon for constructing the figure 1. To Fernando H. Romano and Mariana C. Daher for their laboratory assistance. A special word of thanks to three anonymous reviewers for their criticism, and to Angela M. Vasconcellos for her sup-port with the manuscript translation into English.
5. References
ALFENAS, A.C., PETERS, I., BRUNE, W. & PASSADOR, G.C. 1991. Eletroforese de proteínas e isoenzimas de fungos e essências florestais. Universidade Federal de Viçosa, Impr. Univ., Viçosa.
BELKHIR, K., BORSA, P., CHIKHI, L., RAUFASTE N. & BONHOMME, F. 1996-2002. GENETIX 4.04, logiciel sous WindowsTM pour la génétique des populations.
Laboratoire Génome, Populations, Interactions, CNRS UMR 5000, Université de Montpellier II, Montpellier (France). (http://www.univ-montp2.fr/~genetix/genetix/ genetix.htm)
15 Moraes, P. L. R. & Derbyshire, M. T. V. de C. - Biota Neotropica, v4 (n1) - BN00404012004
BUCKLEY, D.P., O’MALLEY, D.M., APSIT, V., PRANCE, G.T. & BAWA, K.S. 1988. Genetics of Brazil nut (Bertholletia excelsa Humb. & Bonpl.: Lecythidaceae). 1. Genetic variation in natural populations. Theor. Appl. Genet. 76:923-928.
CAVALHEIRO, A.J. & YOSHIDA, M. 2000. 6-[ω -arylalkenyl]-5, 6-dihydro-α-pyrones from Cryptocarya moschata (Lauraceae). Phytochemistry 53:811-819. CHARLESWORTH, D. 1991. The apparent selection on
neu-tral marker loci in partially inbreeding populations. Genet. Res. 57:159-175.
COCKERHAM, C.C. & WEIR, B.S. 1993. Estimation of gene flow from F-statistics. Evolution 47:855-863.
COELHO, A.S.G. 2002. Abordagem Bayesiana na análise genética de populações utilizando dados de marcadores moleculares. ESALQ/USP, Piracicaba. 76 p. PhD Thesis. http://www.teses.usp.br/teses/disponiveis/11/11137/ tde-30102002-163254/.
COE-TEIXEIRA, B. 1965. Lauráceas do Estado de São Paulo - II: Cryptocarya. Arq. Bot. São Paulo 4(1):3-8.
EGUIARTE, L.E., BURQUEZ, A., RODRÍGUEZ, J., MARTÍNEZ-RAMOS, M., SARUKHÁN, J. & PIÑERO, D. 1993. Direct and indirect estimates of neighbourhood and effective population size in a tropical palm, Astrocaryum mexicanum. Evolution 47:75-87.
FRANKHAM, R., BALLOU, J.D & BRISCOE, D.A. 2002. Introduction to Conservation Genetics. Cambridge Uni-versity Press, Cambridge.
GOTTLIEB, L.D. 1977. Electrophoretic evidence and plant systematics. Ann. MO Bot. Gard. 64:161-180.
GOUDET, J. 1995. FSTAT (version 1.2): a computer program to calculate F-statistics. J. Hered.86:485-486.
GOUDET, J. 2002. FSTAT, a program to estimate and test gene diversities and fixation indices (version 2.9.3.2). Available from http://www.unil.ch/izea/softwares/ fstat.html. Updated from Goudet (1995).
GUO, S.W. & THOMPSON, E.A. 1992. Performing the exact test of Hardy-Weinberg proportion for multiple alleles. Biometrics 48:361 372.
HALL, P., ORRELL, L.C. & BAWA, K.S. 1994. Genetic diver-sity and mating system in a tropical tree, Carapa guianensis (Meliaceae). Am. J. Bot. 81:1104-1111. HAMRICK, J.L. & GODT, M.J. 1990. Allozyme diversity in
plant species. In Population genetics, breeding and germplasm resources in crop improvement (A.H.D. Brown, M.T. Clegg, A.L. Kahler & B.S. Weir, eds.). Sinauer, Sunderland, MA, p. 43-63.
HAMRICK, J.L., LINHART, Y.B. & MITTON, J.B. 1979. Re-lationships between life history characteristics and eletrophoretically detectable genetic variation in plants. Ann. Rev. Ecol. Syst. 10:173-200.
JOLY, C.A., AIDAR, M.P.M., KLINK, C.A., McGRATH, D.G., MOREIRA, A. G., MOUTINHO, P., NEPSTAD, D.C., OLIVEIRA, A.A., POTT, A., RODAL, M.J.N. & SAMPAIO, E.V.S.B. 1999. Evolution of the Brazilian phy-togeography classification systems: implications for biodiversity conservation. Ciência e Cultura 51:331-348. (http://www.ib.unicamp.br/institucional/departamentos/ botanica/labs/eco/ccultura1.html)
KOSTERMANS, A.J.G.H. 1937. Revision of the Lauraceae II. The genera Endlicheria, Cryptocarya (american spe-cies) and Licaria. Med. Bot. Mus. Herb. Rijk. Univ. Utrecht 42:500-609.
KOSTERMANS, A.J.G.H. 1938. Revision of the Lauraceae III. The genera Aiouea, Systemonodaphne, Urbanodendron, Mezilaurus; additions and corrections to Licaria and Cryptocarya. Recueil. Trav. Bot. Néerl. 35:56-129.
KOSTERMANS, A.J.G.H. 1957. Lauraceae. Reinwardtia 4:193-256.
MANLY, B.F.J. 1985. The statistics of natural selection on animal populations. Chapman and Hall, London. MANTEL, N. 1967. The detection of disease clustering and
generalized regression approach. Cancer Res. 27:209-220. MILLER, M.P. 1997. Tools for population genetic analyses (TFPGA) 1.3: a Windows program for the analysis of allozyme and molecular population genetic data. Com-puter software distributed by author. (http://bioweb.usu.edu/mpmbio/tfpga.htm)
MORAES, P.L.R. & ALVES, M.C. 1997. Biometria de frutos e sementes de Cryptocarya moschata Nees, Ocotea catharinensis Mez e Endlicheria paniculata (Sprengel) MacBride (Lauraceae). Bol. Mus. Biol. Mello Leitão (N. Sér.) 6:23-34.
MORAES, P.L.R. & ALVES, M.C. 2002. Biometria de frutos e diásporos de Cryptocarya aschersoniana Mez e Cryptocarya moschata Nees (Lauraceae). Biota Neotropica 2 (1). (www.biotaneotropica.org.br/v2n1/ pt/abstract?article+BN01302012002 )
MORAES, P.L.R. & DERBYSHIRE, M.T.V.C. 2002. Estrutura genética de populações naturais de Cryptocarya aschersoniana Mez (Lauraceae) através de marcadores isoenzimáticos. Biota Neotropica 2(2). (http://www.biotaneotropica.org.br/v2n2/pt/ fullpaper?bn02402022002+pt)
MORAES, P.L.R. & GARDINGO, J.R. 1996. Chromosome number of Cryptocarya moschata Nees & Martius ex Nees (Lauraceae). Rev. Bras. Genét. (Suppl.) 19:135. MORAES, P.L.R. & MONTEIRO, R. 2002. Taxas de
16 Moraes, P. L. R. & Derbyshire, M. T. V. de C. - Biota Neotropica, v4 (n1) - BN00404012004
MORAES, P.L.R., MONTEIRO, R. & VENCOVSKY, R. 1999. Conservação genética de populações de Cryptocarya moschata Nees (Lauraceae) na Mata Atlântica do estado de São Paulo. Rev. Bras. Bot. 22:237-248. ( h t t p : / / w w w . s c i e l o . b r / s c i e l o . p h p ? s c r i p t = s c i _ a b s t r a c t & p i d = S 0 1 0 0 -84041999000500004&lng=en&nrm=iso)
MORAES, P.L.R., MONTEIRO, R. & VENCOVSKY, R. 2002. Genetic differentiation and diversity of natural popula-tions of Cryptocarya spp. (Lauraceae) from the Brazil-ian Atlantic rain forest. LundBrazil-iana 3(2):99-109.
NASON, J.D., PRESTON, A.R. & HAMRICK, J.L. 1997. Dis-persal and dynamics of genetic structure in fragmented tropical tree populations. In Tropical forest remnants; ecology, management, and conservation of fragmented communities (W.F. Laurence & R.O. Bierregaard, eds). The University of Chicago Press, Chicago, p.304-320. NEI, M. 1978. Estimation of average heterozygosity and
genetic distance from a small number of individuals. Genetics 89:583-590.
NEI, M. 1987. Molecular evolutionary genetics. Columbia University Press, New York.
NEVO, E. 1978. Genetic variation in natural populations: patterns and theory. Theor. Pop. Biol. 13:121-177. PEAKALL, E. & SMOUSE, P.E. 2001. GenAlEx V5: Genetic
Analysis in Excel. Population genetic software for teach-ing and research. Australian National University, Canberra, Australia. http://www.anu.edu.au/BoZo/ GenAlEx/
RAYBOULD, A.F., GOUDET, J., MOGG, R.J., GLIDDON, C.J. & GRAY, A.J. 1996. Genetic structure of a linear popula-tion of Beta vulgaris ssp. maritima (sea beet) revealed by isozyme and RFLP analysis. Heredity 76:111-117. RAYMOND, M. & ROUSSET, F. 1995. GENEPOP (Version
1.2): population genetics software for exact tests and ecumenicism. J. Hered. 86:248-249. (http:// wbiomed.curtin.edu.au./genepop/index.html)
ROBINSON, I.P. 1998. Aloenzimas na genética de populações de plantas. In Eletroforese de isoenzimas e proteínas afins: fundamentos e aplicações em plantas e microrganismos (A.C. Alfenas, ed.). Editora UFV, Viçosa, p.329-380.
ROCHA, O.J. & LOBO, J.A. 1998. Genetic diversity and out-crossing rates in the guanacaste tree (Enterolobium cyclocarpum Jacq.) in the dry forests of Costa Rica. In Recent Advances in Biotechnology for Tree Conserva-tion and Management, Proceedings of an IFS Workshop. International Foundation for Science (IFS), Stockholm, p.65-81.
ROUSSET, F. 1997. Genetic differentiation and estimation of gene flow from F-Statistics under isolation by distance. Genetics 145(4):1219-1228.
SCANDALIOS, J.G. 1965. Genetic isozyme variations in Zea mays. University of Hawai, Honolulu. (PhD Thesis). SLATKIN, M. 1993. Isolation by distance in equilibrium and
non-equilibrium populations. Evolution 47:264-279. SLATKIN, M. & BARTON, N.H. 1989. A comparison of three
indirect methods for estimating average levels of gene flow. Evolution 43:1349-1368.
SOKAL, R.R. 1979. Testing statistical significance of geo-graphic variation patterns. Syst. Zool. 28:227-232. SOKAL, R.R. & ROHLF, F.J. 1995. Biometry. The principles
and practice of statistics in biological research, 3rd ed. W.H. Freeman and Co., New York.
SORK, V.L., NASON, J., CAMPBELL, D.R. & FERNANDEZ, J.F. 1999. Landscape approaches to historical and con-temporary gene flow in plants. Trends Ecol. Evol. 14:219-224.
SOUSA, V.A. 2001. Population genetic studies in Araucaria angustifolia (Bert.) O. Ktze. Cuvillier Verlag, Göttingen. VATTIMO, I. 1957. “Lauraceae” do estado do Rio de Janeiro. Parte 1. Espécies do Monte Sinai, Governador Portela. Arq. Jard. Bot. Rio J. 15:115-159.
VATTIMO, I. 1966. Notas sôbre o gênero Cryptocarya R.Br. no Brasil (Lauraceae). Rodriguésia 25(37):219-237. VENCOVSKY, R. 1997. Biometrical approaches for
molecu-lar markers: estimation of effective population size. In International Workshop on Agricultural Biotechnology, 1997. Proceedings. ESALQ-USP, Piracicaba, Cook Col-lege - New Jersey Agricultural Experiment Station, The State University of New Jersey, Rutgers.
WRIGHT, S. 1932. The roles of mutation, inbreeding, cross-breeding, and selection in evolution. Proc. 6th Int. Cong. Genet. 1:356-366.
WRIGHT, S. 1951. The genetical structure of populations. Ann. Eugen. 15:323-354.
WRIGHT, S. 1969. Evolution and the genetics of popula-tions. v.2. The theory of gene frequencies. The Univer-sity of Chicago Press, Chicago.
WRIGHT, S. 1978. Evolution and the genetics of popula-tions. v.4. Variability within and among populapopula-tions. The University of Chicago Press, Chicago.
Title: Genetic structure of natural populations of Cryptocarya moschata Nees (Lauraceae) from south-eastern Brazilian Atlantic rain forest
Authors: Pedro Luís Rodrigues de Moraes & Maria Teresa Vitral de Carvalho Derbyshire
Biota Neotropica, Vol. 4 ( number 1): 2004
h t t p : / / w w w. b i o t a n e o t r o p i c a . o rg . b r / v 4 n 1 / p t / abstract?article+BN00404012004