Closed Rotor-Stator System
ABDUL FATTAH ABBASI*, MUJEEBUDDIN MEMON**, AND AHSANULLAH BALOCH*** RECEIVED ON 05.05.2011 ACCEPTED ON 01.12.2011
ABSTRACT
This paper describes the numerical predictions of isothermal closed rotor-stator flows. Steady-state finite-difference solutions are sought for two gap ratios and two rotational Reynolds number in the axisymmetric cylindrical polar coordinate frame of reference. Low Reynolds number models, low Reynolds number k-εεεεε and second moment closure models have been used to compute the necessary description of the flow inside the rotor-stator system without superpose flow. The most important dissimilarities among the computational calculations of both the turbulence models obtain at the lower radial locations, where k-εεεεε model predicted the premature transitional predictions from laminar to turbulent flow. The major feature of this computational work is the emergence of four regions of the flow i.e. source, sink and two boundary layers. Computed velocity components of both models are compared against the experimental measurements. Low Reynolds number second moment closure shows the improved level of matching with data, particularly on apex of the boundary layers and recirculating core in the middle of the rotor-stator cavity.
Key Words: Closed Rotor-Stator System, Low Reynolds Number Second Moment Closure.
* Assistant Professor, Department of Mechanical Engineering, Mehran University of Engineering & Technology, Jamshoro. * * Professor and Principal, Mehran University College of Engineering & Technology, Khirpur Mirs.
*** Professor, Department of Basic Sciences and Related Studies, Mehran University of Engineering & Technology, Jamshoro.
G
as turbine engines are extensively used for the elevated power generation and high thermal efficiencies, in particular turbo jet engines and power producing stations. The succeeding use of these engines provided the incessant progress in the performance, consequent of that the operating conditions of the engine have been amplified and inlet temperature and pressure ratios have been enhanced, 1200-1900K and 6:1-40:1 [1] respectively. This high heating operation increase the temperature of different parts like turbine blades, nozzle guide vanes and rotating discs, consequently reduces the fatigue life of these parts. Toget rid of the overheating issue and increase the working life of heat exposed components, a lot of research work has been carried out for the improvement of materials composition and designing of efficient engine cooling system. Both the concepts are very helpful for the safe and continuous working of gas turbine engines. The study of materials composition is beyond the scope of this research, while, computational predictions of internal air cooling system has been focused in this study. Particularly, much concentration has been provided to the secondary air cooling system of turbomachinery, in which the two-disc flow forms a model problem for rotor-stator flows.
The actual engine geometry is so complicated to model for the computational predictions; therefore, it is modelled through the simplified geometrical configurations to predict the correct fluid flow behaviour inside the closed rotor-stator system as shown in Fig. 1.
In the present work two models: low Reynolds number second moment closure of Memon, [1] and the low Reynolds number k-ε model of Morse, [2] have been adopted for computational predictions in closed rotor-stator system at isothermal conditions. The computational results of two models have been validated through the experimental data of Itoh, et. al. [3] and Kilic, et. al. [4]. Both the models performed well and show the basic flow structure inside the rotor-stator cavity, which justified the formation of four flow regions [1]. Furthermore, the computed radial and tangential velocity components illustrate the identical nature of variation as noted in the computed flow structure. The main discrepancies between the computations of two models have been observed in the tangential velocity components at lower radial location.
2.
PROBLEM SPECIFICATION AND
BOUNDARY CONDITIONS
The real engine geometries are very complicated and difficult to simulate, therefore, these geometries are presented in a simple plane disc geometrical configurations as mentioned in schematic diagram (Fig. 1). These geometries can bestow the basic features for the flow and heat transfer in closed rotor-stator cavity. The shroud was
supposed to be fixed with the stator disc and worked as a stator, while the right-hand disc is moving and worked as a rotor. Two cases are investigated according to the experimental data available for such cases. Following are the specifications and boundary conditions for both the cases.
Case-1: This case is related to the experimental work of Itoh, M., et. al. [3]. In this case the rotational speed of rotor is Reθ=106 and gap ratio G=0.08 based on the axial distance between the rotor and stator discs (s=0.02m) and the outer diameter of rotor (b=0.25m) as shown in Fig. 1.
Case-2: Second case of closed rotor-stator is presented according to the experimental work of Kilic, M., et. al. [4]. The formation of the cavity is the same as for the previous case with geometric dimensions, s=0.047m, b=0.391m, G=0.12 and value of rotational Reynolds number is Reθ=1x10⁵.
2.1
Boundary Conditions
The simple geometry for the closed rotor-stator system is shown in the Fig. 1 and assumed that the flow is steady, incompressible and axisymmetric. In these cases, there is no inflow and radial outflow inside the discs space, however, very small radial clearance between shroud and rotor Sc=0.00637, which is not shown in Fig. 1. When system is closed geometry, obviously flow boundary conditions at inlet and outlet equal to zero at constant inlet temperature of 20oC. In general, the boundary conditions for these cases may be written as follows:
U=V=W=0 at z=0
U=V=0, W=Ωr at z=s
U =V=W=0 at r=0
U=V=W=0 at r=b
In the above conditions, U, V and W are the mean velocities in axial, radial and tangential directions respectively, whereas, b, r, s and z are the outer radius, radial distance, disc spacing and axial distance respectively.
Shroud
Stator b
Rotor
Ω s
3.
COMPUTATIONAL PROCEDURE
3.1
Turbulence Models
Two turbulence models have been adopted for numerical predictions. These models can be categorised according to the modelling of the Reynolds stress components which are emerged during time-averaging process of Navier stokes equations.
3.1.1
Low Reynolds number k-
εεεεε
Model
In the first approach, a well known two equation mean flow closures (low Reynolds number k-ε model) of Morse, [2], which is depend on the model of Jones, et. al. [5-6] has
been adopted for the predictions. This model solves
turbulence quantities through the gradient transport
hypothesis procedure, which is based on the transport
equation for the kinetic energy (k) and its dissipation rate (ε).The hypothesis, which is based on the isotropic eddy viscosity assumption has been used for the determination of the isotropic eddy viscosity (μT), and the turbulent stresses as:
⎟
⎟
⎠
⎞
⎜
⎜
⎝
⎛
∇ δ − ∂ ∂ + ∂ ∂ μ − ρ δ =ρ 2 3 ij .V
i x j U j x i U T k ij 3 2 j u i u (1)
where Δ.V is the divergence of the velocity vector:
r V r V z U V . + ∂ ∂ + ∂ ∂ = ∇ (2)
2/2δij= Normal stresses (i.e. i=j only)
3.1.2
Low Reynolds Number Second
Moment Closure
In this Reynolds stress model, the supposition of an-isotropic eddy viscosity is not considered and the transport equations in near wall region are resolved for each Reynolds stress component, the so-called Reynolds stress closure. Further details of these models are described in Memon, [1], Morse, [2] and Long, et. al. [7].
The leading transport equations for the conservation of
momentum and energy are describe as axisymmetric,
steady and in the cylindrical polar-coordinate system for
a general variable Φ:
( )
(
)
sr r , r r r 1 z z , z V r r r 1 U z Φ + ∂ Φ ∂ Φ Γ ∂ ∂ + ∂ Φ ∂ Φ Γ ∂ ∂ = Φ ρ ∂ ∂ + Φ ρ ∂ ∂ ⎟ ⎠ ⎞ ⎜ ⎝ ⎛ ⎟ ⎠ ⎞ ⎜ ⎝ ⎛ (3)
with the continuity equation:
( )
( )
r V 0r r 1 U
z ∂ ρ =
∂ + ρ ∂ ∂ (4) source terms:
( )
r uv r r 1 2 u x x P U s ρ ∂ ∂ − ρ ∂ ∂ − ∂ ∂ −=
⎜
⎝
⎛
⎟
⎠
⎞
(5a)( )
( )
r 2 w r 2 W 2 r V uv x 2 v r r r 1 r P Vs ρ −μ +ρ +ρ
∂ ∂ − ρ ∂ ∂ − ∂ ∂ − = (5b)
( )
(
r2vw)
r r 1 uw r x r W s ρ ∂ ∂ − ρ ∂ ∂ − = (5c)
where the ΓΦ,z, ΓΦr are the diffusivities terms in z-r direction and SΦ is a source term.
3.2
Numerical Method
The computations are carried out by implementing TEACH method, which is depend on Finite Volume Method with the line-by-line method. A TDMAN (Tri-Diagonal Matrix Algorithm) is adopted to determine the discretised transport equations. The variables of transport equations are calculated at the main grid node points, while, the momentum equations in axial and radial direction are solved by the staggered grid arrangement of Harlow, et. al. [8]. To upgrate and couple the pressure-velocity field and to assure the mass continuity, the SIMPLEC algorithm of Van Doormal, et. al. [9] has been
To obtain the numerical solution, the governing equations are changed into the discrete algebraic form. During transformation process, the unknown values of the variable appeared in the algebraic equations that are required to be discretized at a finite number of grid points of the calculation domain.
To evaluate these unknown variables, the finite volume approach of Patankar, et. al. [10] has been adopted. The schemes, which are adopted in the present work, are HYBRID Scheme, Second-order Linear Upwind Differencing Scheme HOUS and combinations of both.
3.3
Grid Arrangement
To maintain the strong and stable coupling between the velocity and pressure fields a staggered grid arrangement of Harlow, et. al. [8] has been adopted. In this grid arrangement, the axial and radial velocity components are stretched from its main grid nodes to the control volume faces, which help in the maintaining of pressure driving force between the adjacent nodes of the velocity. Otherwise, pressure gradient components are evaluated at the alternate grid points rather than adjacent nodes. In such situation there is no importance of pressure at the central point and it will vanish [1].
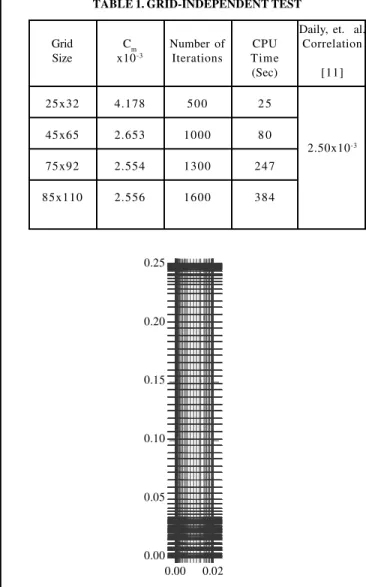
Furthermore, the non-uniform grid arrangement has been used for the accurate and economical solutions. The non-uniform grid is a combination of two-grid arrangement: finer at the close-wall region and coarser at the middle core area as shown in Fig. 2. The closest off-wall node
distance kept y+<0.5 ensuring a fine distribution of the
nodes in the near-wall region [1]. A grid-independence test was conducted for the computed moment coefficients according to the Daily, et. al. [11] correlations, Memon, [1] also employed the series of meshes for the grid independents solution.
In this regard four meshes made of 25x32, 45x65, 75x92 and 85x110 nodes in axial and radial directions respectively have been employed. The Computed
moment coefficients for all the finer grid arrangement 45x65, 75x92 and 85x100 show the same behaviour except coarser one 25x32 as shown in Table 1. The grid arrangement 75x92 shows the closer agreement with Daily, et. al. [11] moment coefficient correlation with respect to number of iterations and CPU time consumption. Though small size meshes consume less time, but do not reproduced the correct values of computed moment coefficient, while the large size meshes reproduced the exact values of moment coefficient on the cost of higher number of iterations and CPU time as shown in Table 1. Therefore, 75x92 grid arrangement is best suited meshing for this particular work.
0.00 0.02 0.00
0.05 0.10 0.15 0.20 0.25
FIG. 2. NON-UNIFORM GRID ARRANGEMENT
TABLE 1. GRID-INDEPENDENT TEST
Daily, et. al. Grid Cm Number of CPU Correlation Size x10-3 Iterations Time
(Sec) [11]
25x32 4.178 500 2 5
45x65 2.653 1000 8 0
2.50x10⁻³
75x92 2.554 1300 247
4.
DISCUSSION OF NUMERICAL
RESULTS
4.1
Computed Flow structure
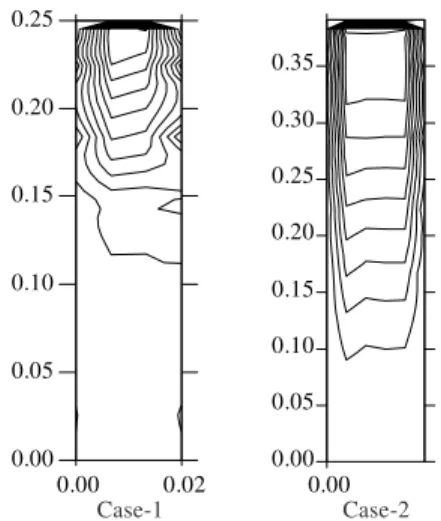
Fig. 3 shows the computed flow structures for closed rotor-stator system according to the geometric dimension of Itoh, et. al. [3] and Kilic, et. al. [4] at the different
rotational speeds, Reθ=106 and Re
θ=105 respectively. The
differential rotation of the two discs resulted recirculating nature of flow structure, which is driven by the imbalance between the centrifugal forces across the two discs. The fluid centrifuged out in the vicinity of the rotating disc, which is driven by viscous shear and secondary flow in the cavity due to rotational effects. The secondary flow generally consists of four flow regions: source, central core and two boundary layers, one outward along the upstream disc (rotor) and other inward along the downstream disc (stator), depending on the values of the aspect ratio and Reynolds number. Among the boundary layers recirculating structure has been formed in which radial velocity component approximately equal to zero. It can be seen that for higher rotational speed
Reθ=1x10⁵, the change of flow from laminar to turbulent
occurs earlier and the boundary layer thickness increases with the radius, whereas, for the lower rotational speed and high gap ratio, the behaviour of flow is laminar in the entire cavity with thinner boundary layers on rotor-stator discs and developed a recirculating core region in between the boundary layers. The earlier development of rotor boundary layer at higher rotational speed formed the recirculating flow pattern in the vicinity of two discs, which justified the basic flow structure and same trends have been observed in the corresponding theoretical and experimental works: Morse, [12] conducted numerical study for a range of Reynolds number and assessed its influence on the computed flow structure and he found
that at lower rotational Reynolds number (Reθ=1x10⁵) the
computed flow structure was completely laminar, Lygren, et. al. [13] carried out predictions in rotor-stator cavity at lower Reynolds number and observed no turbulence
effects at lower rotational speed, Serre, et. al. [14-15] pointed out that for lower speed and lower flow rate the radially outward laminar flow was formed parallel to the walls, Jacques, et. al. [16] also noted that for moderate Reynolds number the rotor boundary is approximately steady and higher order of turbulence was found on stator boundary layer and Tuliszka-Sznitko, et. al. [17-18] presented the 3D LES (Large Eddy Simulation) study for varying rotational Reynolds number and they revealed the laminar boundary layer on the rotor disc at lower rotational Reynolds number, Poncet, et. al.[19] conducted experimental and numerical work for rang of parameters and they pointed out that at weak flow the computed flow structure retained characteristics of a closed rotor-stator flow. Recently, Owen, [20] discuss the EI (Externally Induced) and RI (Rotationally Induced) ingress problems on the bases of radial pressure gradient in the rotor-stator system.
Furthermore it is observed that at high rotational speed and smaller gap the fluid departed earlier from the core region and rapidly changed from laminar to turbulent. Based on the above argument it is revealed that the gap ratio and rotational Reynolds number are the important parameter, which show the significant effect on the fluid flow behaviour inside the closed rotor stator cavity.
0.00 0.02 0.00
0.05 0.10 0.15 0.20 0.25
0.00 0.00 0.05 0.10 0.15 0.20 0.25 0.30 0.35
Case-1 Case-2
4.2
Computed Velocity Profiles
Computational predictions of the radial and the tangential
velocity profiles for two cases, Reθ=1x10⁶ and G=0.08 and
Reθ=1x10⁵, G=0.12 are presented in Fig. 4(a-d), Fig. 5(a-b)
respectively. The computational results are validated with the relevant data of Itoh, et. al. [3] and Kilic, et. al.[4] at different radial locations. The measurements and the predictions illustrate their agreement with conventional trend of the rotor-stator system.
FIG. 4(A). CASE-1 AXIAL VARIATION OF THE RADIAL AND TANGENTIAL VELOCITY FOR GAP RATIO = 0.08, FOR ROTATIONAL REYNOLDS NUMBER = 1.0E+06 AT RADIAL LOCATION (r/b) a=0.4
Fig. 4(a-d) shows a comparison between the predicted and measured radial and tangential velocity profiles for
Reθ=1x10⁶ and G=0.08 at four radial locations (r/b=0.4, 0.6,
0.8 and 0.94). The computed radial velocity components show the formation of separate boundary layers on each
disc and almost zero radial velocity in the recirculating core region between the boundary layers. Moreover, the thickness of the Ekman layers on both discs increases with radius and the peak of the rotor boundary layer decreases quickly than that of the inward flow on the
FIG. 4(C).CASE-1 AXIAL VARIATION OF THE RADIAL AND TANGENTIAL VELOCITY FOR GAP RATIO = 0.08, FOR ROTATIONAL REYNOLDS NUMBER = 1.0E+06 AT RADIAL LOCATION (r/b) c=0.8
stator side. This quicker decreased in the rotor boundary layer attributes that the transition from laminar to turbulent flow takes place earlier on the stator side than along the rotor side. Further assessing the performance of two models at radial location r/b=0.4,where the computed radial
velocity profiles by k-ε model are slightly underpredicted
at the rotor boundary layer peak and overpredicted at the stator boundary layer. This effect is more noticeable with the emergence of the thicker rotor boundary layer at r/b=0.6. This trend suggests that k- model reproduce slightly higher level turbulence at near-wall regions, whereas, the Reynolds stress model has produced marginally lower intensity of turbulence on the rotor and higher level on the stator side, which is closer to the measurements. In contrast, at the higher radial locations (r/b=0.8 and 0.94), the second moment closure predicted the higher level of turbulence along both the rotor and
stator side as compared to the k-ε model. This behaviour
of the models attributed that the low Reynolds number second moment closure model is more efficient in turbulent type flows.
For tangential velocity profiles two models show the uniform axial variation in the core region and the level of the core rotation increases with increase in radius but the most significant difference between the two models is
visible at r/b=0.4, the low Reynolds number k-ε model
predicts a higher core rotation (W/Ωr=0.4) at this radius,
in comparison to the second moment closure (W/Ωr=0.325)
and the measurements (W/Ωr=0.3) which is very close to
the prediction of latter model. These discrepancies between two models may be endorsed to the significance of laminar effects at this radial location. Daily, et. al. [11] also pointed out the same significant effects near the centre of cavity and estimated a value of the transitional local Reynolds
number ( ReL=(r/b)2 Re
θ) of 1.5x10⁵. For the present study
(Reθ=1x10⁶) the value of the local Reynolds number
corresponds to the radial location r/b=0.39. The differences
indicated by both the models near to this location (r/b=0.4)
suggest that the k-ε model compute the premature
transition from laminar to turbulent and the same difference
also noted in the corresponding predictions of the radial
velocity components at the lower radial locations. Morse, [2] and Memon, [1], obtained the same level of agreement with the measurements at this radial location.
The possible reasons of discrepancies in predictions of
the k-ε model of Morse, [2] may be the grid size,
discretization scheme or isotropic form of the model. On contrary, the low Reynolds number second moment closure for the same flow conditions shows its ability and reliability to predict the laminar flow effects at this lower radial location. This may be attributed to the correct behaviour of the turbulent shear stress as well as the correct decay rate of the turbulence intensities in the central core region (Morse, [12] and Memon, [1]) during the recirculation of flow.
Fig. 5(a-b) presents a comparison between the computed and measured velocity components (radial and tangential)
for Reθ=1x10⁵ and gap ratio G=0.12 for two radial locations
(r/b=0.6 and 0.85). The prediction of radial velocity components show the formation of separate boundary layers on rotor-stator discs, inward flow on the stator side and zero radial velocity components in the central core region between the two boundary layers. Conversely, to case-1 the thickness of the Ekman layers on both discs decreases with radius and the peak of the both the boundary layers do not show the abrupt change. This behaviour of the flow signifies that due to lower rotational
speed (Reθ=1x10⁵) and higher gap ratio (G=0.12) the flow
is less turbulent. Furthermore, assessment of two models illustrated that the computed radial and tangential velocity profiles have the same level of consistency with the data of Kilic, et. al. [4], except for stator boundary layer at radial location r/b=0.6, where both the models are overpredicted.
4.3
Computed Moment Coefficients
Conventionally models are assessed by the comparison
of the computed moment coefficients ⎜⎜⎝⎛ , = 12 Ω2 5⎟⎟⎠⎞
b M o m C
ρ ,
where M is the frictional torque on the rotor surface).
For this study two Rotational Reynolds numbers
(Reθ=1x10⁶ and Re
θ=1x10⁵) and gap ratios are used to
assess the performance of the models through the
comparison with Daily, et. al. [11] correlations. Daily, et.
al. [11] in their experimental study concluded that the
nature of the flow in the closed rotor-stator system
depends on the variation of the rotational Reynolds
FIG. 5(B). CASE-2 AXIAL VARIATION OF THE RADIAL AND TANGENTIAL VELOCITY FOR GAP RATIO = 0.12 FOR ROTATIONAL REYNOLDS NUMBER = 1.0E+05 AT RADIAL LOCATION (r/b) b=0.85
number and the gap ratio and identified four regimes of
flow in enclosed rotor-stator, where regimes I and II
correspond to merged and separated boundary layers
for laminar flow and regimes III and IV correspond to
merged and separated boundary layers for turbulent flow.
For the each regime they introduced the moment
coefficient correlations,
For the laminar flow:
Cm = 1.850G0.1Re
θ-05 (6)
For turbulent flow:
Cm = 0.051G0.1Re
θ-0.2 (7)
In the present computations, the values of the gap ratio
(G=0.08, 0.12) and rotational Reynolds number (Reθ=1x10⁶
and Reθ=1x10⁵) are considered, which are related with the
flow conditions expressed through correlation of turbulent boundary conditions. Thus the predicted moment coefficients for both the cases are compared with the correlation (11) as shown in Table 2.
For the first case (Reθ=106 G=0.08), the low Reynolds
number second moment closure overestimates 1.4% moment coefficient as compare to the Daily, et. al.
correlation measurements, whereas the k-ε model
underestimates by -11.2% than the Daily, et. al. correlation. The comparison of both the models demonstrates that the Reynolds stress model has very closer agreement with correlation of Daily, et. al. [11].
For second case of lower Reynolds number high gap ratio
(Reθ=105 G=0.12) both the models are overpredicted and
computed 22% higher moment coefficient as compared to the Daily, et. al. correlation, which shows the sensitivity of the moment coefficient to the Reynolds number as the
value has been decreased from Reθ=1x10⁶ to Re
θ=1x10⁵.
The identical trends of variation in moment coefficient were observed by Morse, [12] and Memon, [1].
The comparison of two models for varying Reynolds number verified that when the turbulence effects are dominant then the second moment closure shows the
better performance as compared to the k-ε model. This
proposed that the Reynolds stress closure is better tool to adopt for turbulent flow at higher operating conditions.
5.
CONCLUSIONS
The computational predictions were made for the close rotor-stator disc system for varying rotational Reynolds number and gap ratios by adopting two turbulence models,
k-ε model and low Reynolds number second moment
closure. The two cases of relevant experimental measurements were tested for radial and tangential velocity components and computed moment coefficients. The predictions of the models confirm the consistency with basic flow structure and the Reynolds analogy of closed rotor-stator system. The discrepancies between predictions of two models were noted for higher Reynolds number. This may be endorsed to the complex nature of the rotor-stator flows, where even for the larger value of the rotational Reynolds number, the flow behaviour within the Ekman layers is laminar on the rotor side and turbulent on the stator side at the inner part of the cavity due to the flow recirculation. The computed velocity profiles for higher Reynolds number show the development of boundary layers on both the discs; these boundary layers increased with the radius and developed the central core region between the two boundary layers where the radial velocity components are almost equal to zero. On contrary, for lower Reynolds number the thickness and peak of boundary layers decreases with radius. The noticeable differences between the predictions of radial velocity components for case-1 were found at the lower radial
TABLE 2. COMPARISON OF THE MOMENT COEFFICIENTS
Reθ k-ε Daily, et. al.
G uiuj [11]
(Cm,o) (Cm,o) (C
m,o)
0.08 106 2.220x10⁻³ 2.535x10⁻³ 2.500x10⁻³
locations, where the low Reynolds number k-ε model indicated slightly a higher level of the turbulence compared to the second moment closure and the measurements. However, for the higher locations of the cavity, the results of the both models were found to be almost identical. The significant difference was found in the predicted tangential velocity components of two models at lower radial
locations, where k-ε model predicts earlier transition from
laminar to turbulent flow. This fact has been observed in the corresponding predictions of the radial velocity
profiles. This is attributed that the k-ε model predicts
premature transition from laminar to turbulent flow at the lower radial locations. On the other hand, the low Reynolds number second moment closure estimate correct behaviour of velocity components as compared to the measurements at the same radial location.
The computed moment coefficients for varying Reynolds number confirmed that the nature of flow in the closed rotor-stator system is dependent on the rotational Reynolds number and the gap ratio. The effects of these parameters on the moment coefficients were found to be in accordance with the measured correlations of Daily and Nece for separated turbulent boundary layers.
The overall, comparisons of two models conclude that the Reynolds stress model is robust and reliable model for the computation of complex wall bounded shear flows.
6.
NOMENCLATURE
b outer radius of cavity 5
b 2 2 1 M m
C = ρΩ moment coefficient
G = s/b cavity gap ratio k turbulent kinetic energy
M frictional moment at north, south, east and west turbulence Reynolds number| rotational Reynolds number
r radial coordinate
r/b non-dimensional radial coordinate ri inner disc radius
S source term
s axial gap between the discs
Sc clearance between the disc and shroud
U,V,W mean velocity components in z,r,θ u,v,w fluctuating velocity components in z,r,θ
j u i
u Reynolds stress tensor z axial coordinate
z/s non-dimensional axial coordinate
ε dissipation rate of turbulent kinetic energy
ν kinematic viscosity
μ dynamic viscosity
μT turbulent viscosity
φ generalised transport variable
Ω rotational speed of the discs
ρ density
δij Kronecker delta
Γ diffusivity
ACKNOWLEDGEMENTS
The authors would like to acknowledge this work to Higher
Education Commission, Ministry of Science and
Technology Government of Pakistan, for providing an
opportunity and financial support to fulfil this work.
Authors are also thankful to the Mehran University of
Engineering & Technology, and Faculty members
Department of Mechanical Engineering, for their
encouragement and moral support.
REFERENCES
[1] Memon, M.D., "Numerical Modelling and Prediction of Fluid Flow and Heat Transfer in Rotating Disc Geometries", Ph.D. Thesis, University of Sussex, 1995.
[3] Itoh, M., Yamada, Y., Imao, S., and Gouda, M., "Experiments on Turbulent Flow Due to an Enclosed Rotating Disc", Experimental Thermal and Fluid Science, Volume 5, pp. 359-368, 1992.
[4] Kilic, M., Gan, X., and Owen, J.M., "Transitional Flow between Contra-Rotating Discs". Journal of Fluid Mechanics, Volume 281, pp. 119-135, 1994. [5] Jones, W.P., and Launder, B.E., "The Calculation of
Low Reynolds Number Phenomena with a Two-Equation Model of Turbulence", International Jornal of Heat and Mass Transfer, Volume 16, pp. 1119-1130, 1973. [6] Jones, W.P., and Launder, B.E., "The Prediction of
Laminarization with a Two-Equation Model of |Turbulence", Intetrnatinal Journal of Heat and Mass Transfer, Volume 15, pp. 301-314, 1972.
[7] Long, C.A., Morse, A.P., and Zafiropoulos, N., "Buoyancy-Affected Flow and Heat |Transfer in Asymmetrically-Heated Rotating Cavities", Journal of Turbo-Machinery, Volume 117, pp. 461-473, 1995. [8] Harlow, F.H., and Welch, J.E., "Numerical Calculation
of Time-Dependent Viscous Incompressible Flow of Fluid with Free Surface", Physics of Fluids, Volume 8, pp. 2182-2189, 1965.
[9] Van Doormal, J.P., and Raithby, G.D., "Enhancement of the SIMPLE Method for Predicting Incompressible Fluid Flow", Numerical Heat Transfer, Volume 7, pp. 147-163, 1984.
[10] Patankar, S.V., and Spalding, D.B., "A Calculation Procedure for Heat, Mass and Momentum Transfer in Three-Dimensional Parabolic Flow", Interntaion Journal of Heat and Mass Transfer, Volume 15, pp. 1787-1806, 1972.
[11] Daily, J.W., and Nece, R.E., "Chamber Dimension Effects on Induced Flow and Frictional Resistance of Enclosed Rotating Discs", Journal of Basic Engineering, Volume 82, pp. 217-232, 1960.
[12] Morse, A.P., "Assessment of Laminar-Turbulent Transition in Closed Disc Geometries", Journal of Turbomachinery, Volume 113, pp. 131-138, 1991. [13] Lygren, M., and Andersson, H., "Turbulent Flow between
a Rotating and a Stationary Disk", Journal of Fluid Mechanics, Volume 426, pp. 297-326, 2001.
[14] Serre, E., Aroco, C.D., and Bontoux, P., "Annular and Spiral Patterns in Flows between Rotating and Stationary Discs", Journal of Fluid Mechanics, Volume 434, pp. 65-100, 2001.
[15] Serre, E., Hugues, S., Aroco, C.D., Randriamampianina, A., and Bontoux, P., "Axisymmetric and Three-Dimensional Instabilities in an Ekman Boundary Layer Flow", International Journal of Heat and Fluid Flow Volume 22, pp. 82-93, 2001.
[16] Jacques, R., Quere, P., and Daube, O., "Axisymmetric Numerical Simulations of Turbulent Flow in Rotor-Stator Enclosures", International Journal of Heat and Fluid Flow Volume 23, pp.381-397, 2002.
[17] Tuliszka-Sznitko, E., and Zielinski, A., “Instability of the Flow in Rotating Cavity", Journal of Theory Application of Mechanics, Volume 45, pp. 685-704, 2007.
[18] Tuliszka-Sznitko, E., Zielinski, A., Majchrowski, W., "LES of the Non-Isothermal Transitional Flow in Rotating Cavity", International Journal of Heat and Fluid Flow, Volume 30, pp. 534-548, 2009.
[19] Poncet, S., Schiestel, R.,and Chauve, M.P., "Centrifugal Flow in a Rotor-Stator Cavity", Journal of Fluids Engineering, Volume 127, pp. 787-793, 2009.