www.atmos-chem-phys.net/7/1293/2007/ © Author(s) 2007. This work is licensed under a Creative Commons License.
Chemistry
and Physics
MAX-DOAS detection of glyoxal during ICARTT 2004
R. Sinreich1, R. Volkamer2,*, F. Filsinger1,**, U. Frieß1, C. Kern1, U. Platt1, O. Sebasti´an1, and T. Wagner1,*** 1Institut f¨ur Umweltphysik, Universit¨at Heidelberg, Heidelberg, Germany
2Massachusetts Institute of Technology, Cambridge, MA, USA *now at: University of California, San Diego, La Jolla, CA, USA
**now at: Fritz-Haber-Institut der Max-Planck-Gesellschaft, Berlin, Germany ***now at: Max-Planck Institute for Chemistry, Mainz, Germany
Received: 22 August 2006 – Published in Atmos. Chem. Phys. Discuss.: 26 September 2006 Revised: 25 January 2007 – Accepted: 16 February 2007 – Published: 22 February 2007
Abstract. The direct detection of glyoxal (CHOCHO), the smallestα-dicarbonyl, in the open atmosphere by active dif-ferential optical absorption spectroscopy (DOAS) has re-cently been demonstrated (Volkamer et al., 2005a) and trig-gered the very recent successful detection of CHOCHO from space (Kurosu et al., 2005; Wittrock et al., 2006; Beirle et al., 2006). Here we report the first comprehensive analysis of CHOCHO by passive multi axis differential optical absorp-tion spectroscopy (MAX-DOAS). CHOCHO and NO2slant
column measurements were conducted at the Massachusetts Institute of Technology (MIT), Cambridge, USA, and on board the research vessel Ron Brown in the Gulf of Maine as part of the International Consortium for Atmospheric Re-search on Transport and Transformation (ICARTT) 2004 campaign. For a day with nearly clear sky conditions, radia-tive transfer modeling was employed to derive diurnal CHO-CHO mixing ratios in the planetary boundary layer (PBL) for both sites. CHOCHO mixing ratios at MIT varied from 40 to 140 ppt, with peak values observed around noon. Mixing ra-tios over the Gulf of Maine were found to be up to 2.5 times larger than at MIT. The CHOCHO-to-NO2ratio at MIT was <0.03, and enhancements of this ratio by up to two orders of magnitude were found over the Gulf of Maine. This paper focuses on the methodological aspects involved with MAX-DOAS measurements of CHOCHO.
1 Introduction
Glyoxal (CHOCHO) is the smallestα-dicarbonyl and is an oxidation product of numerous volatile organic compounds (VOCs) (Calvert et al., 2000; Volkamer et al., 2001; Calvert et al., 2002). Direct and time resolved CHOCHO measure-ments provide a useful novel indicator to constrain VOC ox-Correspondence to:R. Sinreich
(roman.sinreich@iup.uni-heidelberg.de)
idation processes (Volkamer et al., 2005a), and enable many useful applications, such as an improved source apportion-ment of formaldehyde (HCHO) in urban air (Garc´ıa et al., 2005). The atmospheric residence time of CHOCHO is lim-ited by rapid photolysis and reaction with OH radicals, and is about 1.3 h for overhead sun conditions (Volkamer et al., 2005a). An increasing body of evidence recently suggests that volatile CHOCHO possibly contributes to secondary or-ganic aerosol (SOA) formation (Liggio et al., 2005; Kroll et al., 2005; Volkamer et al., 2006). However, the atmospheric relevance of CHOCHO uptake on aerosols is presently not clear.
The strongest absorption bands of CHOCHO are located in the blue wavelength range between 420 and 460 nm (Volka-mer et al., 2005b). These bands have recently been used to measure CHOCHO for the first time directly in the open atmosphere, as part of the Mexico City Metropolitan Area (MCMA) 2003 campaign, using an active differential optical absorption spectroscopy (DOAS) device (employing a Xe-arc light source). It has further been suggested that the de-tection of CHOCHO by passive DOAS, i.e. using scattered sunlight as a light source, should be feasible from ground-or space-bground-orne platfground-orms (Volkamer et al., 2005a). Most re-cently measurements of CHOCHO from space have been ac-complished by three research teams using two satellite plat-forms (i.e. the Ozone Monitoring Instrument (OMI) and the Scanning Imaging Absorption Spectrometer for Atmospheric Chartography (SCIAMACHY)) (Kurosu et al., 2005; Wit-trock et al., 2006; Beirle et al., 2006). In this study we present the first comprehensive analysis of CHOCHO using passive ground-based DOAS instrumentation based on initial stud-ies by Sinreich et al. (2004). CHOCHO observations from ground-based instruments have also been reported by Wit-trock et al. (2006).
415 420 425 430 435 440 445 450 455 460 -0.0010
-0.0005 0.0000 0.0005 0.0010
415 420 425 430 435 440 445 450 455 460
0.012 0.014 0.016 0.018 0.020 0.022 0.024 0.026
415 420 425 430 435 440 445 450 455 460
-0.005 0.000 0.005 0.010 0.015 0.020
415 420 425 430 435 440 445 450 455 460
-0.001 0.000 0.001 0.002 0.003 0.004 0.005 0.006 0.007
415 420 425 430 435 440 445 450 455 460
0.000 0.002 0.004 0.006 0.008 0.010 0.012
415 420 425 430 435 440 445 450 455 460
-0.0010 -0.0005 0.0000 0.0005 0.0010 0.0015 0.0020 0.0025 0.0030 0.0035
Wavelength [nm] f
NO2 d
O
p
ti
c
a
l
D
e
n
s
it
y b Water vapor
Residual
O4 eO3 c
CHOCHO a
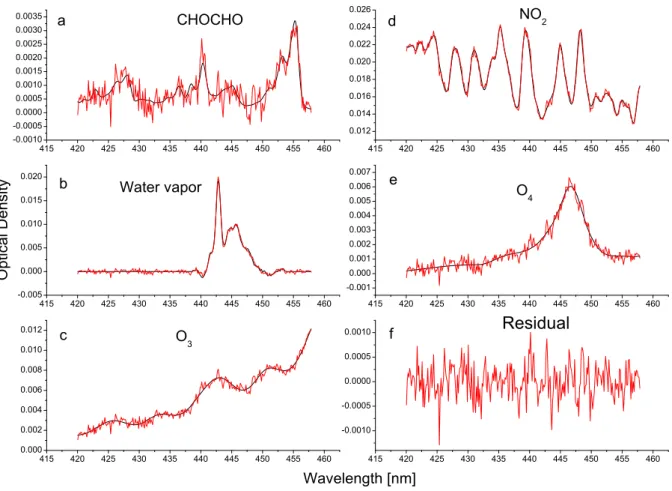
Fig. 1. CHOCHO example retrieval of a spectrum taken on 10 July 2004, 5:15PM at a 3◦elevation angle. The optical densities of the
scaled cross-sections (black) and the sum of the scaled cross-sections and the residual (red) as a function of wavelength are plotted,(a)for CHOCHO,(b)for water vapor,(c)for O3,(d)for NO2and(e)for O4.(f)shows the residual.
(<5 nm width) in the light spectra are analyzed to selectively detect and quantify trace gases by applying Lambert-Beer’s law. Like most spectroscopic techniques DOAS is inherently self-calibrating as well as contact free, it identifies the partic-ular molecules unequivocally by their characteristic absorp-tion structure (see Fig. 1), and allows real time measurements (Platt 1999). The DOAS technique has been used in the de-tection of a large variety of trace gases, including NO2, O3,
SO2, HCHO, NO3, BrO, OClO and - as discussed in this
ar-ticle - CHOCHO. In contrast to active DOAS instruments, where artificial light sources are employed, passive DOAS devices use natural light sources like the sun. Measurements of scattered sunlight can be performed with a relatively sim-ple setup and very low power consumption (Solomon et al., 1987; Otten et al., 1998; Bobrowski et al., 2003; Galle et al., 2003). “Traditional” setups point only to the zenith and are mostly sensitive to trace gases located in the stratosphere. To increase the sensitivity to trace gases close to the surface, the Multi-Axis-DOAS (MAX-DOAS) technique has been devel-oped recently. MAX-DOAS instruments observe scattered sunlight from a variety of viewing directions. In
particu-lar, high sensitivity for gases close to the ground is obtained for observation directions pointing slightly above the horizon (H¨onninger and Platt, 2002; Leser et al., 2003; van Roozen-dael et al., 2003; Wittrock et al., 2004; H¨onninger et al., 2004; Wagner et al., 2004; Heckel et al., 2005; von Friede-burg et al., 2005; Frieß et al., 2006). Furthermore, some degree of vertical resolution can be obtained by measuring along different lines of sight. In particular, when assum-ing a well mixed trace gas layer (e.g. within the atmospheric boundary layer), its vertical extent can be determined with good accuracy (e.g. H¨onninger and Platt, 2002; Wittrock et al., 2004; Sinreich et al., 2005; Heckel et al., 2005; Frieß et al., 2006) which generally is not possible with active DOAS devices.
of the DOAS measurement is the “differential slant column density” (DSCD), i.e. the difference between the actual SCD and the SCD of the reference spectrum. In contrast, the “vertical column density” (VCD) is the integrated concentra-tion over a vertical path through the atmosphere. Thus, the VCD is independent of the particular measurement geome-try and the sunlight conditions. The DSCD can be converted into VCD by dividing the DSCD by the differential air mass factor (DAMF). Thus, the air mass factor (AMF) expresses the light path ratio between the slant and the vertical path through the atmosphere. Because of the complexity of radia-tive transfer, AMFs are usually calculated using numerical radiative transfer models (Solomon et al., 1987; Marquard et al., 2000). The calculated (differential) AMFs can be used for inverse modeling which means that the parameters of the calculations are altered until the model output matches the measured DSCDs. In this study, we derive height informa-tion from MAX-DOAS measurements on aerosol extincinforma-tion as well as on mixing ratios of CHOCHO.
Our MAX-DOAS observations were part of the Interna-tional Consortium for Atmospheric Research on Transport and Transformation (ICARTT) 2004 campaign, which took place from 1 July through 15 August 2004. A network of 6 passive DOAS devices was set up in the north-eastern USA, amongst others at the Massachusetts Institute of Technol-ogy (MIT) in Cambridge. Additionally, a MAX-DOAS de-vice was installed on the research vessel Ron Brown which cruised through the Gulf of Maine during the measurement period. These two MAX-DOAS devices were used to mea-sure NO2, HCHO, O4and also CHOCHO.
2 Measurement sites and instruments
The two MAX-DOAS instruments with the capability to de-tect CHOCHO (owing to the selected wavelength range of the spectrographs) were those at MIT and RV Ron Brown. The first instrument was located on one of the buildings (Building 54, the so-called Green Building) of the MIT in Cambridge at 42.36◦ northern latitude and 71.09◦ westerly longitude; the instrument was pointing to the north. The second instrument was installed on the research vessel Ron Brown during its cruise in the Gulf of Maine, looking star-board. In this case, the observation azimuth varied depending on the course of the vessel.
At MIT a “Mini-MAX-DOAS” device was operated. It contained a miniature crossed Czerny-Turner spectrome-ter/detector unit “USB2000” from Ocean Optics Inc. with a resolution of 0.7 nm full width at half maximum (FWHM), projecting the spectral range from about 330 to 462 nm onto a one-dimensional CCD-detector with 2048 pixels. The spec-trometer/detector unit was cooled to a stable temperature of +15◦C which minimized changes in optical properties of the spectrometer while reducing detector dark current. The scat-tered sunlight was collected and focused by a quartz lens and
was lead into the spectrograph/detector unit by a quartz fibre bundle. To avoid condensation of water vapour, the instru-ment was sealed and a drying agent was included. An at-tached stepper motor enabled the adjustment of the viewing direction to a desired elevation angle (“elevation” is defined as the angle between the horizon and the pointing direction of the telescope). All functions were controlled by PC via USB connection.
The MAX-DOAS instrument installed on the RV Ron Brown had a separate telescope unit which collected scat-tered sunlight from different elevation angles (Wagner et al., 2004). The telescope could be adjusted by a stepper motor to any elevation angle between horizon and zenith. In or-der to prevent influences on the telescope viewing directions caused by rolling and pitching of the vessel, the telescope was mounted on a Cardanic suspension which largely com-pensated for these movements. The sunlight was focused on a quartz fibre bundle using a quartz lens in order to reach the spectrometer, a commercial instrument with 300 mm fo-cal length (Acton model 300). The spectra were recorded by a two-dimensional imaging CCD-detector (Andor model DV420-OE). While the spectrometer was heated to a sta-ble temperature of +32◦C, the CCD-detector was cooled to -30◦C for the reasons described above. The spectrometer covered the wavelength range of 325-460 nm and had a res-olution of about 0.7 nm FWHM.
Both setups were operated by fully automated measure-ment routines – Doasis (DOAS Intelligent System) (Kraus, 2001) at MIT and a specialized measurement program (Frieß, 2001) on the RV Ron Brown. Both programs employed rou-tines to adapt the integration time of the measurements to the light conditions in order to achieve a constant signal level (i.e. constant signal maximum per exposure), to store the spectra and to control the pointing of the telescopes. The instrument slit functions were determined by measuring the emission line of a mercury lamp at 436 nm.
Scattered sunlight spectra were acquired sequentially at el-evation angles of 3◦, 6◦, 10◦, 18◦ and from the zenith for both devices (the field of view of both was about 1◦) so that the viewing direction changed after each measurement. A measurement sequence of the five elevation angles was com-pleted after approximately 5–15 min.
3 The DOAS analysis
06 AM 09 AM 12 PM 03 PM 06 PM 09 PM 0 1x10¹⁵ 2x10¹⁵ 3x10¹⁵ 4x10¹⁵
06 AM 09 AM 12 PM 03 PM 06 PM 09 PM 0 1x10¹⁵ 2x10¹⁵ 3x10¹⁵ 4x10¹⁵ 5x10¹⁵ 6x10¹⁵ 7x10¹⁵ 8x10¹⁵
06 AM 09 AM 12 PM 03 PM 06 PM 09 PM 0.0 3.0x10¹⁶ 6.0x10¹⁶ 9.0x10¹⁶ 1.2x10¹⁷ 1.5x10¹⁷ 1.8x10¹⁷ 2.1x10¹⁷
06 AM 09 AM 12 PM 03 PM 06 PM 09 PM 0.0
3.0x10¹⁶
6.0x10¹⁶
06 AM 09 AM 12 PM 03 PM 06 PM 09 PM 1
2 3 4 5
06 AM 09 AM 12 PM 03 PM 06 PM 09 PM 1
2 3 4 5
06 AM 09 AM 12 PM 03 PM 06 PM 09 PM 20 30 40 50 60 70 80 90
06 AM 09 AM 12 PM 03 PM 06 PM 09 PM 20 30 40 50 60 70 80 90 elevation angle 3o 6o 10o 18o D if fe re n ti a l S la n t C o lu m n D e n si ti e s [m o le c/ cm
2 (
O4
:
1
0
4
3 m
o le c 2/cm 5)] CHOCHO a
RV Ron Brown, 17 July 2004
CHOCHO
MIT Cambridge, 26 July 2004
e NO2 b D if fe re n ti a l S la n t C o lu m n D e n si ti e s [m o le c/ cm
2 (
O4
:
1
0
4
3 m
o le c 2/cm 5)] NO2 f Local Time O4 c Local Time O4 g d S o la r Z e n it h A n g le [ °] Local Time h S o la r Z e n it h A n g le [ °] Local Time
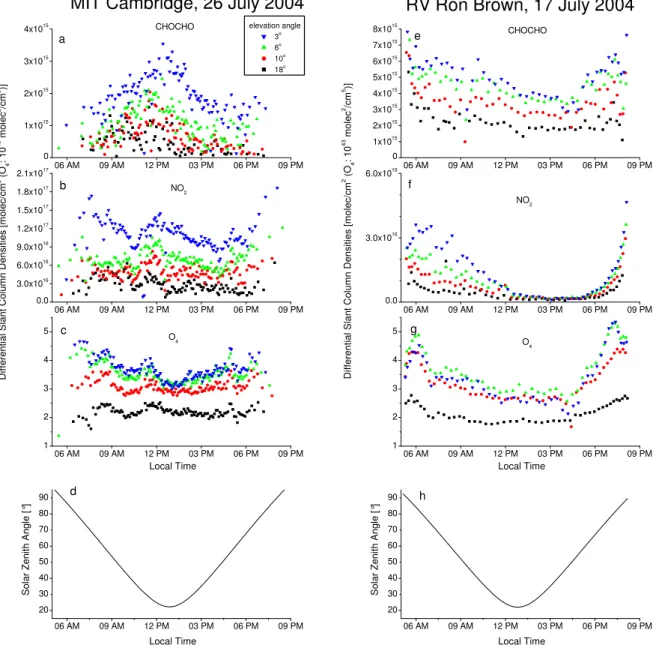
Fig. 2. DSCDs of CHOCHO, NO2and O4at MIT in Cambridge on 26 July 2004 (a–c) and RV Ron Brown on 17 July 2004 (e–g). The
elevation angles are indicated by the symbol color as denoted in the legend. In(d)and(h)the solar zenith angle at MIT and RV Ron Brown, respectively, is plotted.
measurement sequence (see above) was chosen as FRS so that it was updated from sequence to sequence. This proce-dure leads to minimal influence of instrumental instabilities and largely to an elimination of the stratospheric contribu-tion to the DSCD (of course for CHOCHO no stratospheric contribution is expected). The Ring spectrum and the poly-nomial correct for Raman scattering as well as Rayleigh and aerosol scattering, respectively. The Ring spectrum was cal-culated from the respective FRS for each sequence and thus changed from sequence to sequence, too. Also, included in the fitting routine was an intensity offset (polynomial of
de-gree 1) to account for possible instrumental stray light. The measurement spectrum was allowed to shift against the FRS, the Ring spectrum and the cross sections (Stutz and Platt, 1996). The wavelength calibration was performed using the Doasis software by fitting the Fraunhofer reference spectra to a high resolution Fraunhofer spectrum (Kurucz et al., 1984) convolved with the instrument’s slit function (see above).
The following high resolution absorption cross sections were included in the retrieval: CHOCHO (Volkamer et al., 2005b), NO2(Vandaele et al., 1997), ozone at 223 K
adjustments of the wavelength axis (A. Richter, personal communication). These cross sections were convolved with the instrumental slit function to match the spectral resolution of the instruments (except the O4spectrum which was
inter-polated). In addition, we used a water vapor reference spec-trum derived from our own atmospheric measurements. This was done because the literature water vapor cross sections are still of poor quality, especially in the wavelength range used in our retrievals. The measured water vapor reference spec-trum was derived from the ratio of two spectra (Solomon et al., 1989; Heintz et al., 1996; Wagner et al., 2000), one with high (at 3◦elevation) and one with low water vapor absorp-tion (at zenith direcabsorp-tion). In order to minimize the poten-tial interference with CHOCHO absorption we restricted our measured water vapor reference spectra to the wavelength range of the actual water vapor absorption (from 438.5 to 454 nm). For the MIT instrument, the morning of 17 July 2004, when the humidity was high, was selected. The same was done for the RV Ron Brown by using observations per-formed on 6 July 2004, also a day with water vapor amounts above average. The water vapor measurement was taken at about 07:00 a.m. and 06:00 a.m., respectively, when the least amount of CHOCHO is expected to be present in the atmo-sphere. Since the water vapor reference spectra were derived by the instruments themselves, their specific optical proper-ties are inherently leading to a better spectral retrieval with less systematic structures. For the CHOCHO evaluation, the spectral range from 420 to 460 nm was chosen (458 nm on the RV Ron Brown due to the restricted spectral range of the instrument), encompassing three main CHOCHO absorption bands.
While the DSCDs of NO2 were retrieved together with
CHOCHO, O4 was analyzed in the wavelength range
be-tween 338 and 364 nm encompassing two absorption bands. Cross sections of O4 (Greenblatt et al., 1990) with
man-ual adjustments of the wavelength axis (A. Richter, per-sonal communication), NO2 (Vandaele et al., 1997), BrO
(Wilmouth et al., 1999), HCHO (Meller and Moortgat, 2000) and of O3(Bogumil et al., 2003) at two temperatures (243 K
and 223 K) were fitted. Furthermore, a Ring spectrum, a polynomial of degree 3 and an intensity offset of degree 2 were included in the fit.
Typically, NO2 is the dominant absorber in the retrieval
and its absorption cross section shows characteristic struc-tures. Thus, even small potential errors in the analysis of the NO2absorption (e.g. due to the temperature dependence
of the cross section or due to an inaccurate wavelength cal-ibration) might substantially affect the retrieved CHOCHO results. In this case, the CHOCHO-to-NO2ratio should
pro-vide an indication of a potential interference with NO2. Since
the CHOCHO-to-NO2 ratio shows a variable behavior for
each elevation angle and for both sites (for 3◦elevation angle see Fig. 5) such an interference could be clearly excluded.
Several sensitivity studies were performed in order to quantify any systematic error in the CHOCHO retrieval. We
10 100
0.0 0.5 1.0 1.5 2.0 2.5 3.0
D
if
fe
re
n
ti
a
l
A
ir
M
a
s
s
F
a
c
to
r
Elevation Angle [°]
εAerosol [km-1
] Height [km] 0.05 1 0.025 1.5 0.05 1.5 0.1 1.5 0.025 2 0.05 2 0.1 2 Measurement Values
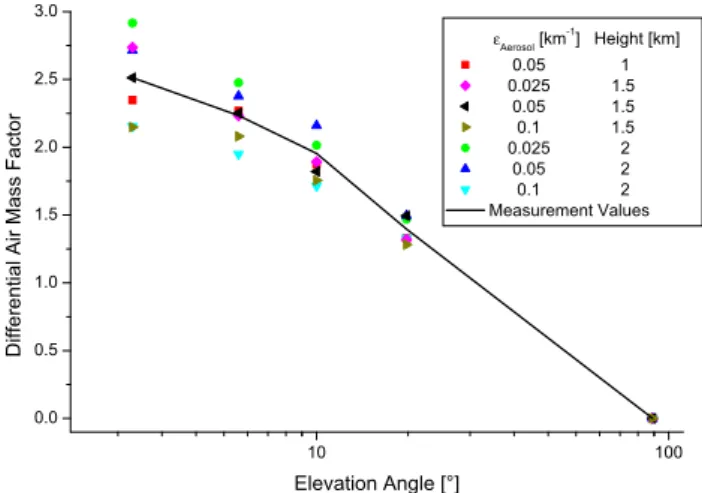
Fig. 3. From measurements calculated O4 DAMFS (black line)
compared with modeled O4 DAMF for different homogenously mixed aerosol layers (see legend) as a function of the logarithm of the elevation angle for an SZA of about 40◦at MIT.
varied the wavelength range and the degree of the polynomial as well as of the intensity offset. Furthermore, we used a wa-ter vapor cross section from liwa-terature (Rothman et al., 1998) instead of our measured water vapor reference spectrum. While the residual structures were significantly larger, the re-sults for CHOCHO were almost the same as for our original settings. This indicates that our retrieved water vapor refer-ence indeed does not contain significant absorption structures of CHOCHO. Finally, for the measurements at MIT we also used a measured NO2reference spectrum instead of the cross
section taken from literature (for the RV Ron Brown no mea-sured NO2spectrum was available). It was measured in the
early afternoon of 12 July 2004, a slightly hazy, but sunny day with constant lighting conditions, from two zenith spec-tra one with and one without a NO2cell in the field of view.
For the described sensitivity studies the results for CHOCHO were robust within±15%.
4 Profile inversion
In the following, we give a short overview on the inver-sion procedure Sinreich et al. (2005) employed to convert the measured DSCDs into aerosol optical densities (AODs) and trace gas mixing ratios. In a first step, this procedure ex-ploits the fact that the concentration of O4is proportional to
the square of the O2 concentration, which has only a small
spatial and temporal variability caused by pressure and tem-perature changes. Variations of the O4DSCDs thus mainly
reflect changes in the optical properties of the atmosphere. Therefore, O4delivers information on the light paths through
the atmosphere and can be considered as a good indicator for the aerosol load (Wagner et al., 2004; Frieß et al., 2006). O4
06 AM 09 AM 12 PM 03 PM 06 PM 0.0
0.5 1.0 1.5 2.0 2.5
06 AM 09 AM 12 PM 03 PM 06 PM
0.0 0.2 0.4 0.6 0.8 1.0 1.2 1.4 1.6 1.8 2.0
06 AM 09 AM 12 PM 03 PM 06 PM
0.00 0.02 0.04 0.06 0.08 0.10
06 AM 09 AM 12 PM 03 PM 06 PM
0.00 0.02 0.04 0.06 0.08 0.10 0.12 0.14 0.16 0.18 0.20
M
ix
in
g
H
e
ig
h
t
[k
m
]
CHOCHO Height
c
M
ix
in
g
H
e
ig
h
t
[k
m
]
Aerosol Height CHOCHO Height
a
A
e
ro
s
o
l
O
p
ti
c
a
l
D
e
n
s
it
y
Local Time
b
Local Time
A
e
ro
s
o
l
O
p
ti
c
a
l
D
e
n
s
it
y
MIT Cambridge, 26 July 2004 RV Ron Brown, 17 July 2004
d
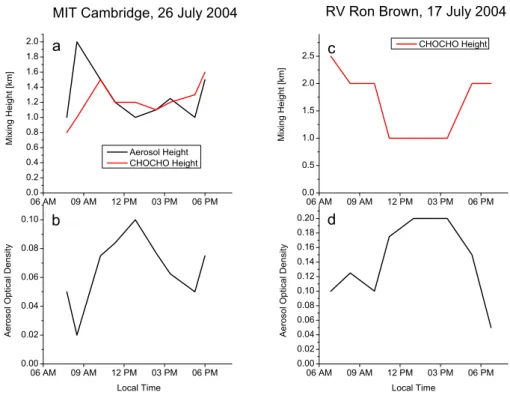
Fig. 4.Estimated mixing height for CHOCHO and aerosol (only for MIT) as well as aerosol optical density at MIT in Cambridge on 26 July
2004 (aandb) and RV Ron Brown on 17 July 2004 (candd) retrieved by radiative transfer modeling.
the radiative transfer model “Tracy” (v. Friedeburg, 2003). They were compared to the measured O4DAMFs of the
dif-ferent elevation angles, which were obtained by dividing the O4 DSCDs by a typical O4 VCD. For the simulation, the
aerosols were assumed to be homogeneously mixed in the planetary boundary layer (PBL), and the mixing heightHand aerosol extinction coefficientεAerosol were varied. The (H,
εAerosol)pair (the product of which is the AOD) that best
represented the O4 DSCD measurements was then used to
calculate DAMFs for CHOCHO. The concentrations of the trace gases also were assumed to be constant in the PBL. The comparison of the ratio between the 3◦and the 18◦values of the modeled DAMFs and of the measured DSCDs yieldsH, which allows deriving the mixing ratio.
This method does not primarily focus on the inversion of the specific properties of the aerosol which due to the used small wavelength range are not impossible but at least diffi-cult to retrieve. Our approach aims at modeling of the op-tical properties of the aerosol which fit to the O4
measure-ments and applying them for the inversion of the trace gases. Thereby, ambiguities of the specific aerosol properties can occur. Also, the assumption of well-mixed aerosol and trace gas layers is a rough, but not necessarily a totally unrealis-tic estimate. In future work, more detailed trace gas profiles could be retrieved, if the information of all elevation angles is used in the trace gas profile retrieval, which was already done by Heckel et al. (2005).
Owing to the strong dependence of the measured DSCDs
on the elevation angle, such a profile inversion in principle can be done for each sequence of elevation angles. In this study, we applied the profile inversion for observations av-eraged over about one hour. This reduces atmospheric vari-ations as well as measurement noise of single observvari-ations. The comparisons were performed for solar zenith angles of 25◦, 30◦, 40◦, 60◦as well as 70◦ (MIT) and 75◦ (RV Ron Brown), respectively.
5 Results and discussion
Elevated concentrations of CHOCHO were detected at MIT in Cambridge and onboard RV Ron Brown on more than 10 days during the measurement period. The DSCDs are gener-ally significantly lower at MIT than onboard RV Ron Brown. An example for the retrieval of CHOCHO from the in-strument onboard the RV Ron Brown is shown in Figure 1. The spectrum was taken under sunny conditions on 10 July 2004, at about 05:15 p.m. at an elevation angle of 3◦. At this time, the vessel was cruising along the coast of Massachusetts (42.09◦N, 70.59◦W) with wind from west-ward directions. The optical densities of the fitted com-ponents as a function of wavelength are shown in black, whereas the red lines show the sum of the scaled cross-sections and the residual. The root mean square variation of the residual (Fig. 1f) in this evaluation is 0.34×10⁻³
06 AM 09 AM 12 PM 03 PM 06 PM 0
50 100 150 200 250 300 350 400 450
06 AM 09 AM 12 PM 03 PM 06 PM 0
20 40 60 80 100 120 140 160 180
06 AM 09 AM 12 PM 03 PM 06 PM 0
1x10¹⁴ 2x10¹⁴
3x10¹⁴
4x10¹⁴ 5x10¹⁴
06 AM 09 AM 12 PM 03 PM 06 PM 0.0
5.0x10¹⁴ 1.0x10¹⁵
1.5x10¹⁵
G
ly
o
x
a
l
M
ix
in
g
R
a
ti
o
[
p
p
t]
c
G
ly
o
x
a
l
M
ix
in
g
R
a
ti
o
[
p
p
t]
a
V
e
rt
ic
a
l
C
o
lu
m
n
D
e
n
s
it
y
[
m
o
le
c
/c
m
2]
Local Time
b
Local Time
V
e
rt
ic
a
l
C
o
lu
m
n
D
e
n
s
it
y
[
m
o
le
c
/c
m
2]
MIT Cambridge, 26 July 2004 RV Ron Brown, 17 July 2004
d
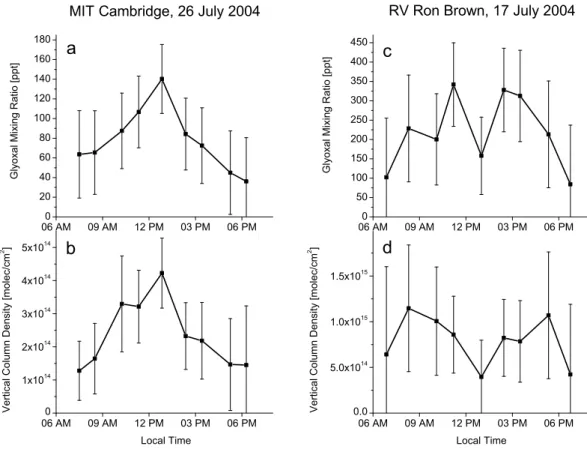
Fig. 5.CHOCHO mixing ratios and VCDs at MIT in Cambridge on 26 July 2004 (aandb) and RV Ron Brown on 17 July 2004 (candd)
retrieved by radiative transfer modeling from CHOCHO DSCDs.
of CHOCHO (approx. 3.5×10⁻³)and therefore is clearly low enough to allow an unambiguous detection of CHOCHO (Stutz and Platt, 1996). The corresponding DSCD amounts to 6.74×10¹⁵molec/cm2 at a 1σ error of 3.00×10¹⁴. The
DSCDs of NO2 (3.55×10¹⁶molec/cm2), water vapor, O4
and O3are also clearly identified.
In Fig. 2, measured tropospheric DSCDs of CHOCHO, NO2 and O4 as well as the solar zenith angles are plotted
for both sites, each on a clear day, which can be identified by a relatively smooth variation of the O4 DSCDs during
the day. At MIT, the chosen day is 26 July, which showed an increase in the CHOCHO DSCDs (Fig. 2a) up to about 3.5×10¹⁵molec/cm2in the morning, indicating a very effi-cient VOC oxidation on that day. In the afternoon, the val-ues decreased again most probably caused by chemical loss. Especially the MAX-DOAS observations at high elevation angles (e.g. 18◦) are sensitive for the total VCD and conse-quently just a dilution effect in a rising PBL would hardly affect the CHOCHO DSCDs (of course this is different at low elevation angles). The described behavior of the CHO-CHO DSCDs is consistent with active DOAS observations in Mexico City (Volkamer et al., 2005a). The NO2DSCDs
do not show such a pronounced diurnal cycle, although a de-crease in the afternoon can also be observed. The diurnal variation of the NO2values appears to be dominated by light
path changes, as can be seen from the similarity to the vari-ation in the O4DSCDs. 17 July was a clear day for the RV
Ron Brown. On this day, the vessel cruised around 69◦W and 43◦N in the Gulf of Maine mainly in eastward direc-tion, at about the same latitude as Portsmouth, New Hamp-shire. The wind came from southwest to west during the day. Here the CHOCHO DSCDs (Fig. 2e) are more influenced by the light path variations whereas the NO2 DSCDs show
high tropospheric NO2in the morning which disappeared in
the afternoon. In the late afternoon, the course of the ves-sel changed to northwest and a new air mass with slightly less aerosol load seemed to be present. For both days, ra-diative transfer modeling was performed to convert DSCDs into mixing ratios. For these calculations, an O4cross
sec-tion value of 5×1046cm5/molec2(for the 361 nm absorption band) was assumed (for the definition of the O4cross
sec-tion see Greenblatt et al., 1990). Figure 3 shows an exam-ple of the aerosol retrieval at MIT in the morning (about 40◦ SZA). O4 DAMFs calculated from the measurement (black
line) are compared with modeled O4DAMFs at different
ho-mogenously mixed aerosol layers. Owing to clearness the number of scenarios was reduced here. Obviously, the third scenario (black) matches best to the measurement values.
06 AM 09 AM 12 PM 03 PM 06 PM 09 PM 0.0
0.5 1.0 1.5 2.0 2.5 3.0 3.5 4.0
06 AM 09 AM 12 PM 03 PM 06 PM 09 PM 0.000
0.005 0.010 0.015 0.020 0.025 0.030 0.035 0.040
R
a
ti
o
G
ly
o
x
a
l/
N
O2
R
a
ti
o
G
ly
o
x
a
l/
N
O2
Local Time
RV Ron Brown, 17 July 2004
b
a
MIT Cambridge, 26 July 2004
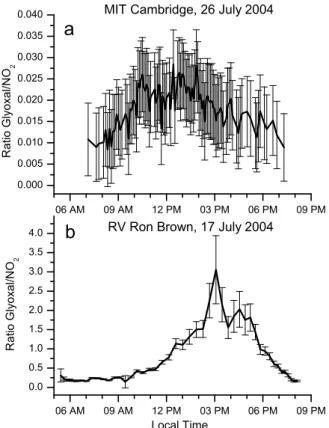
Fig. 6. CHOCHO-to-NO2DSCD ratios of the 3◦elevation values
at MIT in Cambridge on 26 July 2004(a)and RV Ron Brown on 17 July 2004(b).
heights at MIT generally match well, except for some devi-ations in the morning and evening, when CHOCHO DSCDs were lowest. During mid-day, the signal to noise ratio of the DSCDs is highest and the radiative transfer modeling is more accurate. At RV Ron Brown, the modeling of the aerosol layer height did not lead to an unequivocal result due to the relatively high AOD (of course, in reality even much higher AODs can occur. Nevertheless, the sensitivity of the O4
ab-sorption on the AOD decreases with increasing AOD) and possibly the complexity of the real aerosol scenario. The AOD at MIT peaked around noon, but generally increased in the course of the day which indicates an accumulation of aerosol load during that day. At RV Ron Brown, an accumu-lation can also be observed whereas a sudden decrease in the late afternoon indicates an altered air mass as already seen in the DSCDs.
The resulting CHOCHO mixing ratios at MIT (Fig. 5a) have their maximum at noon with about 140±35 ppt (1 ppt = 1 part per trillion = 2.51×10⁷molec/cm3 at 293 K and 1013 mbar). In contrast, there is no such clear maximum on RV Ron Brown (Fig. 5c) and the maximum values are almost three times higher (up to 340±110 ppt). In the MCMA-2003 campaign, values up to 1.82 ppb (1 ppb = 1 part per billion = 1000 ppt) were measured (Volkamer et al., 2005a). Typical
daytime maxima were about five times larger in Mexico City than in Cambridge. In Figs. 5b and d the VCDs of MIT and RV Ron Brown, respectively, are plotted which have basicly the same diurnal cycle as the mixing ratios.
Figure 6 shows the CHOCHO-to-NO2DSCD ratio at 3◦
elevation for the chosen days for the MIT site (Fig. 6a) and the RV Ron Brown (Fig. 6b). At MIT, the ratio reached its maximum (0.028±0.008) at 12:30 p.m., a much smaller value than observed during MCMA-2003 where daily maxi-mum ratios varied between 0.045 and 0.14 (Volkamer et al., 2005a). The MCMA-2003 campaign average ratio (0.081) is two to three times higher than in Cambridge, possibly reflecting differences in the VOC/NOx ratio (NOx= NO +
NO2) between both urban sites. The ratio in Cambridge
also peaked relatively late, reflecting more active and earlier PBL dynamics in Mexico City (de Foy et al., 2005) than in Cambridge. In contrast, the ratios onboard RV Ron Brown were much higher and peaked even later in the day. On 17 July 2004, the ratio reached up to 3.1±0.9 at 3PM. This is 110±45 times higher than at MIT.
The considerably higher CHOCHO-to-NO2ratio over the
sea compared to the Cambridge values can partly be ex-plained by the fact that CHOCHO is a secondary pollutant, i.e. formed from the airborne VOC oxidation, in contrast to NO2 from NOxemissions. Sustained CHOCHO formation
from longer lived VOC precursor oxidation in combination with NOxremoval in the photochemical plume will thus lead
to higher CHOCHO-to-NO2 ratios downwind of emission
sources. For a rough estimate of the extent of the NO2
re-moval effect, we assume that the air mass needed half a day to reach the RV Ron Brown from the last emission source (with a distance of about 200 km and a wind speed of about 5 m/s), and that the air mass contained an OH concentration of about 2.6×10⁶molecules per cm3. This number is the re-trieved 24h average OH concentration during NEAQS-2002 for air masses that had been impacted by major urban areas such as New York City and Boston and by biogenic emis-sions in New Hampshire and Maine (Warneke et al., 2004). Under these assumptions, only considering the reaction with OH, the lifetime of NO2 amounts to 9.7 h with a rate
co-efficient of 1.1×10⁻¹¹cm3/s (from Sander et al., 2003, for
285 K and 1013 mbar). After 12 hours, only 29% of the ini-tial NO2 is present. Together with the measured 2.5 times
higher CHOCHO concentrations, the CHOCHO-to-NO2
ra-tio would increase by a factor of about 9 which is one mag-nitude less than the measured ratio of the CHOCHO-to-NO2
peaks. Thus, it appears likely that there are other processes contributing to the high CHOCHO-to-NO2 ratio than only
NOx removal by OH. Such processes could include
addi-tional NOxsinks, reduced CHOCHO sinks over the Gulf of
Maine compared to Cambridge, or an additional CHOCHO source to the atmosphere over the Gulf of Maine. The chem-istry influencing the CHOCHO-to-NO2ratio requires further
6 Conclusions
For the first time glyoxal (CHOCHO) could be detected by passive multi axis differential optical absorption spec-troscopy (MAX-DOAS). The measurements were performed in the framework of the International Consortium for Atmospheric Research on Transport and Transformation (ICARTT) 2004 campaign at MIT, Cambridge, USA, and on board the research vessel Ron Brown in the Gulf of Maine. For the retrieval, the absorption bands between 420 and 460 nm were used and optical densities of CHOCHO up to 3.5×10⁻³could be detected. Besides the slant column
den-sities of CHOCHO, planetary boundary layer (PBL) heights and mixing ratios in the PBL, which was assumed to be well mixed, could be retrieved for a nearly clear day at each site by means of radiative transfer modeling. Mixing ratios at MIT varied from 40 to 140 ppt while over the Gulf of Maine they were found to be up to three times larger than at MIT. The CHOCHO-to-NO2 ratios showed clear diurnal cycles with
maxima in the middle of the day. The ratio over the Gulf of Maine was 110±45 times higher than on the chosen day at MIT. NOxremoval is found to be one responsible factor for
this enhancement, but also other factors seem to play a role and will be subject of a companion paper that focuses more on the chemistry involved to explain these observations.
Acknowledgements. Financial support from NOAA for the
MAX-DOAS measurements in the ICARTT 2004 Campaign is acknowledged. R. Volkamer acknowledges consecutive fellowships from Camille and Henry Dreyfus Foundation and Alexander von Humboldt Foundation, as well as M. and L. Molina for their help with providing space at MIT.
Edited by: A. Richter
References
Beirle, S., Volkamer, R., Wittrock, F., Richter, A., Bur-rows, J., Platt, U., and Wagner, T.: DOAS Retrieval of Glyoxal from Space, Proceedings of the ESA Atmo-spheric Science Conference, 8-12 May 2006, Frascati, http://earth.esa.int/workshops/atmos2006/participants/1055/ paper DOAS retrieval of Glyoxal from space.pdf, 2006. Bobrowski, N., H¨onninger, G., Galle, B., and Platt, U.: Detection
of Bromine Monoxide in a Volcanic Plume, Nature 423, 15 May, 273–276, 2003.
Bogumil, K., Orphal, J., Homann, T., Voigt, S., Spietz, P., Fleis-chmann, O. C., Vogel, A., Hartmann, M., Bovensmann, H., Frerik, J., and Burrows, J. P.: Measurements of Molecular Ab-sorption Spectra with the SCIAMACHY Pre-Flight Model: In-strument Characterization and Reference Data for Atmospheric Remote-Sensing in the 230–2380 nm Region, J. Photochem. Photobiol. A., 157, 167–184, 2003.
Calvert, J. G., Atkinson, R., Becker, K. H., Kamens, R. H., Seinfeld, J. H., Wallington, T. J., and Yarwood, G.: The mechanisms of
atmospheric oxidation of aromatic hydrocarbons, Oxford Univ. Press, Oxford, 2002.
Calvert, J. G., Atkinson, R., Kerr, J. A., Madronich, S., Moortgat, G. K., Wallington, T. J., and Yarwood, G.: The Mechanisms of Atmospheric Oxidation of the Alkenes, Oxford Univ. Press, New York, 2000.
de Foy, B., Caetano, E., Maga˜na, V., Zit´acuaro, A., C´ardenas, B., Retama, A., Ramos, R., Molina, L. T., and Molina, M. J.: Mexico City basin wind circulation during the MCMA-2003 field cam-paign, Atmos. Chem. Phys., 5, 2267–2288, 2005,
http://www.atmos-chem-phys.net/5/2267/2005/.
Fayt, C. and Roozendael, M.: WinDOAS 2.1. Software User Man-ual, 2001.
Frieß, U., Monks, P. S., Remedios, J. J., Rozanov, A., Sinre-ich, R., Wagner, T., and Platt, U.: MAX-DOAS O4 measure-ments: A new technique to derive information on atmospheric aerosols: 2. Modeling studies, J. Geophys. Res., 111, D14203, doi:10.1029/2005JD006618, 2006.
Frieß, U.: Spectroscopic Measurements of Atmospheric Trace Gases at Neumayer-Station, Antarctica, PhD Thesis, Univer-sity of Heidelberg, http://deposit.ddb.de/cgi-bin/dokserv?idn= 962363928, 2001.
Galle, B., Oppenheimer, C., Geyer, A., McGonigle, A., Edmonds, M., and Horrocks, L.: A miniaturised ultraviolet spectrometer for remote sensing of SO2fluxes: a new tool for volcano surveil-lance, J. Volc. Geotherm. Res., 119, 214–254, 2003.
Garc´ıa, A. R., Volkamer, R., Molina, L. T., Molina, M. J., Samuel-son, J., Mellqvist, J., Galle, B., Herndon, S. C., and Kolb, C. E.: Separation of emitted and photochemical formaldehyde in Mex-ico City using a statistical analysis and a new pair of gas-phase tracers, Atmos. Chem. Phys., 6, 4545–4557, 2006
Grainger, J. F. and Ring, J.: Anomalous Fraunhofer line profiles, Nature, 193, 762, 1962.
Greenblatt, G. D., Orlando, J. J., Burkholder, J. B., and Ravis-hankara, A. R.: Absorption measurements of oxygen between 330 and 1140 nm, J. Geophys. Res. 95, 18 577–18 582, 1990. Heckel, A., Richter, A., Tarsu, T., Wittrock, F., Hak, C., Pundt, I.,
Junkermann, W., and Burrows, J. P.: MAX-DOAS measurements of formaldehyde in the Po-Valley, Atmos. Chem. Phys., 5, 909– 918, 2005,
http://www.atmos-chem-phys.net/5/909/2005/.
Heintz, F., Platt, U., Flentje, H., and Dubois, R.: Long-term observation of nitrate radicals at the Tor Station, Kap Arkona (R¨ugen), J. Geophys. Res., 101(D17), 22 891–22 910, doi:10.1029/96JD01549, 1996.
H¨onninger, G., Friedeburg, C.v., and Platt, U.: Multi Axis Differ-ential Absorption Spectroscopy (MAX-DOAS), Atmos. Chem. Phys., 4, 231–254, 2004,
http://www.atmos-chem-phys.net/4/231/2004/.
H¨onninger, G. and Platt, U.: The Role of BrO and its Vertical Dis-tribution during Surface Ozone Depletion at Alert, Atmos. Envi-ron., 36, 2481–2489, 2002.
Kurosu, T. P., Chance, K., and Volkamer, R.: Global Measurements of OClO, BrO, HCHO, and CHO-CHO from the Ozone Mon-itoring Instruments on EOS Aura, Eos Trans. AGU, Fall Meet. Suppl., Abstract A54B-01, 5-9 Dec. 2005, San Francisco, CA, USA, 2005.
Kroll, J., Ng, N. L., Murphy, S. M., Varutbangkul, V., Fla-gan, R. C., and Seinfeld, J. H.: Chamber studies of sec-ondary organic aerosol growth by reactive uptake of sim-ple carbonyl compounds, J. Geophys. Res., 110, D23207, doi:10.1029/2005JD006004, 2005.
Kurucz, R. L., Furenlid, I., J., and Testerman, L.: Solar Flux Atlas from 296 to 1300 nm, Technical Report, National Solar Observa-tory, 1984.
Leser H., H¨onninger G., and Platt, U.: MAX-DOAS Measurements of BrO and NO2in the Marine Boundary Layer, Geophys. Res. Lett. 30(10), 1537, doi:10.1029/2002GL015811, 2003.
Liggio, J., Li, S.-M., and McLaren, R.: Reactive uptake of gly-oxal by particulate matter, J. Geophys. Res., 110, D10304, doi:10.1029/2004JD005113, 2005.
Marquard, L. C., Wagner, T., and Platt, U.: Improved Air Mass Factor Concepts for Scattered Radiation Differential Optical Ab-sorption Spectroscopy of Atmospheric Species, J. Geophys. Res., 105, 1315–1327, 2000.
Meller, R. and Moortgat, G. K.: Temperature dependence of the ab-sorption cross sections of formaldehyde between 223 and 323 K in the wavelength range 225–375 nm, J. Geophys. Res., 105, 7089–7101, 2000.
Otten, C., Ferlemann, F., Platt, U., Wagner, T., and Pfeilsticker, K.: Groundbased DOAS UV/visible measurements at Kiruna (Swe-den) during the SESAME winters 1993/94 and 1994/95, J. At-mos. Chem., 30, 141–162, 1998.
Platt, U.: Differential optical absorption spectroscopy (DOAS), Air monitoring by spectroscopic techniques, M.W. Sigrist, Ed., Chemical Analysis Series, 127, John Wiley & Sons, Inc., 1994. Platt, U.: Modern Methods of the Measurement of Atmospheric
Trace Gases, J. Phys. Chem. Chem. Phys. ’PCCP’ 1, 5409–5415, 1999.
Rothman, L. S., Rinsland, C. P., Goldman, A., Massie, S. T., Ed-wards, D. P., Flaud, J. M., Perrin, A., Camy-Peyret, C., Dana, V., Mandin, J. Y., Schroeder, J., McCann, A., Gamache, R. R., Watt-son, R. B., Yoshino, K., Chance, K. V., Jucks, K. W., Brown, L. R., Nemtchinov, V., and Varanasi, P.: The HITRAN Molecular Spectroscopic Database and HAWKS (HITRAN Atmospheric Workstation), Edition. J. Quant. Spec. and Rad. Transf. 60, 665/710, 1998.
Sander, S. P., Friedl, R. R., Golden, D. M., Kurylo, M. J., Huie, R. E., Orkin, V. L., Moortgat, G. K., Ravishankara, A. R., Kolb, C. E., Molina, M. J., and Finlayson-Pitts, B. J.: Chemical Ki-netics and Photochemical Data for Use in Atmospheric Studies, Tech. Rep. JPL Publication 02-25, Jet Propulsion Laboratory, Pasadena, CA, 2003.
Sinreich, R., Filsinger, F., Kern, C., Platt, U., Sebasti´an, O., Wag-ner, T., and Volkamer, R.: MAX-DOAS measurement of Gly-oxal at the MIT in Cambridge during the NEAQS-ITCT 2004 Campaign, AGU, Abstract A11A-0011, 13–17 Dec. 2004, San Francisco, CA, USA, 2004.
Sinreich, R., Frieß, U., T., and Platt, U.: Multi axis differential op-tical absorption spectroscopy (MAX-DOAS) of gas and aerosol distributions, Faraday Discuss., 130(08), doi:10.1039/b419274, 2005.
Solomon, S., Schmeltekopf, A. L., and Sanders, R. W.: On the in-terpretation of zenith sky absorption measurements, J. Geophys. Res, 92, 8311–8319, 1987.
Solomon, S., Miller, H. L., Smith, J. P., Sanders, R. W., Mount,
G. H., Schmeltekopf, A. L., and Noxon, J. F.: Atmospheric NO31. Measurement technique and the annual cycle at 40◦N, J. Geophys. Res., 94(D8), 11041–11048, doi:10.1029/89JD00605, 1989.
Stutz, J. and Platt, U.: Numerical Analyses and Estimation of the Statistical Error of Differential Optical Absorption Spec-troscopy Measurements with Least Square Methods, Appl. Opt., 35, 6041–6053, 1996.
v. Friedeburg, C.: Derivation of Trace Gas Information combining Differential Optical Absorption Spectroscopy with Monte Carlo Radiative Transfer Modelling, PhD Thesis, University of Heidel-berg, 2003.
v. Friedeburg, C., Pundt, I., Mettendorf, K.-U., Wagner, T., and Platt, U.: Multi-AXis-(MAX) DOAS Measurements of NO2 during the BAB II Motorway Emission Campaign, (BAB II special issue) Atmos. Environ. 39, 5, 977–985, doi:10.1016/j.atmosenv.2004.06.046, 2005.
van Roozendael, M., Fayt, C., Post, P., Hermans, C., and Lambert, J.-C.: Retrieval of BrO and NO2from UV-Visible Observations, in: Sounding the troposphere from space: a new era for atmo-spheric chemistry, Springer-Verlag, ISBN 3-540-40873-8, edited by: Borell, P., Borell, P. M., Burrows, J. P., and Platt, U., 2003. Vandaele, A. C., Hermans, C., Simon, P. C., Carleer, M.,
Colin, R., Fally, S., M´erienne, M.-F., Jenouvrier, A., and Co-quart, B.: Measurements of the NO2 Absorption Cross-section from 42 000 cm−1to 10 000 cm−1(238–1000 nm) at 220 K and 294 K, J. Quant. Spectrosc. Radiat. Transfer, 59, 171–184, 1997. Volkamer, R., Platt, U., and Wirtz K.: Primary and Secondary Gly-oxal Formation from Aromatics: Experimental Evidence for the Bicycloalkyl-Radical Pathway from Benzene, Toluene, and p-Xylene, J. Phys. Chem. A, 105, 7865–7874, 2001.
Volkamer, R., Molina, L. T., Molina, M. J., Shirley, T., and Brune, W. H.: DOAS measurement of glyoxal as an indicator for fast VOC chemistry in urban air, J. Geophys. Res., 32, L08806, doi:10.1029/2005GL022616, 2005a.
Volkamer, R., Spietz, P., Burrows, J. P., and Platt, U.: High-resolution absorption cross-section of Glyoxal in the UV/vis and IR spectral ranges, Journal of Photochem-istry and Photobiology A: ChemPhotochem-istry 172 (2005), 35–46. doi:10.1016/j.jphotochem.2004.11.011, 2005b.
Volkamer, R., Jimenez, J. L., San Martini, F., Dzepina, K., Zhang, Q., Salcedo, D., Molina, L. T., Worsnop, D. R., and Molina, M. J.: Secondary Organic Aerosol Formation from Anthropogenic Air Pollution: Rapid and Higher than Expected, Geophys. Res. Lett., 33(17) L17811, doi:10.1029/2006GL026899, 2006. Wagner, T., Otten, C., Pfeilsticker, K., Pundt, I., and Platt,
U.: DOAS moonlight observation of atmospheric NO3 in the Arctic winter, Geophys. Res. Lett., 27(21), 3441–3444, doi:10.1029/1999GL011153, 2000.
Wagner, T., Dix, B., Friedeburg, C. v., Frieß, U., Sanghavi, S., Sin-reich, R., and Platt, U.: MAX-DOAS O4measurements: A new technique to derive information on atmospheric aerosols — Prin-ciples and information content, J. Geophys. Res., 109, D22205, doi:10.1029/2004JD004904, 2004.
and nighttime oxidation of biogenic and anthropogenic VOCs along the New England coast in summer during New England Air Quality Study 2002, J. Geophys. Res., 109(D10), D10309, doi:10.1029/2003JD004424, 2004.
Wilmouth, D.M., T.F. Hanisco, N.M. Donahue, J.G. Anderson, Fourier transfor ultraviolet spectroscopy of the A235/2 ←X235/2 transition of BrO, J. Phys. Chem. A., 103, 8935-8945, 1999. Wittrock, F., Oetjen, H., Richter, A., Fietkau, S., Medeke, T.,
Rozanov, A., and Burrows, J. P.: MAX-DOAS measurements of atmospheric trace gases in Ny- ˚Alesund – Radiative transfer studies and their application, Atmos. Chem. Phys., 4, 955–966, 2004,
http://www.atmos-chem-phys.net/4/955/2004/.