www.atmos-chem-phys.net/10/12059/2010/ doi:10.5194/acp-10-12059-2010
© Author(s) 2010. CC Attribution 3.0 License.
Chemistry
and Physics
Glyoxal vertical columns from GOME-2 backscattered light
measurements and comparisons with a global model
C. Lerot, T. Stavrakou, I. De Smedt, J.-F. M ¨uller, and M. Van Roozendael
Belgian Institute for Space Aeronomy (BIRA-IASB), Brussels, Belgium
Received: 7 July 2010 – Published in Atmos. Chem. Phys. Discuss.: 6 September 2010 Revised: 3 December 2010 – Accepted: 7 December 2010 – Published: 17 December 2010
Abstract. Glyoxal vertical column densities have been re-trieved from nadir backscattered radiances measured from 2007 to 2009 by the spaceborne GOME-2/METOP-A sensor. The retrieval algorithm is based on the DOAS technique and optimized settings have been used to determine glyoxal slant columns. The liquid water absorption is accounted for using a two-step DOAS approach, leading to a drastic improvement of the fit quality over remote clear water oceans. Air mass factors are calculated by means of look-up tables of weight-ing functions pre-calculated with the LIDORT v3.3 radiative transfer model and using a priori glyoxal vertical distribu-tions provided by the IMAGESv2 chemical transport model. The total error estimate comprises random and systematic er-rors associated to the DOAS fit, the air mass factor calcula-tion and the cloud correccalcula-tion. The highest glyoxal vertical column densities are mainly observed in continental tropi-cal regions, while the mid-latitude columns strongly depend on the season with maximum values during warm months. An anthropogenic signature is also observed in highly pop-ulated regions of Asia. Comparisons with glyoxal columns simulated with IMAGESv2 in different regions of the world generally point to a missing glyoxal source, most probably of biogenic origin.
1 Introduction
Glyoxal (CHOCHO) has been recently the subject of a grow-ing number of literature studies. Global chemistry trans-port models based on current inventories and chemical mech-anisms estimate the global glyoxal source at 45–56 Tg/yr (Fu et al., 2008; Myriokefalitakis et al., 2008; Stavrakou et al., 2009b). The major part of this source is due to the
Correspondence to:C. Lerot ([email protected])
oxidation of NMVOCs (non-methane volatile organic com-pounds) emitted naturally (55%) and by human activities (21%), whereas direct glyoxal emissions (vegetation fires, fossil fuel and biofuel combustion) contribute also to the global source (16%, Stavrakou et al., 2009b). About half of the glyoxal sink is due to photolysis, whereas oxidation by OH, and dry and wet deposition account for the remainder. Its short lifetime (2.5–3 h globally) makes glyoxal a good in-dicator for reactive NMVOC chemistry.
However, discrepancies arise when comparing model re-sults with the space-based glyoxal column data set from the SCIAMACHY instrument (Wittrock et al., 2006; Vrekous-sis et al., 2009). It turns out that models generally under-predict the observed glyoxal columns over both continen-tal and oceanic regions. The disagreement is attributed to the existence of a missing source, and/or an overestimated sink (Myriokefalitakis et al., 2008). An inverse modelling study constrained by glyoxal columns retrieved from SCIA-MACHY suggests that, in order to reach a good agreement with the observations, the global continental glyoxal source should be twice as large as the a priori value, 108 Tg/yr in-stead of 56 Tg/yr (Stavrakou et al., 2009b). Although half of this source can be understood in terms of identified sources, the formation mechanisms for the remaining production are unknown by now.
Further interest in glyoxal originates from its recognized potential for formation of secondary organic aerosols (SOA, Fu et al. (2008), Stavrakou et al. (2009b), Ervens and Volka-mer (2010) and references therein). Glyoxal is expected to be one of the missing links necessary to bridge the gap between observed and modelled organic carbon concentrations. Al-though there exists experimental evidence for SOA produc-tion from glyoxal processing in clouds and fog (modelling studies estimate this production to range between 5.5 and 10 Tg/yr), the SOA formation in aqueous aerosol particles is not completely understood and persistent uncertainties still remain.
Glyoxal is characterized by absorption bands in the visible region (400–460 nm), making its detection possible using the Differential Optical Absorption Spectroscopy (DOAS) tech-nique (Platt and Stutz, 2008), as primarily demonstrated by Volkamer et al. (2005b). However, such measurements re-main challenging, especially from spaceborne instruments, due to the overall faintness of the CHOCHO signal. The first SCIAMACHY glyoxal vertical column retrievals (Wittrock et al., 2006) are limited by the fact that the global coverage of this instrument is only reached in six days as the satellite alternates between the nadir- and limb-viewing geometries, respectively used for column and stratospheric profile mea-surements. In this paper, we focus on glyoxal measurements retrieved from nadir observations of the GOME-2 instrument aboard the Metop-A platform. GOME-2 measures the sun-light backscattered by the Earth’s atmosphere between 240 nm and 790 nm since October 2006 (Munro et al., 2006). It is characterized by a ground resolution of 80 km×40 km, and is able to deliver a global coverage in 1.5 day. With a higher number of daily observations compared to SCIAMACHY, GOME-2 is expected to better resolve the spatial structures of the glyoxal abundances, therefore allowing for a better iden-tification of the emissions. We present here glyoxal column data retrieved between January 2007 and December 2009.
In Sect. 2, the algorithm used to retrieve the glyoxal ver-tical columns from the GOME-2 spectra is described. Par-ticular focus is put on algorithm improvements over oceanic scenes through the inclusion of the liquid water absorption in the DOAS retrievals (Sect. 2.1.2). A comprehensive error budget is presented in Sect. 3. The IMAGESv2 global chem-istry transport model, briefly described in Sect. 4, is used to compare the model predictions with the observed verti-cal columns. We present and discuss global distributions and time series over selected large regions worldwide in Sect. 5. Conclusions are drawn in Sect. 6.
2 Algorithm description
The glyoxal vertical column retrievals from the GOME-2 spectra are based on the DOAS technique (Platt and Stutz, 2008), which implies a two step procedure. First, a slant col-umn density SCD, i.e. the concentration integrated along the
mean photon path, is retrieved using the structured absorp-tion bands of the species under study. Second, the SCD is converted into a vertical column using air mass factors cal-culated with a radiative transfer model.
2.1 Slant column density retrieval
The absorption bands of glyoxal are structured enough to al-low the retrieval of glyoxal SCDs using the DOAS technique. All broadband effects, such as molecular scattering, aerosol scattering and reflection from the Earth’s surface, are filtered out by fitting through the measured transmittance (ratio of earthshine radiance and solar irradiance) a low-order polyno-mial. The remaining high-frequency spectral features origi-nate from the absorption of trace gases present in the atmo-sphere, and also from the rotational Raman scattering (Ring effect; Grainger and Ring, 1962). The DOAS retrieval con-sists in minimizing the least squares difference between the differential optical densities measured by the instrument and those calculated using scaled reference spectra. The parame-ters adjusted in this procedure are the slant column densities.
2.1.1 Retrieval settings
The selected fitting window (435–460 nm) includes the two strongest glyoxal absorption bands. Intense interferences be-tween the glyoxal and Ring spectral features below 430 nm prevent the extension of the window towards the ultraviolet (Vrekoussis et al., 2009). The reference glyoxal absorption cross-sections used in the retrievals have been measured by Volkamer et al. (2005a) at high resolution. In this spectral region, the absorption of light by ozone, NO2, water vapour and the O2-O2 collision pair is significant and is consid-ered by including their respective reference absorption cross-section in the DOAS retrievals. All reference cross-cross-section data sets, listed in Table 1, have been degraded at the GOME-2 resolution using the slit function data measured by Siddans et al. (2006). The Ring effect is treated as a pseudo-absorber for which a reference spectrum, calculated as in Chance and Spurr (1997), is also included in the fit. Furthermore, inter-ferences with the liquid water absorption spectrum lead to strongly negative glyoxal SCD over clear water oceanic re-gions if not accounted for (Wittrock et al., 2006). In this work, an optimized procedure to consider this liquid water absorption in the DOAS fit has been set up (see details in Sect. 2.1.2). In the glyoxal fitting window, a polynomial of degree 2 efficiently removes the broad-band spectral struc-tures and one supplementary parameter allows for correct-ing possible constant intensity offset in the measured spec-tra. Also, the wavelength grid of the earthshine spectrum is shifted in order to properly align the Fraunhofer lines present in the radiance to those in the irradiance spectrum.
The typical order of magnitude of the glyoxal SCDs is 0.5– 1.5×10¹⁵molec/cm2 making its optical density very small
Table 1. Reference cross-section data sets included in the glyoxal DOAS retrievals.
Specie Reference
Glyoxal (CHOCHO) Volkamer et al. (2005a) Ozone (O3) Burrows et al. (1999)
Nitrogen Dioxide (NO2) Vandaele et al. (1998)
Water Vapour (H2O) Rothman et al. (2005)
O2-O2collision pair Greenblatt et al. (1990); shifted by 0.2 nm. Ring (as peudo-absorber) Chance and Spurr (1997) Liquid Water Pope and Fry (1997)
Fig. 1. DOAS fit of the glyoxal optical density for a GOME-2 measurement recorded on 16 March 2007 close to Hanoi (Viet-nam). The black curve represents the reference glyoxal cross-section scaled by the fitted SCD (6.57×10¹⁵molec/cm2). The red curve represents the fit residuals superimposed to the glyoxal opti-cal density.
the NO2 optical density is 10 times larger). In addition, glyoxal is mostly present in the boundary layer where the satellite sensitivity is small. Consequently, glyoxal detection using spaceborne sensors is to a large extent limited by the signal-to-noise ratio of the radiance and irradiance measure-ments. The detection limit (defined as three times the ran-dom error; see Sect. 3) for an individual slant column density measurement is estimated at about 2×10¹⁵molec/cm2. This
can be further decreased by averaging measurements in time and/or space. Figure 1 shows an example of glyoxal DOAS fit for an individual GOME-2 scene recorded in March 2007 close to Hanoi (Vietnam). The associated SCD is very high (6.57×10¹⁵molec/cm2), as a result of high biomass burning emissions over southeastern Asia in springtime.
2.1.2 Impact of liquid water absorption
Figure 2 (upper panel) illustrates the monthly mean gly-oxal slant columns measured in December 2008 when the liquid water absorption is not considered in the DOAS
re-Fig. 2. Monthly mean of glyoxal SCDs (molec/cm2) measured by GOME-2 in December 2008. The upper and lower panels respec-tively show the columns retrieved without and with the liquid water absorption included in the DOAS fit. Pixels in polar regions and/or with solar zenith angles larger than 70◦have been excluded.
trievals. As already noted in Wittrock et al. (2006), the gly-oxal columns above remote oceans are systematically nega-tive and the quality of the fits in these regions is poorer as shown by the high value of the root mean square of glyoxal DOAS residuals (Fig. 3, blue line). This artifact has been at-tributed to interferences between the glyoxal and liquid water absorption spectra, which are significant in clear water re-gions where the light path below the surface is not negligible (Smith and Mobley, 2007; Jin and Charlock, 2001; Jin et al., 2004). Because of these spectral interferences, the simulta-neous adjustment of glyoxal and liquid water slant column densities in the DOAS fit leads to unphysical results.
Fig. 3.Averaged root mean square of glyoxal DOAS residuals for all GOME-2 measurements of 5 December 2008 as a function of the liquid water optical density. Considering the liquid water absorption in the glyoxal retrievals significantly improves the fit quality.
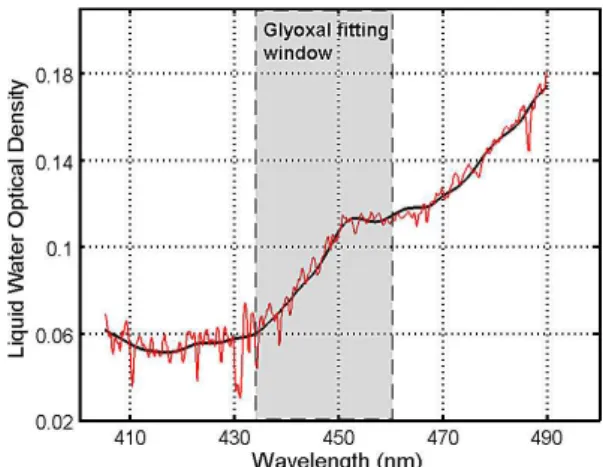
Fig. 4. DOAS fit of the liquid water optical density based on GOME-2 spectra recorded on 16 March 2007 in the Pacific Ocean. The calculated optical density is represented by the black curve and the fit residuals are plotted in red.
values perfectly correlate with the oceanic regions where the glyoxal retrievals fail when the liquid water absorption is not included in the fit (Fig. 2). These regions are characterized by a very low concentration of chlorophyll, which absorbs in the visible region. The light path below the sea surface is consequently more important there than in other oceanic regions.
The second step consists in retrieving the glyoxal SCD in the 435–460 nm interval fixing the liquid water optical density to the value determined in the large fitting window (Fig. 4). This two-step method allows for considering the liquid water absorption with a minimum impact of spectral interferences on the glyoxal fits. The lower panel of Fig. 2 clearly shows that glyoxal columns over oceans retrieved us-ing this method are much more physical. Also, the DOAS
Fig. 5. Monthly mean liquid water optical density at 460 nm re-trieved in December 2008.
fit quality in these regions is greatly improved (Fig. 3). Nev-ertheless, a slight increase of the residuals with increasing liquid water optical density remains despite our correction procedure. This indicates either uncertainties in the refer-ence liquid water cross-sections or the existrefer-ence of another physical effect specific to the oceanic regions affecting the photons along their light path (e.g. vibrational Raman scat-tering; Vasilkov et al., 2002). Note finally that the impact of this correction over lands is relatively limited due to the small liquid water optical densities measured in these regions.
2.1.3 Reference irradiance spectrum
The daily irradiance spectra measured by GOME-2 are used to calculate the atmospheric transmittance in the DOAS retrievals. However, their usage introduces yearly repro-ducible time-dependent offsets in the retrieved glyoxal slant columns. Test retrievals carried out using a fixed irradi-ance spectrum show much smoother temporal variations in the glyoxal SCDs (Fig. 6), pointing to a problem related to the irradiance spectra. Similar patterns have been ob-served in DOAS retrievals based on measurements from the GOME/ERS-2 instrument. In that case, they originated from spectral artefacts in the GOME irradiance spectra, caused by angular dependent small scale spectral features in the reflec-tivity of the diffusor plate used for the solar measurements (Richter and Wagner, 2001).
To sidestep this problem, a daily normalization procedure based on measurements in remote areas has been established, as commonly used for minor trace gas retrievals (e.g. Richter and Burrows, 2002; Martin et al., 2002; De Smedt et al., 2008). In this procedure, a general offset is applied to all retrieved glyoxal SCDs so that the mean vertical column of the clear sky pixels in the remote Pacific Ocean is equal to 1×10¹⁴molec/cm2. The Pacific reference sector is taken be-tween 135◦
W and 180◦
W, and comprises all latitudes except the tropical region (25◦
S–25◦
Fig. 6. Time variation of the glyoxal SCDs daily averaged in the sector (15◦N–45◦N; 30◦W–60◦W) in 2007. The upper panel
shows the results retrieved using the daily GOME-2 irradiance spec-tra; those obtained using a fixed irradiance spectrum (recorded by GOME-2 on 16 August 2007) are presented in the lower panel.
of 1×10¹⁴ molec/cm2 is roughly consistent with the
non-normalized vertical column measurements averaged in the reference sector during periods with minimum impact of the irradiance artefacts.
2.2 Conversion into vertical column densities
The air mass factor (AMF), defined as the ratio of the SCD to the VCD (vertical column density), can be calculated by means of a radiative transfer model. Glyoxal being a weak absorber, the formulation of Palmer et al. (2001) for the AMF can be used:
AMF=
R∞
0 WF(z)S(z)dz R∞
0 S(z)dz
, (1)
where WF represents the scattering weights or weighting functions and S is the a priori glyoxal concentration at the altitudez. This formulation presents the advantage to de-couple the instrumental sensitivity to scattered light from the trace gas concentration vertical distribution. Look-up tables of altitude-resolved weighting functions at 448 nm
have been generated using the LIDORTv3.3 radiative trans-fer model (Spurr, 2008). These tables account for the observation geometry, the surface altitude and the surface albedo. For each pixel, the surface elevation is taken from the ETOPO2v2 Global Gridded 2-minute Database (http: //www.ngdc.noaa.gov/mgg/global/etopo2.html) and the sur-face albedo at 440 nm is provided by the climatology of Koelemeijer et al. (2003).
The a priori glyoxal concentration profiles are provided by the IMAGESv2 chemical transport model (CTM) (see Sect. 4). These profiles are calculated on a monthly basis at the horizontal resolution of 2◦×
2.5◦
and on 40 vertical lev-els from the surface up to the pressure level of 44 hPa. Using model profiles presents the advantage to have seasonal and geographical dependencies of the profile shape. Neverthe-less, there may be important uncertainties in the CTM a priori profiles, especially over oceanic regions where the formation processes are not well represented, making thereby important a proper characterization of the errors (cf. Sect. 3).
Cloud contamination of pixels usually prevents probing the lower tropospheric part of the atmosphere with space-borne instruments. Therefore, a cloud correction based on the independent pixel approximation (Martin et al., 2002) is applied to calculate the glyoxal vertical columns. The VCD computation is based on the formulation given in e.g. Van Roozendael et al. (2006):
VCD= SCD+8GC Acloud
(1−8)Aclear+8Acloud=
3 Error budget
A comprehensive error budget has been performed using the formalism presented in De Smedt et al. (2008). Assum-ing uncorrelated errors, the total error on individual glyoxal VCD measurements may be expressed as the sum of random and systematic errors on the SCD, AMF and ghost column correction (Boersma et al., 2004):
σtot2 =
σS,rand2 +σS,syst2 +82A2cloudσGC2
Atot2 (3)
+
SCD+8AcloudGC Atot2
2 σA2,
whereσS,randandσS,systare the random and systematic errors on the slant column, σGCis the error on the ghost column correction and σA is the error on the total air mass factor Atot.
Considering individual measurements, the SCD random errors (σS,rand) are dominant and are found to range between 7×10¹⁴and 13×1014molec/cm2depending on the observa-tion geometry, the scene reflectivity, and also the age of the satellite and the status of its degradation. When measure-ments are averaged at cost of temporal and/or spatial reso-lution, this random error is strongly reduced (by the square root of the number of measurements).
The systematic errors on the slant column densities (σS,syst) mainly originate from uncertainties in the reference cross-section data sets and their cross-correlations. The un-certainties associated to the glyoxal cross-sections have been estimated to be less than 5% (Volkamer et al., 2005a). In ad-dition, the uncertainties in the other cross-section data sets included in the DOAS fit also contribute to the systematic errors via their cross-correlations with the glyoxal spectrum. Their respective contributions have been estimated with a set of DOAS analysis using alternative reference data sets for each of the species. Also, the total systematic errors asso-ciated to each measurement have been calculated using the formalism of Rodgers (2000) and are consistent with the re-sults derived from the sensitivity tests (see also Theys et al. (2007); De Smedt et al. (2008)). In the calculation ofσS,syst, a term takes into account the contribution of the error propa-gated from the liquid water optical density retrieval. In gen-eral,σS,syst is estimated at 2–3×10¹⁴molec/cm2 in regions where the liquid water absorption is negligible while it can reach 4–5×10¹⁴molec/cm2in clear water oceanic regions.
The accuracy of the ghost column correction depends on the quality of the a priori profiles. The differences between the a priori IMAGES vertical columns and monthly mean of co-located GOME-2 clear sky measurements are used to es-timateσGC, which strongly depends on the location, the mea-surement time and obviously on the cloud contamination. In particular,σGCis very large for pixels strongly contaminated by high-altitude clouds in regions where the a priori col-umn greatly differs from temporally and spatially close clear
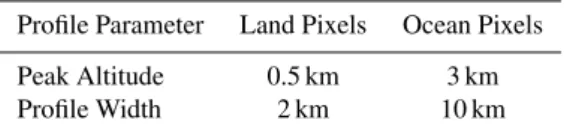
Table 2.Uncertainties associated to the profile shape parameters.
Profile Parameter Land Pixels Ocean Pixels Peak Altitude 0.5 km 3 km Profile Width 2 km 10 km
sky measurements. In general, σGC ranges between 0 and 3×10¹⁴molec/cm2. In oceanic regions, the very important profile shape uncertainties (see below) may also contribute to the ghost column error. However, this supplementary term is difficult to assess due to the lack of knowledge of glyoxal production processes in these regions.
To estimate the AMF error (σA), the uncertainties associ-ated to the AMF calculation input parameters as well as the AMF sensitivity to each of them have to be assessed. As-suming uncorrelated parameter uncertainties and neglecting the geolocation errors,σAcan be written as (Boersma et al., 2004; De Smedt et al., 2008):
σA2=X
p
Kpσp2, (4)
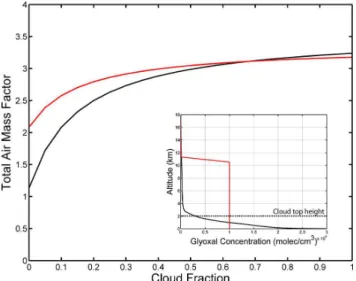
Fig. 7. Cloud fraction dependence of the total air mass factor cal-culated with a glyoxal profile strongly peaking at the surface (black curve) or with an unrealistic constant glyoxal profile in the tropo-sphere (red curve). The corresponding profiles are plotted in the inner figure and the peaked profile is provided by the model IM-AGESv2 for the region of Beijing on 1 July 2007. In these AMF calculations, the SZA is 50◦, the surface albedo is 0.03 and the top
height of the Lambertian cloud is 2 km (dashed line in the inner figure).
In general, the total absolute errors range between 2×10¹⁴ and 3×10¹⁴ molec/cm2 corresponding to relative errors around 40% in the high glyoxal concentration regions. Fig-ure 8 shows mean total errors associated to the glyoxal VCD measurements in March 2007 and in two different regions, as well as the respective contribution of the different error com-ponents. In this figure, the random errors have been omit-ted, since they become negligible when a large number of measurements are averaged. The dominant errors strongly depend on the observation conditions. In particular, the con-tributions from the AMF errors and from the DOAS system-atic errors decrease with increasing cloud fraction while the ghost column correction errors expectedly show the oppo-site behaviour. Despite reasonable total errors, it is recom-mended not to use the pixels strongly contaminated by clouds as their associated measured column is mostly influenced by the a priori information via the ghost column correction, es-pecially for scenes containing high-altitude clouds. In prac-tice, we filter out all pixels with a cloud fraction larger than 40%, this threshold resulting from a trade-off between num-ber of measurements and limited cloud contamination.
4 Glyoxal simulated with the IMAGESv2 CTM
A comprehensive description of IMAGESv2 global chemi-cal transport model is given in Stavrakou et al. (2009a,b). Briefly, the model calculates the daily mean concentrations
Fig. 8. Mean total errors associated to the glyoxal VCD retrieved from GOME-2 measurements in March 2007 (black) plotted as a function of the cloud fraction for(a)a continental and (b) an oceanic region. The contribution of the different types of errors is also illustrated: the contribution of the systematic errors in the DOAS fit (red); the contribution of the AMF error (blue) and the er-ror associated to the ghost column correction (green). The random errors are negligible due to the large number of measurements.
of 117 compounds at a horizontal resolution of 2×2.5
de-grees and on 40 vertical levels from the surface up to a pres-sure level of 44 hPa. The model transport is driven by ERA-Interim meteorological fields. The model time step is equal to one day, whereas diurnal cycle simulations with a time step of 20 min are used to derive correction factors for the photolysis and kinetic rates, and the diurnal profiles required to estimate the glyoxal concentrations at the GOME-2 over-pass time (09:30 LT).
Among the 22 NMVOCs included explicitly in the model, eight compounds, namely, isoprene, α-pinene, glycolalde-hyde, acetylene, ethene, and the aromatics (benzene, toluene, xylenes) are precursors of glyoxal. For isoprene, the MIM2+ chemical mechanism (Lelieveld et al., 2008; Butler et al., 2008) is used, whereas for the other species the oxida-tion scheme is designed so as to reproduce the glyoxal yields derived from box model simulations using the quasi-explicit Master Chemical Mechanism (http://mcm.leeds.ac. uk/MCM/home.htt, Saunders et al., 2003).
compounds, the emissions of the bifunctional carbonyls gly-oxal, methylglygly-oxal, glycolaldehyde, and 2,3-butanedione due to biofuel use are obtained based on burnt biomass es-timate of the EDGARv3.3 inventory (Olivier et al., 2001; Olivier, 2002) and emission factors from Andreae and Merlet (2001) and updates from Andreae (2006) (pers. comm). The resulting global anthropogenic NMVOC source amounts to 155 Tg/yr, including 1.6 Tg/yr of glyoxal due to biofuel. The seasonality of NMVOC emissions is neglected, except for a small component associated to biofuel use which is based on the heating degrees days approach. Although the fractional contribution of the residential/commercial sector is known from the EDGARv3.3 inventory, the contribution of heating is unavailable. Here we assume that the fractionfheating of residential emissions which is due to heating can be calcu-lated from the annual number of degree days (Hyinkdays):
fheating=Hy/(Hy+500).
An updated version of the MEGAN-ECMWF inventory (M¨uller et al., 2008) for isoprene emissions is used, driven by ERA-Interim meteorological fields, instead of operational ECMWF analyses as in M¨uller et al. (2008). It spans the years between 1996 and 2009 and is fully accessible at the MEGAN-ECMWF website (http://tropo.aeronomie.be/ models/mohycan.htm). The global annual isoprene emis-sions are estimated at 420, 403 and 424 Tg/yr for the years 2007, 2008 and 2009, respectively. Monthly vegetation fire emissions are obtained from the newly released ver-sion 3.1 of the Global Fire Emisver-sion Database (GFED, http: //www.falw.vu/∼gwerf/GFED/index.html). This dataset
ac-counts for the distinction between emissions from savanna, woodland, and forest fires, agricultural waste burning, peat-lands, deforestation and degradation fires (van der Werf et al., 2010). The annual global NMVOC fire emissions are estimated at 94.3 Tg/yr in 2007, 76.5 Tg/yr in 2008, and 68.8 Tg/yr in 2009.
Three-year long simulations are performed with a spin up time of 4 months starting on 1 September 2006. Besides the standard S0 simulation, we conduct four additional sensitiv-ity studies to investigate the effect on the predicted glyoxal columns of doubling the global isoprene emissions (S1), ne-glecting the direct biofuel emission of glyoxal (S2), and halv-ing (S3) or doublhalv-ing (S4) the direct and indirect glyoxal pro-duction from biomass burning (Table 3).
5 Results and discussion
5.1 Observed GOME-2 glyoxal vertical columns
Averaged glyoxal vertical column densities retrieved from GOME-2 measurements between 2007 and 2009 are illus-trated in Fig. 9, and seasonally averaged column maps are shown in Fig. 10. The highest annual columns (up to 8×10¹⁴molec/cm2) are observed over continental tropical
regions, where biogenic and biomass burning NMVOC
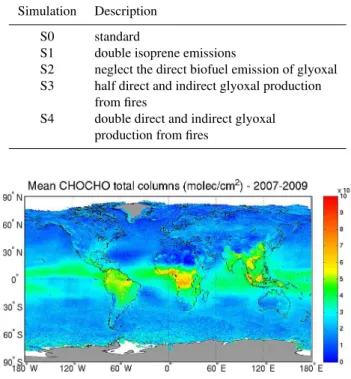
emis-Table 3.Performed global model simulations.
Simulation Description S0 standard
S1 double isoprene emissions
S2 neglect the direct biofuel emission of glyoxal S3 half direct and indirect glyoxal production
from fires
S4 double direct and indirect glyoxal production from fires
Fig. 9. Mean glyoxal vertical column densities retrieved from GOME-2 measurements between 2007 and 2009. Only pixels with cloud fraction lower than 0.4 are considered.
sions are most important. Outside the Tropics, the mean gly-oxal VCDs are lower and depend strongly on the season, re-flecting the seasonal patterns in the emissions of glyoxal pre-cursors and especially isoprene. In general, the observed gly-oxal fields qualitatively agree with those recently measured by Vrekoussis et al. (2010), except over remote oceans where their columns are low-biased due to the glyoxal-liquid water spectral interferences.
Overall, the glyoxal vertical columns increase during the local summer months. In the southeastern US and in Europe, the mean CHOCHO columns reach respec-tively 6×10¹⁴molec/cm2 and 3.5×10¹⁴molec/cm2 in sum-mertime, while they are close to 1×10¹⁴molec/cm2in
win-ter. A similar behaviour is observed over northern Australia, with maximal values (∼5×10¹⁴molec/cm2) during the local
summertime and minima in wintertime. These variations are mostly due to the enhancement of biogenic emissions during the warm season.
Fig. 10.Global maps of seasonally averaged vertical columns of glyoxal retrieved from GOME-2 measurements between 2007 and 2009.
(Vrekoussis et al., 2009). Furthermore, in highly populated regions of Asia, anthropogenic emissions of glyoxal and its precursors are significant. Figure 11 illustrates the spatial correlation between the population density from the GPW v3 (Gridded Population of the World) data set (Balk and Yetman, 2005) and the GOME-2 glyoxal vertical columns in winter, when the biogenic and pyrogenic emissions are at their lowest. Enhanced glyoxal column densities are clearly visible in the regions with the highest population density. In particular, high glyoxal columns are found in the regions of Beijing and Chongqing and in the Indo-Gangetic Plains. Also, very bright hot spots are observed over Hong-Kong, Shanghai and Bangkok. This indicates that the spatial res-olution and the coverage of GOME-2 allows for resolving the anthropogenic signal in the measured glyoxal fields. In the next section, we will further investigate the origin of the observed glyoxal columns over China and southeastern Asia through sensitivity studies with the IMAGESv2 model.
In oceanic regions, the impact of the interferences between the liquid water and glyoxal absorption spectra is signifi-cantly reduced by our retrieval procedure. Indeed, as shown on Figs. 9 and 10, the glyoxal columns measured above clear water regions are positive (ca. 1×10¹⁴molec/cm2). En-hanced glyoxal VCDs are observed over the tropical oceans. Recently, ship measurements conducted in the Tropical Pa-cific Ocean using a MAX-DOAS instrument have clearly in-dicated elevated glyoxal concentrations in the marine bound-ary layer (Volkamer et al., 2010; Sinreich et al., 2010). Assuming a uniform glyoxal concentration in the marine boundary layer (z<700 m, based on ECMWF analyses), the vertical column densities corresponding to these ship
measurements reach 3×10¹⁴molec/cm2, consistent with our
glyoxal observations from GOME-2 and those from SCIA-MACHY (Vrekoussis et al., 2009). The causes for these high glyoxal abundances are still unknown. Typical known gly-oxal precursors emitted over land are too short-lived to sig-nificantly contribute to such high glyoxal concentrations in remote oceans (Sinreich et al., 2010). However, the trans-port of (still unidentified) continental glyoxal precursors to oceanic regions cannot be totally excluded. Alternatively, as proposed by Vrekoussis et al. (2009), organic aerosols re-leased from the sea might be oxidized in the boundary layer into gas-phase organic compounds. Further investigation is needed to elucidate the causes for the high glyoxal concen-trations observed in tropical oceanic regions.
5.2 Comparisons with the IMAGESv2 glyoxal columns
The monthly averaged time series of the observed glyoxal columns and those simulated with the IMAGEv2 model over large areas in the mid-latitudes and in the Tropics between 2007 and 2009 are compared in Figs. 12 and 13. In both figures the standard S0 simulation is illustrated in black, and sensitivity calculations in color line.
Fig. 11. Illustration of the mean glyoxal VCDs in winter (December-January-February) (upper panel) and the population density (lower panel) in southeastern Asian regions. The popula-tion density data are taken from the GPW v3 data set (Balk and Yetman, 2005).
glyoxal columns during the growing season suggests a possi-ble underestimation in the glyoxal production from isoprene, or the existence of other biogenic glyoxal precursors with light and/or temperature dependent emissions.
The comparisons over the US show a very satisfactory agreement, in both the seasonal cycle and the magnitudes of the glyoxal columns (S0, Fig. 12, middle). Interestingly, the severe heat wave that occurred across the US through-out a large part of August 2007 is impressed on the peak values during this month in both the observed and the sim-ulated glyoxal columns. Doubling the isoprene emissions used in the model leads to significant overestimations over the US (Fig. 12). It is worthy to note that recent findings, based on aircraft measurements (Warneke et al., 2010) and satellite columns of formaldehyde (Stavrakou et al., 2009a), rather suggest that the isoprene emissions over the US might be significantly overestimated in the MEGAN inventory. We cannot therefore exclude that the very good agreement be-tween the observed and modelled (S0) columns might result
from a compensation of errors, e.g. an overestimation of iso-prene emissions and either an underestimation of the glyoxal yield from isoprene or the existence of other biogenic glyoxal precursors.
Over China, the model underprediction is quite important in summertime, even after doubling the isoprene source, al-though in this case the summertime seasonal variation is bet-ter captured. Again, this discrepancy puts forth the existence of an important unidentified source of glyoxal, most proba-bly related to secondary production from glyoxal precursors emitted by plants (see also Stavrakou et al., 2009b). Further-more, in constrast with the observed behaviour, the winter-time modelled columns of the standard run over China ex-hibit higher values than in summertime (Fig. 12 lower pan-els). A sensitivity test (S2) carried out by setting to zero the direct biofuel source of glyoxal leads to an important de-crease of the modelled columns in wintertime, and improves significantly the correlation between the modelled and ob-served columns (0.25 in S0 vs. 0.85 in S2). This finding points to an overestimation in the biofuel use estimate over China in the EDGARv3.3 inventory, or more probably, in the utilized value (1.12 g/kg dry matter; M. O. Andreae, per-sonal communication, 2006) for the biofuel emission factor for glyoxal.
For the tropical regions of Fig. 13, strong systematic un-derestimations are found especially during the wet season, except over Northern Australia, where the model lies reason-ably close to the observation. Sensitivity simulations with halved (S3) or doubled (S4) biomass burning emissions of glyoxal and its precursors do not lead to a better agreement with the observed columns, as depicted in Fig. 13. The sec-ondary peak observed every year in March-April over In-donesia and Amazonia, obviously not related to fire emis-sions, is intriguing. A doubling of the isoprene emissions (S1) provides only moderate column increases (not shown).
Note finally that strong uncertainties are present in the emission inventories, but also in the glyoxal formation yields from identified sources like isoprene. For example, the sub-stantial revisions in the isoprene degradation mechanism re-cently proposed by Peeters et al. (2009); Peeters and M¨uller (2010) could strongly affect the glyoxal yield from isoprene, especially under low NOxconditions. Besides these uncer-tainties, the lack of knowledge about other potential sources of glyoxal constitutes a major difficulty, but also an incentive for further research.
6 Conclusions
Fig. 12.Modelled and observed glyoxal column time series over selected large mid-latitude regions. The standard model simulation S0 is shown in black. The simulations S1 (with doubled isoprene emissions) and S2 (without the biofuel glyoxal source) are shown in red and green, respectively. Error bars represent the total errors on the observed columns as calculated in Sect. 3.
can be significant over remote oceans. Since the simulta-neous adjustment of glyoxal and liquid water slant columns leads to unphysical results due to correlations between their respective absorption cross-sections, a specific two-step pro-cedure has been designed: the liquid water slant column is firstly measured in a large fitting window (405–490 nm) and then used to determine the liquid water optical density in the fitting interval used for retrieving glyoxal (435–460 nm). This procedure improves the fit quality in clear water oceans and physical glyoxal columns are thus measured for the first time in these regions.
An error budget has been established considering the main error sources. Because of the very small optical den-sity of glyoxal, the largest contribution to the total error is the random error in the slant column retrieval (up to 7×10¹⁴molec/cm2). However, this term can be strongly reduced by applying spatial and/or time averages of mea-surements. The other error sources add up, leading to to-tal errors generally ranging between 2×10¹⁴molec/cm2and 3×10¹⁴molec/cm2 (∼40%). Besides the random error, the systematic error in the DOAS fit and the AMF error are dom-inant for clear-sky scenes, while the error associated to the cloud-shielded glyoxal correction becomes larger at higher cloud fractions. Consequently, all pixels with large cloud fraction have to be used with care. The impact of absorb-ing aerosols has to be further investigated, especially because of their possible large concentrations during important fire events and in heavily polluted megacities.
The highest yearly mean vertical column densities are ob-served in tropical continental regions where biogenic and py-rogenic emissions are important. At mid-latitudes, the gly-oxal columns strongly depend on the season, as a conse-quence of seasonal variations of biogenic emissions. In gen-eral, the glyoxal columns observed in these regions during wintertime are small. However, the columns measured over high population density regions remain significant all year round due to anthropogenic NMVOC emissions. Although the seasonality at mid-latitudes is generally well reproduced by the IMAGESv2 model, the simulated columns are gen-erally biased low, especially during warm months. This un-derestimation suggests a missing source related to biogenic emissions. In China, the simulated columns overestimate the observations in winter, indicating a large overestimation of the direct glyoxal emission due to biofuel burning used in the CTM. In tropical regions, the simulated columns are gener-ally much lower than the measurements, which points again to a large missing source associated to biogenic emissions. Finally, the current models are not able to reproduce the satellite glyoxal column observations over tropical oceans, which are in good consistency with recent ship glyoxal mea-surements.
More work is clearly needed to improve the representation of glyoxal sources and sinks in chemical transport models. Besides the large uncertainties associated to the emission in-ventories and to the glyoxal formation yields, the existence
of unknown glyoxal precursors over land and ocean are re-quired in order to reconcile the models with the observations. The large data set of glyoxal measurements presented here provides an important global reference and can be provided on request by the authors.
Accurate glyoxal ground-based measurements are also needed to validate the satellite data sets and to provide ad-ditional information unavailable to spaceborne instruments, like the vertical distribution or the diurnal dependence of the glyoxal concentrations. Furthermore, independent observa-tions of glyoxal vertical distribution in different regions of the world (among which equatorial oceans) and in different seasons would help to better characterize the quality of the a priori profiles provided by current global models and to pos-sibly improve these profiles which would lead to a reduction of the uncertainties associated to satellite measurements. Acknowledgements. This research is partly funded by the Belgian Science Policy Office through the projects IBOOT (contract SD/AT/03, Science and Sustainable Development programme) and SECPEA (PRODEX). It has also been supported by ESA and the European Union via the PROMOTE and AMFIC projects. The authors acknowledge EUMETSAT for providing the GOME-2 level-1 data product.
Edited by: R. Volkamer
References
Andreae, M. O. and Merlet, P.: Emission of trace gases and aerosols from biomass burning, Global Biogeochem. Cy., 15, 955–966, 2001.
Balk, D. and Yetman, G.: Center for International Earth Science In-formation Network (CIESIN), Columbia University; United Na-tions Food and Agriculture Programme (FAO); and Centro In-ternacional de Agricultura Tropical (CIAT): Gridded Population of the World: Future Estimates (GPWFE). Palisades, NY: So-cioeconomic Data and Applications Center (SEDAC), Columbia University, available at: http://sedac.ciesin.columbia.edu/gpw/, 2005.
Boersma, K. F., Eskes, H. J., and Brinksma, E. J.: Error analysis for tropospheric NO2 retrieval from space, J. Geophys. Res., 109,
D04311, doi:10.1029/2003JD003962, 2004.
Burrows, J., Richter, A., Dehn, A., Deters, B., Himmelmann, S., Voigt, S., and Orphal, J.: Atmospheric remote sensing refer-ence data from GOME: Part 2. Temperature-dependent absorp-tion cross-secabsorp-tions of O3 in the 231–794 nm range, J. Quant.
Spectrosc. Radiat. Transfer, 61, 509–517, 1999.
Butler, T. M., Taraborrelli, D., Br¨uhl, C., Fischer, H., Harder, H., Martinez, M., Williams, J., Lawrence, M. G., and Lelieveld, J.: Improved simulation of isoprene oxidation chemistry with the ECHAM5/MESSy chemistry-climate model: lessons from the GABRIEL airborne field campaign, Atmos. Chem. Phys., 8, 4529–4546, doi:10.5194/acp-8-4529-2008, 2008.
De Smedt, I., M¨uller, J.-F., Stavrakou, T., van der A, R., Eskes, H., and Van Roozendael, M.: Twelve years of global obser-vations of formaldehyde in the troposphere using GOME and SCIAMACHY sensors, Atmos. Chem. Phys., 8, 4947–4963, doi:10.5194/acp-8-4947-2008, 2008.
Ervens, B. and Volkamer, R.: Glyoxal processing by aerosol multi-phase chemistry: towards a kinetic modeling framework of sec-ondary organic aerosol formation in aqueous particles, Atmos. Chem. Phys., 10, 8219–8244, doi:10.5194/acp-10-8219-2010, 2010.
Fu, T., Jacob, D. J., Wittrock, F., Burrows, J. P., Vrekous-sis, M., and Henze, D. K.: Global budgets of atmospheric glyoxal and methylglyoxal, and implications for formation of secondary organic aerosols, J. Geophys. Res., 113, D15303, doi:10.1029/2007JD009505, 2008.
Grainger, J. F. and Ring, J.: Anomalous Fraunhofer line profiles, Nature, 193, 762–762, doi:10.1038/193762a0, 1962.
Greenblatt, G. D., Orlando, J. J., Burkholder, J. B., and Ravis-hankara, A. R.: Absorption measurements of oxygen between 330 and 1140 nm, J. Geophys. Res., 95, 18577–18582, 1990. Jin, Z. and Charlock, T.: Radiative Transfer Modeling of Ocean
Sur-face Albedo for CERES SARB, in: Proceedings of 23rd CERES Science Team Meeting, Williamsburg, VA, USA, available on-line at: http://science.larc.nasa.gov/ceres/STM/2001-01/, 23–25 January, 2001.
Jin, Z., Charlock, T. P., Smith Jr., W. L., and Rutledge, K.: A pa-rameterization of ocean surface albedo, Geophys. Res. Lett., 31, L22301, doi:10.1029/2004GL021180, 2004.
Koelemeijer, R. B. A., Stammes, P., Hovenier, J. W., and de Haan, J. F.: A fast method for retrieval of cloud parameters using oxy-gen A band measurements from the Global Ozone Monitoring Experiment, J. Geophys. Res., 106(D4), 3475–3490, 2001. Koelemeijer, R. B. A., de Haan, J. F., Hovenier, J. W., and Stammes,
P.: A database of spectral surface reflectivity in the range 335– 772 nm derived from 5.5 years of GOME observations, J. Geo-phys. Res., 108(D2), 4070, doi:10.1029/2002JD002429, 2003. Leit˜ao, J., Richter, A., Vrekoussis, M., Kokhanovsky, A., Zhang, Q.
J., Beekmann, M., and Burrows, J. P.: On the improvement of NO2satellite retrievals – aerosol impact on the airmass factors,
Atmos. Meas. Tech., 3, 475–493, doi:10.5194/amt-3-475-2010, 2010.
Lelieveld, J., Butler, T. M., Crowley, J. N., Dillon, T. J., Fischer, H., Ganzeveld, L., Harder, H., Lawrence, M. G., Martinez, M., Taraborrelli, D., and Williams, J.: Atmospheric oxidation capac-ity sustained by a tropical forest, Nature, 452, 737–740, 2008. Martin, R. V., Chance, K., Jacob, D. J., Kurosu, T. P., Spurr, R. J. D.,
Bucsela, E., Gleason, J. F., Palmer, P. I., Bey, I., Fiore, A. M., Li, Q., Yantosca, R. M., and Koelemeijer, R. B. A.: An improved retrieval of tropospheric nitrogen dioxide from GOME, J. Geo-phys. Res., 107, 4437, doi:10.1029/2001JD001027, 2002. M¨uller, J.-F., Stavrakou, T., Wallens, S., De Smedt, I., Van
Roozen-dael, M., Potosnak, M. J., Rinne, J., Munger, B., Goldstein, A., and Guenther, A. B.: Global isoprene emissions estimated using MEGAN, ECMWF analyses and a detailed canopy environment model, Atmos. Chem. Phys., 8, 1329–1341, doi:10.5194/acp-8-1329-2008, 2008.
Munro, R., Eisinger, M., Anderson, C., Callies, J., Corpaccioli, E., Lang, R., Lefebvre, A., Livschitz, Y., and Albi˜nana, A. P.: GOME-2 on MetOp, in: Proceedings of The 2006 EUMETSAT
Meteorological Satellite Conference, Helsinki, Finland, 12–16 June 2006, 48, available at: http://www.eumetsat.int/, 2006. Myriokefalitakis, S., Vrekoussis, M., Tsigaridis, K., Wittrock, F.,
Richter, A., Br¨uhl, C., Volkamer, R., Burrows, J. P., and Kanaki-dou, M.: The influence of natural and anthropogenic secondary sources on the glyoxal global distribution, Atmos. Chem. Phys., 8, 4965–4981, doi:10.5194/acp-8-4965-2008, 2008.
Ohara, T., Akimoto, H., Kurokawa, J., Horii, N., Yamaji, K., Yan, X., and Hayasaka, T.: An Asian emission inventory of anthropogenic emission sources for the period 1980–2020, At-mos. Chem. Phys., 7, 4419–4444, doi:10.5194/acp-7-4419-2007, 2007.
Olivier, J .G. J., Berdowski, J. J. M., Peters, J. A. H. W., Bakker, J., Visschedijk, A. J. H., and Bloos, J.-P. J.: Applications of EDGAR. Including a description of EDGAR 3.0: refer-ence database with trend data for 1970–1995, RIVM, Bilthoven, RIVM report no. 773301 001/NOP report no. 410200 051, 2001. Olivier, J .G. J.: Part III: Greenhouse gas emissions. 1. Shares and trends in greenhouse gas emissions; 2. Sources and methods: greenhouse gas emissions for 1990 and 1995 in CO2emissions
from fuel combustion 1971–2000, International Energy Agency, Paris, ISBN 92-64-09794-5, 1–31, 2002.
Palmer, P., Jacob, D., Chance, K., Martin, R., Spurr, R., Kurosu, T., Bey, I., Yantosca, R., Fiore, A., and Li, Q.: Air mass factor formulation for spectroscopic measurements from satellites: Ap-plication to formaldehyde retrievals from the Global Ozone Mon-itoring Experiment, J. Geophys. Res., 106(D13), 14539–14550, 2001.
Palmer, P. I., Jacob, D. J., Fiore, A. M., Martin, R. V., Chance, K., and Kurosu, T. P.: Mapping isoprene emissions over North America using formaldehyde column observations from space, J. Geophys. Res., 108(D6), 4180, doi:10,1029/2002JD002153, 2003.
Peeters, J., Nguyen, T. L., and Vereecken, L.: HOx radical regener-ation in the oxidregener-ation of isoprene, Phys. Chem. Chem. Phys., 11, 5935–5939, doi:10.1039/b908511d, 2009.
Peeters, J. and M¨uller, J.-F.: HOxradical regeneration in isoprene
oxidation via peroxy radical isomerisations, II: Experimental ev-idence and global impact, Phys. Chem. Chem. Phys., 12, 14227– 14235, doi:10.1039/C0CP00811G, 2010.
Platt, U. and Stutz, J.: Differential Optical Absorption Spec-troscopy: Principles and Applications. Physics of Earth and Space Environments, Ed. Springer, ISBN: 978-3-540-21193-8, 2008.
Pope, R. M. and Fry, E. S.: Absorption spectrum (380–700 nm) of pure water. II. Integrating cavity measurements, Appl. Opt., 36, 8710–8723, 1997.
Richter, A. and Wagner, T.: Diffuser plate spectral structures and their influence on GOME slant columns, Technical note, available online at: http://www.iup.uni-bremen.de/gome/data/ diffuser gome.pdf, 2001.
Richter, A. and Burrows, J. P.: Retrieval of Tropospheric NO2from
GOME Measurements, Adv. Space Res., 29(11), 1673–1683, 2002.
Rodgers, C. D.: Inverse Methods for Atmospheric Sounding, The-ory and Practice, World Scientific Publishing, Singapore, 2000. Rothman, L. S., Jacquemart, D., Barbe, A., Chris Benner, D., Birk,
R. R., Goldman, A., Hartmann, J.-M., Jucks, K. W., Maki, A. G., Mandin, J.-Y., Massie, S. T., Orphal, J., Perrin, A., Rinsland, C. P., Smith, M. A. H., Tennyson, J., Tolchenov, R. N., Toth, R. A., Vander Auwera, J., Varanasi, P., and Wagner, G.: The HITRAN 2004 molecular spectroscopic database, J. Quant. Spectrosc. Ra-diat. Transfer, 96, 139–204, 2005.
Saunders, S. M., Jenkin, M. E., Derwent, R. G., and Pilling, M. J.: Protocol for the development of the Master Chemical Mech-anism, MCM v3 (Part A): tropospheric degradation of non-aromatic volatile organic compounds, Atmos. Chem. Phys., 3, 161–180, doi:10.5194/acp-3-161-2003, 2003.
Siddans, R., Latter, B. G., Kerridge, B. J., Smeets, J., Otter, G., and Slijkhuis, S.: Analysis of GOME-2, Slit function Measurements Final Report, Eumetsat Contract No. EUM/CO/04/1298/RM, 2006.
Sinreich, R., Coburn, S., Dix, B., and Volkamer, R.: Ship-based detection of glyoxal over the remote tropical Pacific Ocean, Atmos. Chem. Phys., 10, 11359–11371, doi:10.5194/acp-10-11359-2010, 2010.
Smith, R. C. and Mobley, C. D.: Underwater Light, in: Photobiol-ogy: the science of life and light, 2nd Ed., Bj¨orn L.O., Springer, New York, USA, 131–138, doi:10.1007/978-0-387-72655-7 7, 2007.
Spurr, R.: LIDORT and VLIDORT: Linearized pseudo-spherical scalar and vector discrete ordinate radiative transfer models for use in remote sensing retrieval problems, in: Light Scattering Re-views, edited by: Kokhanovsky, A., Springer, 3, 229–275, 2008. Stavrakou, T., M¨uller, J.-F., De Smedt, I., Van Roozendael, M., van der Werf, G. R., Giglio, L., and Guenther, A.: Evaluating the performance of pyrogenic and biogenic emission inventories against one decade of space-based formaldehyde columns, At-mos. Chem. Phys., 9, 1037–1060, doi:10.5194/acp-9-1037-2009, 2009a.
Stavrakou, T., M¨uller, J.-F., De Smedt, I., Van Roozendael, M., Kanakidou, M., Vrekoussis, M., Wittrock, F., Richter, A., and Burrows, J. P.: The continental source of glyoxal es-timated by the synergistic use of spaceborne measurements and inverse modelling, Atmos. Chem. Phys., 9, 8431–8446, doi:10.5194/acp-9-8431-2009, 2009b.
Theys, N., Van Roozendael, M., Hendrick, F., Fayt, C., Hermans, C., Baray, J.-L., Goutail, F., Pommereau, J.-P., and De Mazi`ere, M.: Retrieval of stratospheric and tropospheric BrO columns from multi-axis DOAS measurements at Reunion Island (21◦S,
56◦E), Atmos. Chem. Phys., 7, 4733–4749,
doi:10.5194/acp-7-4733-2007, 2007.
van der Werf, G. R., Randerson, J. T., Giglio, L., Collatz, G. J., Mu, M., Kasibhatla, P. S., Morton, D. C., DeFries, R. S., Jin, Y., and van Leeuwen, T. T.: Global fire emissions and the contribution of deforestation, savanna, forest, agricultural, and peat fires (1997– 2009), Atmos. Chem. Phys., 10, 11707–11735, doi:10.5194/acp-10-11707-2010, 2010.
Van Roozendael, M., Loyola, D., Spurr, R., Balis, D., Lam-bert, J.-C., Livschitz, Y., Valks, P., Ruppert, T., Kenter, P., Fayt, C., and Zehner, C.: Ten years of GOME/ERS-2 total ozone data – The new GOME data processor (GDP) version 4: 1. Algorithm description, J. Geophys. Res., 111, D14311, doi:10.1029/2005JD006375, 2006.
Vandaele A.-C., Hermans, C., Simon, P. C., Carleer, M., Colin, R., Fally, S., M´erienne, M. F., Jenouvrier, A., and Co-quart, B.: Measurements of the NO2 absorption cross-section from 42 000 cm−1to 10 000 cm−1(238–1000 nm) at 220 K and 294 K, J. Quant. Spectrosc. Radiat. Transfer, 59, 171–184, 1998. Vasilkov, A. P., Joiner, J., Gleason, J., and Bhartia, P.: Ocean Raman scattering in satellite backscatter UV measurements, Geophys. Res. Lett., 29, 1833, doi:10.1029/2002GL014955, 2002. Volkamer, R., Spietz, P., Burrows, J., and Platt, U.: High-resolution
absorption cross-section of glyoxal in the UV-vis and IR spectral ranges, J. Photochem. Photobiol. A: Chemistry, 172(1), 35–46, 2005a.
Volkamer, R., Molina, L. T., Molina, M. J., Shirley, T., and Brune, W. H.: DOAS measurement of glyoxal as an indicator for fast VOC chemistry in urban air, Geophys. Res. Lett., 32, L08806, doi:10.1029/2005GL022616, 2005b.
Volkamer, R., Coburn, S. C., Dix, B. K., and Sinreich, R.: The East-ern Pacific Ocean is a source for short lived atmospheric gases: Glyoxal and iodine oxide, CLIVAR Exchanges, 15, 30–33, 2010. Vrekoussis, M., Wittrock, F., Richter, A., and Burrows, J. P.: Tem-poral and spatial variability of glyoxal as observed from space, Atmos. Chem. Phys., 9, 4485–4504, doi:10.5194/acp-9-4485-2009, 2009.
Vrekoussis, M., Wittrock, F., Richter, A., and Burrows, J. P.: GOME-2 observations of oxygenated VOCs: what can we learn from the ratio glyoxal to formaldehyde on a global scale?, Atmos. Chem. Phys., 10, 10145–10160, doi:10.5194/acp-10-10145-2010, 2010.
Wang, P., Stammes, P., van der A, R., Pinardi, G., and van Roozen-dael, M.: FRESCO+: an improved O2 A-band cloud retrieval algorithm for tropospheric trace gas retrievals, Atmos. Chem. Phys., 8, 6565–6576, doi:10.5194/acp-8-6565-2008, 2008. Warneke, C., de Gouw, J. A., Del Negro, L., Brioude, J.,
McK-een, S., Stark, H., Kuster, W. C., Goldan, P. D., Trainer, M., Fehsenfeld, F. C., Wiedinmyer, C., Guenther, A. B., Hansel, A., Wisthaler, A., Atlas, E., Holloway, J. S., Ryerson, T. B., Peis-chl, J., Huey, L. G., and Case Hanks A. T.: Biogenic emission measurement and inventories determination of biogenic emis-sions in the eastern United States and Texas and comparison with biogenic emission inventories, J. Geophys. Res., 115, D00F18, doi:10.1029/2009JD012445, 2010.