ACPD
15, 15355–15396, 2015Black carbon, particle number concentration and
nitrogen oxide emission factors
I. Ježek et al.
Title Page
Abstract Introduction
Conclusions References
Tables Figures
◭ ◮
◭ ◮
Back Close
Full Screen / Esc
Printer-friendly Version Interactive Discussion
Discussion
P
a
per
|
Discussion
P
a
per
|
Discussion
P
a
per
|
Discussion
P
a
per
|
Atmos. Chem. Phys. Discuss., 15, 15355–15396, 2015 www.atmos-chem-phys-discuss.net/15/15355/2015/ doi:10.5194/acpd-15-15355-2015
© Author(s) 2015. CC Attribution 3.0 License.
This discussion paper is/has been under review for the journal Atmospheric Chemistry and Physics (ACP). Please refer to the corresponding final paper in ACP if available.
Black carbon, particle number
concentration and nitrogen oxide
emission factors of random in-use
vehicles measured with the on-road
chasing method
I. Ježek1, T. Katrašnik2, D. Westerdahl3, and G. Močnik1 1
Aerosol d.o.o., Ljubljana, Slovenia 2
University of Ljubljana, Faculty of Mechanical engineering, Ljubljana, Slovenia 3
Cornell University, Sibley School of Mechanical and Aerospace Engineering, Ithaca, NY 14853, USA
Received: 11 May 2015 – Accepted: 15 May 2015 – Published: 8 June 2015
Correspondence to: I. Ježek ([email protected]) and G. Močnik ([email protected])
ACPD
15, 15355–15396, 2015Black carbon, particle number concentration and
nitrogen oxide emission factors
I. Ježek et al.
Title Page
Abstract Introduction
Conclusions References
Tables Figures
◭ ◮
◭ ◮
Back Close
Full Screen / Esc
Printer-friendly Version Interactive Discussion
Discussion
P
a
per
|
Discussion
P
a
per
|
Discussion
P
a
per
|
Discussion
P
a
per
|
Abstract
The chasing method was used in an on-road measurement campaign, and emission factors (EF) of black carbon (BC), particle number (PN) and nitrogen oxides (NOx) were
determined for 139 individual vehicles of different types encountered on the roads. The aggregated results provide EFs for BC, NOxand PN for three vehicle categories: goods
5
vehicles, gasoline and diesel passenger cars. This is the first on-road measurement study where BC EFs of numerous individual diesel cars were determined in real-world driving conditions. We found good agreement between EFs of goods vehicles deter-mined in this campaign and the results of previous studies that used either chasing or remote sensing measurement techniques. The composition of the sampled car fleet 10
determined from the national vehicle registry information is reflective of Eurostat sta-tistical data on the Slovenian and European vehicle fleet. The median BC EF of diesel and gasoline cars that were in use for less than 5 years, decreased by 60 and 47 % from those in use for 5–10 years, respectively, the median NOxand PN EFs, of goods
vehicles that were in use for less than five years, decreased from those in use for 5– 15
10 years by 52 and 67 %, respectively. The influence of engine maximum power of the measured EFs showed an increase in NOxEF from least to more powerful vehicles with
diesel engines. Finally a disproportionate contribution of high emitters to the total emis-sions of the measured fleet was found; the top 25 % of emitting diesel cars contributed 63, 47 and 61 % of BC, NOx and PN emissions respectively. With the combination of
20
relatively simple on-road measurements with sophisticated post processing individual vehicles EF can be determined and useful information about the fleet emissions can be obtained by exactly representing vehicles which contribute disproportionally to vehicle fleet emissions; and monitor how the numerous emission reduction approaches are reflected in on-road driving conditions.
ACPD
15, 15355–15396, 2015Black carbon, particle number concentration and
nitrogen oxide emission factors
I. Ježek et al.
Title Page
Abstract Introduction
Conclusions References
Tables Figures
◭ ◮
◭ ◮
Back Close
Full Screen / Esc
Printer-friendly Version Interactive Discussion
Discussion
P
a
per
|
Discussion
P
a
per
|
Discussion
P
a
per
|
Discussion
P
a
per
|
1 Introduction
Traffic is a diverse and important source of air pollution and is complex to describe in terms of per vehicle emissions. The amount of emitted pollutants depends on in-dividual vehicle parameters, the engine type and displacement, the type of exhaust after-treatment system, fuel quality, maintenance status, traffic situations, topography, 5
driver behavior and weather conditions. Owing to the large number of variables, diff er-ent statistical analyses and measuremer-ent approaches have been employed in order to evaluate traffic emissions. These vary in complexity in terms of describing traffic activity and emission factor (EF) determination. Franco et al. (2013) define EFs as different empirical functional relations of emitted pollutants to the activity that causes 10
them. Most standardized and robust EFs were found to be produced in laboratories using dynamometer tests with prescribed driving cycles. These tests can produce: (a) aggregated or bag results with respect to the mean speed or some other kinematic parameter (e.g. mean acceleration) of a driving cycle; or (b) instantaneous emission data, where the emissions values measured can be related to recorded instantaneous 15
kinematic or engine covariates (Perrone et al., 2014). But the nature and conditions of the tests limits both the number of vehicles tested and the application to many on-road or so-called “real world” conditions. In order to validate the emission model predictions and to compare their performance to actual vehicle emissions, “real world” EF mea-surement techniques have been developed (Franco et al., 2013). These employ diff er-20
ent techniques for measuring numerous vehicles in use in actual traffic situations: the measurements were performed through the use of remote sensing next to the roads, following vehicles on the roads, the use of on-board diagnostics data, or from data taken in tunnels (some of the first such experiments may be found in Bishop et al., 1996; Hansen and Rosen, 1990; Weingartner et al., 1997).
25
ACPD
15, 15355–15396, 2015Black carbon, particle number concentration and
nitrogen oxide emission factors
I. Ježek et al.
Title Page
Abstract Introduction
Conclusions References
Tables Figures
◭ ◮
◭ ◮
Back Close
Full Screen / Esc
Printer-friendly Version Interactive Discussion
Discussion
P
a
per
|
Discussion
P
a
per
|
Discussion
P
a
per
|
Discussion
P
a
per
|
uncontrolled parameters introducing variability, such as environmental or traffic condi-tions, driver behavior or highly transient operations (Franco et al., 2013). The on-road measurements have some inherent drawbacks. Two possible shortcomings are that the remote-sensing method can provide only a snapshot of the vehicle emissions and not how the emissions vary during the trip (Franco et al., 2013) and that the on-road chas-5
ing method cannot be used in a dense traffic situations, where emissions from other vehicles’ would disturb the background measurements (Ježek et al., 2015; Wang et al., 2011). Their advantage over laboratory measurements is that, over a short period of time, a large number of in-use vehicles can be measured and a representative emission factor distribution for different vehicle categories can be obtained. Most of the previous 10
on-road BC emission factor measurements for individual vehicles were performed on diesel fueled trucks and on cars with the spark ignition engine, henceforth referred to as gasoline cars (Ban-Weiss et al., 2009; Dallmann et al., 2011, 2012, 2014; Hansen and Rosen, 1990; Wang et al., 2011, 2012). Many of these studies revealed that a small percentage of vehicles – the so-called super emitters; contribute disproportionately to 15
total vehicle emissions. Ban-Weiss et al. (2009) demonstrated that 10 % of the trucks contributed 40 % of the BC and PN emissions. Wang et al. (2011) showed that, in their measured fleet, 20 % of the trucks contributed 50 % of the carbon monoxide (CO) and PN0.5emissions, 60 % of the PM0.5(the particle number concentration – PN; and par-ticulate mass concentration (PM) subscripts denote here the largest mobility diameter 20
[µm] of aerosol particles measured, in this case aerosol particles of 0.5 µm and smaller) and over 70 % of black carbon (BC) emissions. Bishop and Stedman (2008) report the same trend for nitrogen oxides (NOx), CO and hydrocarbons (HC). The advantage of individual vehicle measurements over average fleet emission factors, as is often ex-pressed by dynamometer or portable emission measurement system (PEMS) studies, 25
ACPD
15, 15355–15396, 2015Black carbon, particle number concentration and
nitrogen oxide emission factors
I. Ježek et al.
Title Page
Abstract Introduction
Conclusions References
Tables Figures
◭ ◮
◭ ◮
Back Close
Full Screen / Esc
Printer-friendly Version Interactive Discussion
Discussion
P
a
per
|
Discussion
P
a
per
|
Discussion
P
a
per
|
Discussion
P
a
per
|
Previous studies using the chasing method for EF measurements in real driving con-ditions were performed on fleets of buses, light duty vehicles (LGV) with gasoline en-gines and heavy-goods vehicles (HGV) with diesel enen-gines (Canagaratna et al., 2004; Herndon et al., 2005; Schneider et al., 2008; Shorter et al., 2005; Wang et al., 2011, 2012). Shorter et al. (2005) discuss the effectiveness of the NOx emission reduction 5
in different engine and exhaust system technologies, which had been introduced to the New York bus fleet. They found that NOx emissions from diesel and Compressed Natural Gas (CNG) buses were comparable and that diesel hybrid electric buses had approximately one-half the NOx emissions. They also found that in the group of diesel
buses equipped with continuously regenerating technology (CRT), nitrogen dioxide 10
(NO2) represented a third of emitted NOx, while in non–CRT buses emissions, the per-centage of NO2was less than 10 %. Similar NO2to NOx ratios were found by Carslaw
and Rhys-Tyler (2013) who used a remote sensing technique to measure the emissions of almost 70 000 vehicles in UK, where 30 % of NOxwere emitted as NO2by Enhanced Environmentally friendly Vehicles (EEV). The EEV is a recommended standard in the 15
European Union for HGVs with lower PM emission values than a Euro VI vehicle but the same NOx standard as a Euro V.
Wang et al. (2011) measured the EF of BC, CO and PM0.5 on a fleet of 230 trucks and 57 buses in China, and identified “heavy emitters” in the road fleet. They found that 5 % of the trucks contributed 50 % of the BC emissions, and 20 % of the trucks con-20
tributed 50 % of the CO and PM0.5emissions. Furthermore they found that the EFs of trucks registered outside Beijing were significantly higher than those that were subject to the stricter engine and fuel quality standards enforced in Beijing. They concluded that restricting the emissions of trucks only in Beijing is not sufficient to reduce traffi c-related air pollution in there due to the number of out of area trucks that operate in 25
ACPD
15, 15355–15396, 2015Black carbon, particle number concentration and
nitrogen oxide emission factors
I. Ježek et al.
Title Page
Abstract Introduction
Conclusions References
Tables Figures
◭ ◮
◭ ◮
Back Close
Full Screen / Esc
Printer-friendly Version Interactive Discussion
Discussion
P
a
per
|
Discussion
P
a
per
|
Discussion
P
a
per
|
Discussion
P
a
per
|
440 on-road trucks, measuring the EF of NOx and BC. They found that the measures taken in Beijing were effective for the BC emissions of trucks that were from that area, but they did not observe such a trend for NOx emissions.
An extensive on-road measurement study was performed in the UK by Carslaw and Rhys-Tyler (2013). They employed a remote sensing technique to measure the emis-5
sions of NO, NO2and NH3on a fleet of almost 70 000 individual vehicles which included also vans, passenger cars with a compression ignition engine (henceforth referred to as diesel cars), and gasoline cars. Matching these to vehicle registration data, they found that only gasoline fuelled vehicles had shown an appreciable reduction in NOx
emissions over the past 15–20 years, whereas diesel fuelled vehicles have not. They 10
found that there was an influence of vehicle manufacturer for Euro 4/5 vehicles and that Euro 4/5 diesel vehicles with smaller displacements emit less NO than those with larger displacements.
According to the European Automobile Manufacturers’ Association (ACEA) the mo-torization in Europe is increasing for passenger cars and the commercial vehicle fleet – 15
by about 50 % in two decades (1990–2010). Fleet trends show that the percentage of diesel cars is also rising from about 30 % in 2000 to about 60 % in 2011, and that most popular passenger cars by segment are small and lower medium cars which respec-tively represent 34.2 and 22.1 % of all new cars sold in Europe in 2011 (ACEA, 2012). A slightly smaller percentage of diesel cars (55 %) was reported by the European En-20
vironment Agency (EEA, 2013a) who, in their report titled “Monitoring CO2 emissions from new passenger cars in the EU”. They state that the average car weight was at its highest in the last nine years, the average engine capacity had decreased by 5 % since 2007, and, despite of these changes, the improved vehicle technology has led to greater fuel efficiency and lower average CO2emissions per kilometer travelled (EEA, 25
ACPD
15, 15355–15396, 2015Black carbon, particle number concentration and
nitrogen oxide emission factors
I. Ježek et al.
Title Page
Abstract Introduction
Conclusions References
Tables Figures
◭ ◮
◭ ◮
Back Close
Full Screen / Esc
Printer-friendly Version Interactive Discussion
Discussion
P
a
per
|
Discussion
P
a
per
|
Discussion
P
a
per
|
Discussion
P
a
per
|
“real-world” fuel consumption and CO2values for cars in Europe and the United States. The report contained and assessment of the results of several on-road driving datasets from various European countries, where they found underestimation by type-approved measurements relative to on-road CO2 emissions. Namely, in 2001, the discrepancy between the two had been below 10 % and increased to around 25 % by 2011, with 5
“real-world” emissions being higher than emissions according to type-approval. The same report also clarifies that their analysis does not suggest that manufacturers have done anything illegal. Instead it is suggested that the NEDC was not appropriate to use for indicating fuel consumption as it was originally not designed to measure this, nor was it designed to measure CO2emissions. Some features of the test procedure 10
can be exploited to influence test results, resulting in unrealistically low CO2 emission levels. These issues are being addressed by the United Nations through the develop-ment of a new vehicle test procedure, among other things (Mock et al., 2013). Based on the limited availability of the data that were used in previous studies, we postulate that using on-road emission factors from a representative vehicle fleet could contribute 15
significantly to models’ emission predictions. EF determination of a representative on-road sample would include additional sources of variability which can be controlled in the laboratory but not in real world driving conditions.
BC, NOx and PN are emitted from internal combustion engines and negatively im-pact people’s health. The three pollutants do not have the same formation process 20
(Heywood, 1988; Kittelson et al., 2006). A more detailed description may be found in Supplement S1. It has been shown that increased BC concentrations are a better in-dicator of hazardous health effects of aerosol particle air pollution than the increase in the legislated particle mass concentrations (Janssen et al., 2012); and that it is after CO2the second most important contributor to global warming (Bond et al., 2013). 25
ACPD
15, 15355–15396, 2015Black carbon, particle number concentration and
nitrogen oxide emission factors
I. Ježek et al.
Title Page
Abstract Introduction
Conclusions References
Tables Figures
◭ ◮
◭ ◮
Back Close
Full Screen / Esc
Printer-friendly Version Interactive Discussion
Discussion
P
a
per
|
Discussion
P
a
per
|
Discussion
P
a
per
|
Discussion
P
a
per
|
to their hazardous effects on health and environment and for the comparison purposes to previous studies. We used the chasing technique (Wang et al., 2011) and the running integration approach to calculate individual vehicles EF (Ježek et al., 2015), because it enables us to measure not only EFs of numerous individual in-use vehicles, but also how their EFs change in time, giving us individual vehicle’s EF distribution. We analyze 5
EF distribution within the vehicle category by using the median EF value of individual vehicle’s EF distribution and compare our results to those of other chasing and remote sensing studies. We obtained registration information of the chased vehicles to demon-strate the effects of vehicle age, vehicle maximum engine power, the ratio of maximum power to vehicle size, and finally, the contribution of high emitters to the total emissions 10
of our measured fleet. We report the first on-road determination of BC, NOx and PN EFs of passenger cars measured with the chasing method and the first BC EFs of individual diesel cars measured in real driving conditions.
2 Methodology
We performed our measurements in December 2011 over the course of 7 days 15
on Slovenian highways and regional roads, measuring predominantly the Slovenian vehicle fleet (stills from the measurement campaign are presented in Supplement Fig. S1). Slovenia is a country positioned south of the Alps, next to the Adriatic and opening to the Balkan and East European region Slovenian highways are part of the V. (Venice–Trieste/Koper–Ljubljana–Budapest–Kiev) and X. (Salzburg–Ljubljana– 20
Zagreb–Belgrade–Thessaloniki) trans-European corridors and are thus an important connection between central and east European states, especially for the transport of goods. As a result, foreign vehicles were also encountered and measured in our cam-paign.
In EF analysis we included any vehicle which emissions and background concen-25
ACPD
15, 15355–15396, 2015Black carbon, particle number concentration and
nitrogen oxide emission factors
I. Ježek et al.
Title Page
Abstract Introduction
Conclusions References
Tables Figures
◭ ◮
◭ ◮
Back Close
Full Screen / Esc
Printer-friendly Version Interactive Discussion
Discussion
P
a
per
|
Discussion
P
a
per
|
Discussion
P
a
per
|
Discussion
P
a
per
|
analysis was determined on-road and confirmed with video recordings of each chase. For most vehicles we measured the background concentrations before and after the chase, in few instances we used only one – measured before or after the chase. On average each chase lasted for two minutes and a half, with the shortest chase lasting for 47 s and the longest for 396 s. In the final analysis we excluded 10 cars because 5
we could not obtain registration information needed to categorize them as a diesel or a gasoline car.
The mobile measurement platform used for the on-road chasing measurements is described in detail in Ježek et al. (2015). We used instruments with high time reso-lution (1 to 10 s) the Carbocap GMP343 (Vaisala) to measure CO2, the Aethalometer 10
AE33 prototype versionβ (Aerosol d.o.o.), the Fast Mobility Particle seizer (TSI), for the on-road campaign we added also a Nitric Oxide Monitor and an NO2 converter (models 410 and 401, 2B Technologies). For the Nitric Oxide Monitor the sampling line was a Teflon tube, while for the rest we used static-dissipative tubing. The instrumental details and measurement uncertainties are summarized in Table 1. The Aethalometer 15
data was compensated for the loading effect using the Drinovec et al. (2015) compen-sation algorithm.
2.1 Emission factor calculation
We calculated the emission factor as the pollutant (P) per kg of fuel consumed, as-suming the equal dilution of all emitted pollutants and complete combustion of the fuel, 20
where almost all the carbon in the fuel is oxidized to CO2(Ban-Weiss et al., 2009; Dall-mann et al., 2011; Hansen and Rosen, 1990), the fuel consumption can be estimated by measuring the CO2emissions.
EFP =
Rti
tj Ptj−Pti
dt
a·Rtitj CO2tj−CO2ti
dt·
ACPD
15, 15355–15396, 2015Black carbon, particle number concentration and
nitrogen oxide emission factors
I. Ježek et al.
Title Page
Abstract Introduction
Conclusions References
Tables Figures
◭ ◮
◭ ◮
Back Close
Full Screen / Esc
Printer-friendly Version Interactive Discussion
Discussion
P
a
per
|
Discussion
P
a
per
|
Discussion
P
a
per
|
Discussion
P
a
per
|
The coefficienta in denominator represents the mass ratio between C and CO
2:a=
12 : 44=0.2727; thus converting the mass concentration of CO2 in Eq. (1) to units of mass concentration of C (mg C per m−3). The carbon fraction in fuelwcfor both gaso-line and diesel was set to 0.86 (Huss et al., 2013). The subscriptstiandtjdenote the time of the beginning and end of integration step, respectively. NOxwas treated as NO2 5
equivalent with molar mass 46 g mol−1(USEPA, 2010; Wang et al., 2012). We used the running integration approach with the 10 s integration step, to obtain individual vehicle’s time dependent EF, and thus its EF distribution. From the distribution we calculated the median value and used it as the representative EF value for the investigated vehicle.
The running integration approach is described in more detail in Ježek et al. (2015) 10
where the chasing method has been tested on contemporary cars in controlled con-ditions. The results of the two integration approaches – the bulk integration from the beginning and to the end of the chase (Wang et al., 2011) and running integration, have already been compared in Ježek et al. (2015). Here we again perform the comparison on a larger number of measured vehicles. The regressions between the two methods 15
for all three investigated pollutants (BC, NOx and PN) are presented in Fig. 1. For all
three pollutants the Pearson’sr’ coefficient was at least 0.97, all three intercepts were close to zero. The bulk integration method gives somewhat larger EFs than the running integration for BC and PN, while the slope is very close to unity for NOx. Whilst BC and
PN bulk integration overestimated the median EF by 9 and 14 % respectively, the bulk 20
integration for NOx EF underestimated the median EFs by 2 %. The slight underesti-mation of bulk NOx EFs was probably because the instrument for NOx measurements
had lower time resolution (10 s) than other instruments (1 or 2 s), thus super emission peaks were not as clearly resolved as they were for BC and PN.
2.2 Vehicle classification and fleet description 25
ACPD
15, 15355–15396, 2015Black carbon, particle number concentration and
nitrogen oxide emission factors
I. Ježek et al.
Title Page
Abstract Introduction
Conclusions References
Tables Figures
◭ ◮
◭ ◮
Back Close
Full Screen / Esc
Printer-friendly Version Interactive Discussion
Discussion
P
a
per
|
Discussion
P
a
per
|
Discussion
P
a
per
|
Discussion
P
a
per
|
Infrastructure and Spatial Planning; contained information about each vehicle category according to the Directive 2001/116/EC (2002), the fuel used, the date the vehicle first entered into service, curb weight, engine displacement and the maximum net power, where the maximum net power is defined as the maximum value of the net power mea-sured at full engine load (UNECE Regulation No 85, 2013) and the curb weight is the 5
weight of the vehicle without the driver or any other additional load (Regulation No. 540/2014 of the European parliament, 2014).
For 2011 (the year our measurement study was conducted) we used the Eurostat ve-hicle feet statistics (for Europe and Slovenia); Slovenian National Interoperability (NIO) portal (http://nio.gov.si/), where we gained detailed information on Slovenian car fleet; 10
and compared them to our measured fleet. The Eurostat statistics for cars in Europe include countries that reported not only the total number of cars but also the informa-tion on which fuel they used and their respective engine displacements (the countries included are listed in the Supplement S2). Of the 207 185 950 passenger cars in-use, 61 % used gasoline fuels and 34 % used diesel.
15
Our vehicle classification to categories was based on that of vehicle registration infor-mation, according to the Commission Directive 2001/116/EC (European Communities, 2002). In Europe vehicles with more than four wheels are organized according their purpose to categories M, N and O, on the first level. Category M includes vehicles for the transport of passengers, category N comprises commercial vehicles for the 20
transport of goods, and category O includes trailers (and semi-trailers). Further cate-gorization of category M pertains to the number of passenger seats and the vehicle’s maximum allowed weight, whereas the N and O categories are further segmented re-garding to the vehicle’s maximum allowed weight. This classification, with further sub categories, is then, among other things, also used for prescribing emission standards 25
ACPD
15, 15355–15396, 2015Black carbon, particle number concentration and
nitrogen oxide emission factors
I. Ježek et al.
Title Page
Abstract Introduction
Conclusions References
Tables Figures
◭ ◮
◭ ◮
Back Close
Full Screen / Esc
Printer-friendly Version Interactive Discussion
Discussion
P
a
per
|
Discussion
P
a
per
|
Discussion
P
a
per
|
Discussion
P
a
per
|
1760 kg); and N1-III (>1760) together with N2 (light commercial vehicles with a max-imum mass exceeding 3500 kg but below 12 000 kg). Depending on the vehicle’s use, the same vehicle can be registered as an M1 or N1. Similar categorization is used in the Eurostat data. There are also many other classifications of vehicles, that depend mostly on the purpose of their use.
5
We set up three main categories: diesel cars, gasoline cars and goods vehicles. In the gasoline cars category we included only M1 vehicles with spark ignition en-gines; in diesel cars category we included M1 cars with compression ignition engine and light goods vehicles categorized as N1; other vehicles categorized as N2, N3, M2 or M3 were all in the goods vehicle category. The categorization is summarized 10
in Table 2, where it is also indicated how it overlaps with the classification in Directive 2001/116/EC.
For some heavy goods vehicles, buses and light goods vehicles, we were unable to obtain the vehicle verification data (foreign vehicles and vehicles for which we were unable to note their license plates). These vehicles were only included in the results 15
when more detailed information (age, engine displacement or power) about the vehicle was not needed and the vehicle’s category could be determined solely from their visual appearance. Thus, we kept the heavy goods vehicles and vans for which we did not have registration information but could categorize them as N1, N2 or N3, based on their appearance. Emission factor measurement results
20
Our total vehicle fleet sample was 139 vehicles; it consisted of 75 passenger cars (M1) of which 51 were diesel and 24 gasoline cars; 6 buses (M3); 1 mini bus (M2); 26 light goods vehicles, of which 17 were category N1 and 8 were category N2; and 32 heavy goods vehicles (N3). We were unable to obtain the registry data for 2 buses, 4 of the light goods vehicles (2 categorized as N1 and 2 as N2), and 15 of the heavy goods 25
vehicles (N3). The fleet sample is summarized in Table 2.
ACPD
15, 15355–15396, 2015Black carbon, particle number concentration and
nitrogen oxide emission factors
I. Ježek et al.
Title Page
Abstract Introduction
Conclusions References
Tables Figures
◭ ◮
◭ ◮
Back Close
Full Screen / Esc
Printer-friendly Version Interactive Discussion
Discussion
P
a
per
|
Discussion
P
a
per
|
Discussion
P
a
per
|
Discussion
P
a
per
|
compare them to results of other similar studies in Sect. 2.4. We further demonstrate how the EFs of each group depend on their age, engine maximum net power, and the ratio between engine maximum net power and vehicle mass in Sects. 2.5 and 2.6. In Sect. 2.7 we present the contribution of high emitters to the sampled fleet cumulative emissions.
5
2.3 Comparison of sampled vehicle fleet and Eurostat data
In order to establish the relationship of our data as representative of the Slovenian and the average European fleet, we used Eurostat data to compare the size and age com-position of the three investigated vehicle fleets. In Sect. 3.1.1 we show a comparison between the European, Slovenian and the campaign passenger car fleets (only M1 ve-10
hicles) according to the fuel used, engine displacement and age, and in Sect. 3.1.2 the composition of goods vehicle fleets (N1, N2 and N3) according to their size and age.
2.3.1 Passenger cars
From Table 3 we can see that the combination of cars in the European and Slovenian fleets are very similar. The percentage of diesel and gasoline cars in the European fleet 15
is 34 and 61 %, while the Slovenian fleet has 36 and 63 % of diesel and gasoline cars, respectively. The engine displacements of diesel or gasoline engines are similar. Both fleets show that most gasoline cars have engine displacements smaller than 1400 cm3 (49 and 61 % for European and Slovenian fleet respectively) and that only a small portion of gasoline cars have an engine displacement larger than 2000 cm3 (7 and 20
3 % for the European and Slovenian fleets, respectively). Most diesel powered cars have an engine displacement in the size range of 1400 to 2000 cm3 (76 and 79 % respectively); the fewest have an engine displacement smaller than 1400 cm3 (5 and 4 % respectively).
We can see a good agreement for both in the gasoline and diesel car engine dis-25
ACPD
15, 15355–15396, 2015Black carbon, particle number concentration and
nitrogen oxide emission factors
I. Ježek et al.
Title Page
Abstract Introduction
Conclusions References
Tables Figures
◭ ◮
◭ ◮
Back Close
Full Screen / Esc
Printer-friendly Version Interactive Discussion
Discussion
P
a
per
|
Discussion
P
a
per
|
Discussion
P
a
per
|
Discussion
P
a
per
|
had engine displacements smaller than 1400 cm3, followed by 42 % of cars with engine displacements in the range of 1400 to 1999 cm3and the fewest gasoline cars had en-gine displacements larger than 2000 cm3(8 %). For diesel cars, the share was – as in the European and Slovenian fleets – largest for 1400 to 1999 cm3sized engines (75 %), followed by 25 % of diesel cars with engine displacements larger than 2000 cm3. We 5
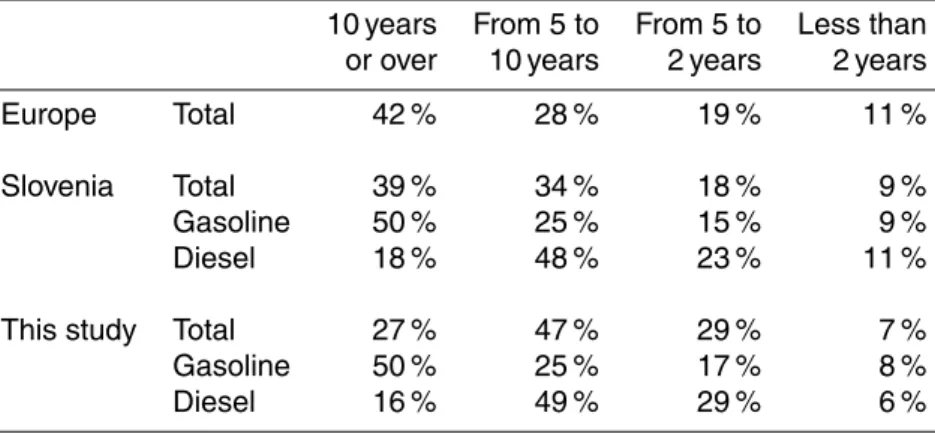
did not encounter any diesel cars with engine displacements smaller than 1400 cm3. European and Slovenian car fleet statistics also compare well if segregated by the age of the passenger cars. From Table 4 we can see that the two have almost the same percentage in all four age groups set by Eurostat; the largest difference between them is only 6 %. Most passenger cars in both fleets were in use for 10 years or more (42 10
and 39 % for the European and Slovenian fleets respectively), followed by the group of cars that was in use for between 5 and 10 years (28 and 34 % respectively), almost 20 % were in use for between 2 and 5 years and about 10 % were in use for less than 2 years.
Our total measured passenger car fleet consisted of somewhat more cars in the 15
ages of 2 to 10 years, and fewer vehicles that were over 10 years than were in the Slovenian and European fleets. Using the NIO database we separated Slovenian diesel and gasoline car fleet using 10, 5 and 2 years in use as delimiters. In Table 4 we can see that we get almost the same percentages in all bins for both diesel and gasoline cars in our measured fleet and the Slovenian car fleet. But because, unlike in European 20
or Slovenian fleet, there were more diesel than gasoline cars in our fleet, and because half of gasoline cars were older than 10 years and only 18 % of diesel cars were in that age group, the age of our total fleet does not match the Slovenian or European total car fleet age distribution.
During our measurements, our prime focus were diesel cars, because they are com-25
ACPD
15, 15355–15396, 2015Black carbon, particle number concentration and
nitrogen oxide emission factors
I. Ježek et al.
Title Page
Abstract Introduction
Conclusions References
Tables Figures
◭ ◮
◭ ◮
Back Close
Full Screen / Esc
Printer-friendly Version Interactive Discussion
Discussion
P
a
per
|
Discussion
P
a
per
|
Discussion
P
a
per
|
Discussion
P
a
per
|
of this study than there are in Europe or Slovenia in general and therefore the age of our total passenger car fleet does not match the total Slovenian nor European passen-ger car age groups. By analyzing the age distribution within diesel and gasoline cars separately we have shown that our two subcategories do indeed match the Slovenian fleet from which we sampled from and are thus representative for the Slovenian vehicle 5
fleet, and most likely also for the European car fleet, as the two are very similar.
2.3.2 Goods vehicles
Eurostat does not report the number of heavy goods vehicles as N1, N2 and N3, rather it reports the number of lorries (defined as: rigid road motor vehicle designed, exclu-sively or primarily, to carry goods) by their load capacity (defined as: maximum weight 10
of goods declared permissible by the competent authority of the country of registration of the vehicle). The data thus includes vehicles with a gross weight of not more than 3500 kg but excludes tow trucks. From Table 5 we can see that lorries with load capac-ity less than 1500 kg are most numerous in both Slovenian and European fleet and that the vehicles with load capacity over 10 000 kg are fewest. With Tables 5 and 6 (where 15
we report Eurostat data for the European and Slovenian fleet), we demonstrate that the Slovenian vehicle fleet from which we sampled the most vehicles from is representative of European average both regarding the size segregation and vehicle age. We could not make an indirect comparison of Eurostat data to our sample fleet because we did not get the load capacity reported for most of our measured vehicles, and because 20
the number of license plates we could collect was low. Nonetheless, we used the NIO database and found that in the Slovenian fleet there were 72 % of N3 goods vehicles weighing less than 12 000 kg that were not road tractors or special purpose vehicles, while in our fleet there were 57 % of such vehicles. We binned the vehicles according to their age: those that were in use for less than 10 years, 5 to 10, and less than 5 years. 25
ACPD
15, 15355–15396, 2015Black carbon, particle number concentration and
nitrogen oxide emission factors
I. Ježek et al.
Title Page
Abstract Introduction
Conclusions References
Tables Figures
◭ ◮
◭ ◮
Back Close
Full Screen / Esc
Printer-friendly Version Interactive Discussion
Discussion
P
a
per
|
Discussion
P
a
per
|
Discussion
P
a
per
|
Discussion
P
a
per
|
discrepancy is larger because of the larger diversity in vehicle size among the goods vehicles than for personal cars, and because our sample size is small.
2.4 Emission factors distributions and comparison to other studies
We determined EFs of different type vehicles, grouped them into three categories: gasoline cars, diesel cars and goods vehicles (as described in Sect. 2.2.), and present 5
their BC, NOx and PN EF distributions in Fig. 2. Because the formation paths for the three pollutants differ (see Supplement S1) and technological solutions for the three vehicle categories differ, also their EF distributions show different tendencies. The me-dian BC EF for diesel cars (0.79 g kg−1
) is the highest of the three vehicle groups, fol-lowed by goods vehicles (median 0.47 g kg−1), and gasoline cars (0.28 g kg−1), where 10
also the lowest BC EFs are to be found. The median of NOx EF distribution is high-est for goods vehicles (27.71 g kg−1), followed by diesel cars (15.43 g kg−1), and again
lowest for gasoline cars (6.34 g kg−1). We can observe similar trend with PN EF dis-tribution – highest median value for goods vehicles (11.49×10¹⁵kg−1), followed by
diesel cars (4.4×10¹⁵kg−1), and gasoline cars (1.95×10¹⁵kg−1). The shapes of the
15
PN distributions are different from the shapes of the NOx EF distributions. NOx EF distributions have the narrowest range of the three investigated pollutants for all three vehicle groups, while PN EF distributions are broad and in the case of goods vehicles even bimodal. They would remain bimodal even if buses and light goods vehicles (N2) would be excluded from the analysis.
20
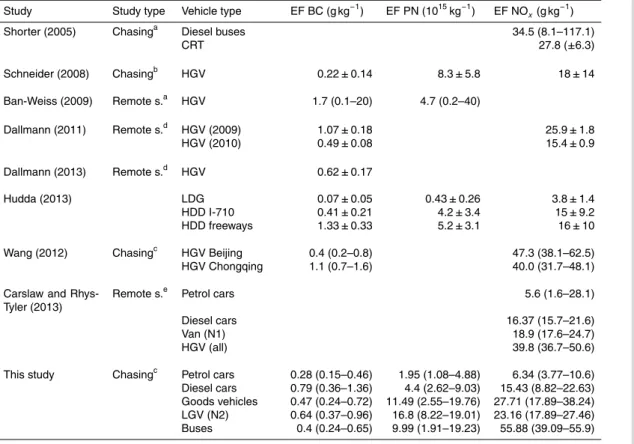
In Table 7 we compare the results of our study to other chasing and remote sens-ing studies that measured the same species (Ban-Weiss et al., 2009; Carslaw and Rhys-Tyler, 2013; Dallmann et al., 2011; Hudda et al., 2013; Schneider et al., 2008; Shorter et al., 2005; Wang et al., 2011, 2012). Remote sensing studies were included because good agreement between the results of the remote sensing and chasing tech-25
ACPD
15, 15355–15396, 2015Black carbon, particle number concentration and
nitrogen oxide emission factors
I. Ježek et al.
Title Page
Abstract Introduction
Conclusions References
Tables Figures
◭ ◮
◭ ◮
Back Close
Full Screen / Esc
Printer-friendly Version Interactive Discussion
Discussion
P
a
per
|
Discussion
P
a
per
|
Discussion
P
a
per
|
Discussion
P
a
per
|
the median value, of both techniques, is similar. We did not compare our results to other study types such as tunnel measurements, chassis dynamometer tests or mea-surements with portable emission measurement systems, as they have already been discussed in other studies (e.g. Shorter et al., 2005; Wang et al., 2012).
The BC EF median of goods vehicles we measured (0.47 g kg−1) resembles the 5
mean value of HGV fleet reported by Dallmann et al. in their 2011 study after addi-tional emission control was implemented (0.49 g kg−1); compares well to the results of Wang et al. (2012) for HGVs from the Beijing area (0.40 g kg−1), where there are also more strict emission control standards implemented as compared to surrounding provinces; and to the results of Hudda et al. (2013) who report 0.41 g kg−1BC EF for 10
high cargo route in California (I-710). While BC EFs of these studies (including ours) agree, NOx EFs do not. While NOx EFs were high in the Chinese study (47.3 and
40 g kg−1for Beijing and Chongqing respectively), they were much lower in the two US studies (∼15 g kg−1). The lower EF for the US studies may be due to a different mix of
vehicles due to promotion of the purchase of newer vehicles. The median value of the 15
NOx EF distribution (27.7 g kg−
1
) observed for goods vehicles resembles more the av-erage HDV fleet value reported by Dallmann et al. (2011) before the active replacement rule was implemented (25.9 g kg−1), and to the results of another US study (Shorter et al., 2005) where they report NOxEF for buses equipped with CRT (27.8 g kg−
1 ). The two European studies (Carslaw and Rhys-Tyler, 2013; Schneider et al., 2008) report 20
similar NOx EF for different vehicle types – while Schneider et al. (2008) measured 18
trucks in Germany by chasing them on the road, and report NOx EF of their measured
fleet to be 18 g kg−1. Carslaw and Rhys-Tyler (2013) report similar values 18.9 g kg−1 for vans (N1), but much higher for goods vehicles (average of HGV: 37.88 g kg−1
). The reason only BC or NOx EF between our measured fleet and other studies match may
25
ACPD
15, 15355–15396, 2015Black carbon, particle number concentration and
nitrogen oxide emission factors
I. Ježek et al.
Title Page
Abstract Introduction
Conclusions References
Tables Figures
◭ ◮
◭ ◮
Back Close
Full Screen / Esc
Printer-friendly Version Interactive Discussion
Discussion
P
a
per
|
Discussion
P
a
per
|
Discussion
P
a
per
|
Discussion
P
a
per
|
The NOx EF values of the gasoline and diesel cars in this campaign (6.3 and 15.4 g kg−1
respectively) resemble those reported by Carslaw and Rhys-Tyler (2013) (5.6 and 17.1 g kg−1 respectively). The median NOx EF of gasoline cars in this
campaign is slightly lower than that reported by the EEA (8.7 g kg−1) in Tier I ap-proach of their guide book; while those of diesel cars and LDV in this campaign are 5
slightly higher than the NOx EFs in the aforementioned guide book (13.0 g kg−
1 ). The goods vehicles NOx EFs (27.7 g kg−
1
) from this campaign resemble those reported by Shorter et al. (2005) for CRT (CRT stands for continuous regenerating technology) equipped buses (27.8 g kg−1
); and to HGV NOxEFs (25.9 g kg−1
) reported by Dallmann et al. (2011) for HGV emissions before vehicles had to be retrofitted with additional ex-10
haust after-treatment devices. The NOxEFs of goods vehicles measured in the present campaign are lower than HGV NOx EFs reported by Wang et al. (2012) (40.0 and 47.3 g kg−1), who used the same measurement method; lower than Carslaw and Rhys-Tyler (2013) (39.8 g kg−1) who used a stationary remote sensing method; and lower than HGV EF reported by EEA (33.4 g kg−1). This may indicate either that our goods
15
vehicles sample emitted less per unit of fuel; or that the measurement techniques used, produce different results. We have shown in Fig. 1 how using two different integration approaches yields in up to 16 % different results. Some differences between the stud-ies may arise from using the average value for representation of the vehicle categorstud-ies EF instead of the median, which is not as strongly influenced by super emitters as the 20
average.
The weight a truck engine has to pull can change drastically from an unloaded truck to twice or three times its unloaded mass, therefore we would expect its emissions would also change a lot more than we would expect them to change with a passen-ger car. This is one more variable that would be difficult to monitor under controlled 25
condition protocols.
HGV PN EF from Ban-Weiss et al. (2009) (4.7×10¹⁵kg−1) and from the study of
Hudda et al. (2013) (4.2 and 5.2×10¹⁵kg−1) resemble those of here presented diesel
ACPD
15, 15355–15396, 2015Black carbon, particle number concentration and
nitrogen oxide emission factors
I. Ježek et al.
Title Page
Abstract Introduction
Conclusions References
Tables Figures
◭ ◮
◭ ◮
Back Close
Full Screen / Esc
Printer-friendly Version Interactive Discussion
Discussion
P
a
per
|
Discussion
P
a
per
|
Discussion
P
a
per
|
Discussion
P
a
per
|
closer to our goods vehicle PN EF median (11.49×10¹⁵kg−1). The PN EF is most
dif-ficult to determine and compare because it depends on the measurement instrument and sampling conditions. Our measurements were conducted while chasing vehicles on highways and regional roads in winter, while others measured EF with remote sens-ing method at the end of a tunnel in summer. Each study used different measurement 5
instruments with different particle size measurement range. 2.5 Emission factors and vehicle age
In this segment we have further broken down each of our four vehicle groups to three age subgroups: less than 5 years; 5 to 10 years; and 10 or more years in use. We wanted to observe if newer vehicles showed an improvement in their emissions per 10
unit of fuel burned. The 5 and 10 year limits should roughly separate vehicles in three groups that comply with either the entry of Euro standards 4 or 5 (less than 5 year old vehicles), Euro standard 3 (5–10 year old vehicles), and Euro 2, 1 or pre-Euro vehicles (over 10 year old group). A clear separation between vehicles compliant Euro stan-dards cannot be made based solely on the date the vehicle was put in use, because 15
an improved vehicle may be put on the market before the date when the new standard is enforced, or a vehicle that is compliant to the old standard may still be put to use one year after the new standard enforcement date (2001/116/EC European Communi-ties, 2002). The vehicle age should reflect not only the deterioration of the engine and exhaust system, but also the technological advances made in engines and exhaust 20
systems over the years due to stricter emission standards.
The results show some improvement for the three investigated pollutants (Fig. 3). For BC EFs the improvement is most evident for less than 5 year old diesel cars, where we can see a 60 % drop in median values from 5–10 year old diesel cars to those with age less than 5 years. This reduction most probably reflects the impacts of regulations 25
ACPD
15, 15355–15396, 2015Black carbon, particle number concentration and
nitrogen oxide emission factors
I. Ježek et al.
Title Page
Abstract Introduction
Conclusions References
Tables Figures
◭ ◮
◭ ◮
Back Close
Full Screen / Esc
Printer-friendly Version Interactive Discussion
Discussion
P
a
per
|
Discussion
P
a
per
|
Discussion
P
a
per
|
Discussion
P
a
per
|
are commonly used in the post Euro 5 cars. We can also observe a 55 % decrease in median BC EF of gasoline cars from the oldest (10 or older) to the newest group (5 years or less). These vehicles are less critical regarding PM emission as diesel cars, whereas due to increased PM and especially PN emissions of direct injection gaso-line cars both are limited in recent Euro emission standards. Our results show that 5
compared to newest diesel cars category the gasoline cars have lower BC EF medi-ans in all three age groups. We can observe a 41 % decrease in BC EF median from goods vehicles older than 10 years to the 5–10 year category. Worryingly, the newest goods vehicles median BC EF increased by 34 % in comparison to the 5–10 year old group. Emission standards from Euro III to Euro IV for goods vehicles demanded PM 10
emissions (in g kW−1h−1) to reduce 5 fold. Unlike with passenger cars, the emission reduction of goods vehicles was achieved with SCR not with (DPF), and thus the soot emissions were not limited as efficiently.
In Fig. 3 we observed a 67 % decrease in goods vehicles PN EFs (in 1015kg−1) from 5–10 year old vehicles to those that were in use for less than 5 years. This may indicate 15
that either more agglomerated soot particles were being emitted or emissions of some of the particulate precursors had been reduced. Median PN EFs reduced by 67 % from the oldest to the newest diesel car group. For gasoline cars the PN EFs varied the most within individual age group, where individual vehicles with high emissions skewed the distribution.
20
In Fig. 3 we can observe the gradual decrease of NOx EFs from gasoline cars to diesel cars to goods vehicles, as it is also shown in Fig. 2, where also vehicles for which we did not get more detailed information were included. Goods vehicle NOxEFs
are showing an appreciable decrease in average and median values from oldest to newest age group (50 and 70 % respectively), which we postulate is due to increased 25
use of SCR in newer post Euro V vehicles, which can effectively reduce NOxemissions. When separated by age, we can see that now both NOx and BC EF correlate better to some of the previously published studies (Table 7). The 10 year or older goods vehicles (BC and NOx EF respectively 0.7, 43.95 g kg−
1
ACPD
15, 15355–15396, 2015Black carbon, particle number concentration and
nitrogen oxide emission factors
I. Ježek et al.
Title Page
Abstract Introduction
Conclusions References
Tables Figures
◭ ◮
◭ ◮
Back Close
Full Screen / Esc
Printer-friendly Version Interactive Discussion
Discussion
P
a
per
|
Discussion
P
a
per
|
Discussion
P
a
per
|
Discussion
P
a
per
|
Chongqing EFs; and our less than 5 year old goods vehicles (median BC and NOxEF, respectively 0.55, 13.37 g kg−1
) relate better with the most recent situation reported in the US for high cargo route in California (I-710) by Hudda et al. (2013).
Diesel cars’ maximum NOx EFs increased in the newest group but the median of the group decreased by 24 % in comparison to 5–10 year old diesel cars. NOx emission 5
standards for diesel and gasoline cars were introduced with the Euro 3 standard. We could observe a reduction of gasoline car median NOx EF from those in use for over
10 years to those in use for 5–10 years. At this time the use of the three way catalysts was common in the market and according to our results efficient in reducing NOx emis-sions. The median did not reduce further for diesel cars that were in use for less than 10
5 years but the average value did. The decrease of emissions is smaller than we would expect it to be according the newer European emission standards. We postulate that this is because the emissions of Euro 5 diesel cars were achieved with DPF, not in-cluding de-NOxdevices, in such instances driving that would be more aggressive than NEDC would not reflect more stringent NOxEuro emission standards in real world
driv-15
ing. In the study of Carslaw and Rhys-Tyler (2013) they found a satisfactory reduction of average NOx EF only for gasoline cars but not for diesel cars.
Carslaw and Rhys-Tyler found an influence of vehicle manufacturer on NOx EFs for
Euro 4/5; this could potentially explain the skewed NOxEF distribution observed in our
fleet, if some of the manufacturers would be disproportionally represented. However, 20
Carslaw and Rhys-Tyler did not reveal the brands that produce lower EF values; and our sample size is too small compared to the number of manufacturers for us to consider debating such trends in our fleet.
The reason the EF distributions are skewed and some an order of magnitude higher than the rest may be because, at the time of our measurements, these cars were 25
ACPD
15, 15355–15396, 2015Black carbon, particle number concentration and
nitrogen oxide emission factors
I. Ježek et al.
Title Page
Abstract Introduction
Conclusions References
Tables Figures
◭ ◮
◭ ◮
Back Close
Full Screen / Esc
Printer-friendly Version Interactive Discussion
Discussion
P
a
per
|
Discussion
P
a
per
|
Discussion
P
a
per
|
Discussion
P
a
per
|
2.6 Emission factors according to maximum net engine power and maximum
net engine power to vehicle weight ratio
In addition to the information about the vehicle engine type, their category and the date of first use, the registration database also provided information about the engine’s maximum net power and vehicle curb weight. We present in this section the EFs sorted 5
according to the engine maximum net power and the ratio of engine’s maximum net power to vehicle’s curb weight. Here, we do not use the same vehicle groups as in the previous subchapter. Rather we separated the vehicles to gasoline and diesel engines and then further according to different size bins for both engine maximum net power and maximum net power to weight ratio. The sizes of the bins were determined in a way 10
that a single bin size would not include a disproportionally large number of vehicles and that each bin would have enough vehicles for a statistical presentation. There are also some gaps between the adjacent bins; this is because there were no vehicles in that range. The results are shown in Fig. 4.
When EF are sorted by vehicle’s engine maximum net power, we can see that diesel 15
engines in the lowest maximum net power bin (less than 70 kW) feature highest median BC EFs and that the more powerful diesel engines feature lower BC EFs. The trend is reversed for NOx EF, where more powerful larger vehicles feature higher NOx EF.
There is an exception for NOx EF in the least powerful diesel group, which feature relatively high NOx EF compared to the adjacent engine power bins.
20
The ratio of maximum engine power to vehicle curb weight can give a rough estimate of the engine load under which the vehicle has to operate in normal driving conditions. Large trucks have high vehicle mass but low maximum net power to vehicle mass ratio. Smaller vehicles have smaller mass but higher maximum net power to vehicle mass ratios, and for the smallest vehicles the ratio again decreases. A vehicle with 25
ACPD
15, 15355–15396, 2015Black carbon, particle number concentration and
nitrogen oxide emission factors
I. Ježek et al.
Title Page
Abstract Introduction
Conclusions References
Tables Figures
◭ ◮
◭ ◮
Back Close
Full Screen / Esc
Printer-friendly Version Interactive Discussion
Discussion
P
a
per
|
Discussion
P
a
per
|
Discussion
P
a
per
|
Discussion
P
a
per
|
result in more thermic NOx. This trend in NOxcan be observed in Fig. 4 for both diesel and gasoline engines, where we can see that vehicles with low power to mass ratio produce higher NOxEF and vehicles with high power to mass ratio produce lower NOx
EF. For BC and PN EF the trend is not as clear as it is for NOx, it could be described as a gradual increase of EF from low to high power to mass ratios but in the highest 5
power to mass ratio bin the median BC and PN EF drop.
We separated the gasoline vehicles into two groups for each observed parameter. The differences between gasoline vehicle categories are difficult to observe. We pos-tulate this is because we were only operating with cars and the change in the vehicle mass and mass to power ratio was smaller than it was for the vehicles with diesel 10
engines which included trucks.
2.7 Contribution of high emitters to our measured fleet
The contribution of high emitters to the measured vehicle fleet was calculated as cu-mulative emissions. To exclude large differences in fuel consumption between trucks and cars, we calculated high emitter contribution separately for goods vehicles, gaso-15
line cars and diesel cars. The cumulative emission distribution of our vehicle fleet were calculated arranging the vehicles from highest to lowest emitters as it was previously done in similar studies (Ban-Weiss et al., 2009; Dallmann et al., 2012; Wang et al., 2011, 2012). The results in Fig. 5 show that 25 % of highest emitting vehicles in each vehicle category produce 50 to 65 % of BC emissions, 47 to 55 % of NOxemissions and 20
ACPD
15, 15355–15396, 2015Black carbon, particle number concentration and
nitrogen oxide emission factors
I. Ježek et al.
Title Page
Abstract Introduction
Conclusions References
Tables Figures
◭ ◮
◭ ◮
Back Close
Full Screen / Esc
Printer-friendly Version Interactive Discussion
Discussion
P
a
per
|
Discussion
P
a
per
|
Discussion
P
a
per
|
Discussion
P
a
per
|
3 Conclusions
During the measurement campaign the BC, PN and NOx EFs for 139 different vehicles
were successfully determined. The sample fleet statistics was compared to Eurostat data for Slovenia and Europe. An excellent agreement between the composition of the average European and Slovenian car fleet, and the car sample fleet sampled in this 5
campaign was found. The main results of this research are the first reported on-road BC EF for diesel cars, and first BC, PN and NOx EF for passenger cars measured with the on-road chasing technique. In order to compare the results of this study to previous ones, EFs of goods vehicles were also determined. EF distributions for BC, PN and NOx were presented for three vehicle groups: diesel cars, gasoline cars and 10
goods vehicles. Differences between the EF frequency distributions of the three vehicle categories for all three investigated pollutants were observed, the most important being the highest median BC EF value of diesel cars, and an increase in NOx EFs from the least powerful to more powerful diesel vehicles.
The results of this study were compared to the results of previous studies that used 15
similar methods. The median BC EFs for the diesel cars (0.79 g kg−1) determined in
this study is similar to the HGV EFs mean reported by Dallmann et al. (2011); and Wang et al. (2012), where vehicles were subject to less strict emission regulations. Goods vehicles BC EF median determined here resembles the EFs determined for vehicles subject to stricter emission standards. The goods vehicle median NOx EF
re-20
ported in this study resembles those determined by Dallmann et al. (2011) and Shorter et al. (2005).
The median BC EF value of newer diesel and gasoline cars (less than 5 years) is lower than the value for the older car categories. For the goods vehicles it lies between the medians of the two older goods vehicles groups. Contrary to BC EF, goods vehicles 25
ACPD
15, 15355–15396, 2015Black carbon, particle number concentration and
nitrogen oxide emission factors
I. Ježek et al.
Title Page
Abstract Introduction
Conclusions References
Tables Figures
◭ ◮
◭ ◮
Back Close
Full Screen / Esc
Printer-friendly Version Interactive Discussion
Discussion
P
a
per
|
Discussion
P
a
per
|
Discussion
P
a
per
|
Discussion
P
a
per
|
vehicles. PN EF median values decreased for vehicles in use for less than 5 years in all three vehicle groups compared to older ones, but unfortunately the span of PN EFs of goods vehicles and gasoline cars increased. We attribute the decreases to advances made in engine operation and exhaust after treatment devices.
The contribution of highly emitting vehicles was calculated and, as in previous stud-5
ies (e.g. Ban-Weiss et al., 2009; Wang et al., 2015, 2012), a small number of vehicles (25 %) was found to disproportionately contribute to the total fleet emissions (47 to 87 %). The exclusion of high emitters by retrofitting old vehicles with after-treatment devices and encouraging the sale of new vehicles through the exchange of older vehi-cles, has shown to be an effective measure to reduce vehicle emission rates (Dallmann 10
et al., 2011) locally. Unfortunately, the older vehicles might be sold in countries beyond the reach of the EU regulations, and would still have a negative impact on air quality and the climate elsewhere.
The methodology used in this study is a relatively simple and efficient approach for monitoring emissions of the in-use vehicle fleet, and investigating the effectiveness of 15
emission reduction measures (also shown in Dallmann et al., 2011, and Wang et al., 2011). Real world measurements are important because individual vehicle emissions depend not only on the vehicle type approval at the time it is put on the market, but also on their maintenance and the driving conditions.
The Supplement related to this article is available online at 20
doi:10.5194/acpd-15-15355-2015-supplement.
Acknowledgements. This research was part founded by European Social found (SPIRIT, con-tract no. P-MR-10/04). The authors would like to acknowledge Slovenian Ministry of Infras-tructure and Spatial Planning for providing the vehicle registration information; TSI for lending their instrument; Polona Ježek for lending her vehicle; Anže Buh for driving the mobile station 25
ACPD
15, 15355–15396, 2015Black carbon, particle number concentration and
nitrogen oxide emission factors
I. Ježek et al.
Title Page
Abstract Introduction
Conclusions References
Tables Figures
◭ ◮
◭ ◮
Back Close
Full Screen / Esc
Printer-friendly Version Interactive Discussion
Discussion
P
a
per
|
Discussion
P
a
per
|
Discussion
P
a
per
|
Discussion
P
a
per
|
and G. Močnik were employed in Aerosol d.o.o. where the Aethalometer was developed and is manufactured.
References
ACEA: The Automobile Industry Pocket Guide, ACEA Commun. Dep., available at: http:// www.acea.be/uploads/publications/ACEA_POCKET_GUIDE_2012_UPDATED.pdf (last ac-5
cess: 5 June 2015) 2012.
Ban-Weiss, G. A., Lunden, M. M., and Kirchstetter, T. W.: Measurement of black carbon and particle number emission factors from individual heavy-duty trucks, Environ. Sci. Technol., 43, 1419–1424, 2009.
Bishop, G. A. and Stedman, D. H.: A decade of on-road emissions measurements, Environ. 10
Sci. Technol., 42, 1651–1656, 2008.
Bishop, G. A., Stedman, D. H., and Ashbaugh, L.: Motor vehicle emissions variability, J. Air Waste Manage., 46, 667–675, 1996.
Bond, T. C., Doherty, S. J., Fahey, D. W., Forster, P. M., Berntsen, T., DeAngelo, B. J., Flan-ner, M. G., Ghan, S., Kärcher, B., Koch, D., Kinne, S., Kondo, Y., Quinn, P. K., Sarofim, M. C., 15
Schultz, M. G., Schulz, M., Venkataraman, C., Zhang, H., Zhang, S., Bellouin, N., Gut-tikunda, S. K., Hopke, P. K., Jacobson, M. Z., Kaiser, J. W., Klimont, Z., Lohmann, U., Schwarz, J. P., Shindell, D., Storelvmo, T., Warren, S. G., and Zender, C. S.: Bounding the role of black carbon in the climate system: a scientific assessment, J. Geophys. Res.-Atmos., 118, 5380–5552, doi:10.1002/jgrd.50171, 2013.
20
Canagaratna, M. R., Jayne, J. T., Ghertner, D. a., Herndon, S., Shi, Q., Jimenez, J. L., Silva, P. J., Williams, P., Lanni, T., Drewnick, F., Demerjian, K. L., Kolb, C. E., and Worsnop, D. R.: Chase studies of particulate emissions from in-use New York City vehicles, Aerosol Sci. Tech., 38, 555–573, doi:10.1080/02786820490465504, 2004.
Carslaw, D. C. and Rhys-Tyler, G.: New insights from comprehensive on-road measurements of 25
NOx, NO2and NH3from vehicle emission remote sensing in London, UK, Atmos. Environ., 81, 339–347, doi:10.1016/j.atmosenv.2013.09.026, 2013.
Dallmann, T. R., Harley, R. A., and Kirchstetter, T. W.: Effects of diesel particle filter retrofits and accelerated fleet turnover on drayage truck emissions at the port of Oakland, Environ. Sci. Technol., 45, 10773–10779, 2011.